
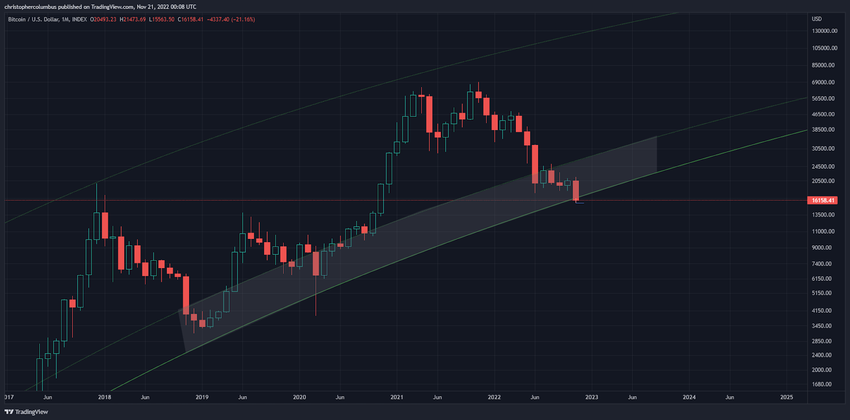
Bitcoin is on the verge of another long-term model. A loss of the $16,000 area could result in further declines, which could put the largest cryptocurrency at unprecedented lows.
Dave the Wave is a well-known cryptocurrency analyst on crypto Twitter, whose profile is followed by more than 130k users. In a tweet yesterday, he published an update to his Logarithmic Growth Curve (LGC) model.
According to his charts, Bitcoin today is exactly at the lower edge of the long-term logarithmic curve, which has historically acted as support. In the history of BTC, there has already been price action below this curve, such as in the 2015 bear market or during the COVID-19 crash in March 2020.
However, if such a decline and capitulation occurred, they did not last long, and Bitcoin quickly regained its long-term support. Usually, these were signals of the end of a bear market and the beginning of a new bull market.
Will the LGC model collapse?
The LGC model was created by @davthewave in 2018, and since then it seemed to describe the BTC price action well. According to its creator’s assumptions, the cryptocurrency market is now mature enough that “many are accepting the idea of a log growth curve in BTC.” LGC distinguishes three key moments:
- a plateau at the top
- a converging channel
- rejection of all cycle theory [even lengthening] in an increasingly liquid market
The above 3 key features were formulated in November 2021, just after BTC reached its all-time high (ATH) of $69,000. Almost exactly since then, the price of BTC has been steadily declining, and the crypto market has experienced a long-term bear market.
Bitcoin’s ongoing decline undermines all 3 of the above points today. We are not observing a plateau at all; the channel is narrowing and giving less tolerance to BTC price decline. On the other hand, the current bear market and the 77% drop in the BTC price from ATH only reinforce the hypothesis of Bitcoin cycles. Events such as the collapse and bankruptcy of Terra (LUNA), Celsius, and FTX show how quickly liquidity can disappear from the cryptocurrency market.
In a comment to his tweet, the analyst said that close attention should be paid to the monthly close, which will occur in about 10 days. For the moment, the price action has “nothing technically too catastrophic yet,” but the lower edge of the model is struggling to hold.
Make it or break it time for BTC. If Bitcoin closes the month below $16,000, there is a high probability that the LGC model will collapse and the declines will continue. If, on the other hand, it manages to maintain the lower logarithmic curve and bounce, it could signal a new bull market.
Recent decline and bounce in anticipation of halving
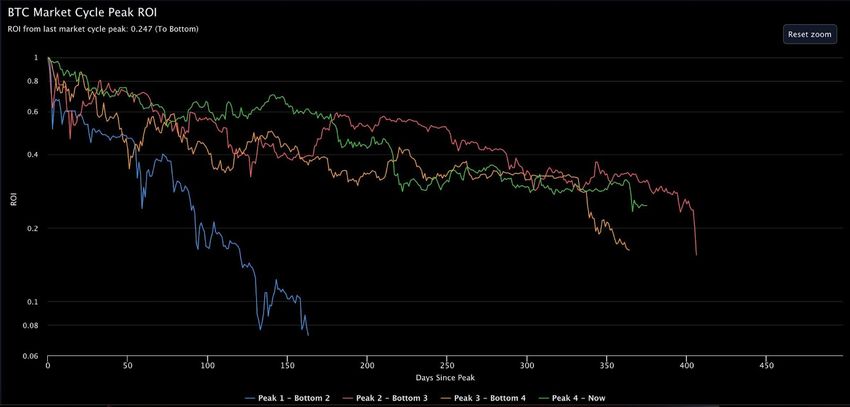
One of the best-known advocates of Bitcoin’s cyclical nature and the hypothesis of lengthening cycles is Benjamin Cowen. He recently published a chart comparing the current bear market (green) with the previous three. In the chart, we can see the return on investment (ROI) of BTC, assuming that someone bought at the absolute peak.
The chart shows that Bitcoin is at a very interesting point today. On the one hand, it has been 376 days since the ATH. In the previous two bear markets, the period was 363 days in 2018 and 410 days in 2015.
On the other hand, we can see that the current ROI is 0.247. In previous bear markets, it always fell below the value of 0.2. If this were to be the case now as well, Bitcoin is in for another leg down to reach the macro bottom of this cycle.
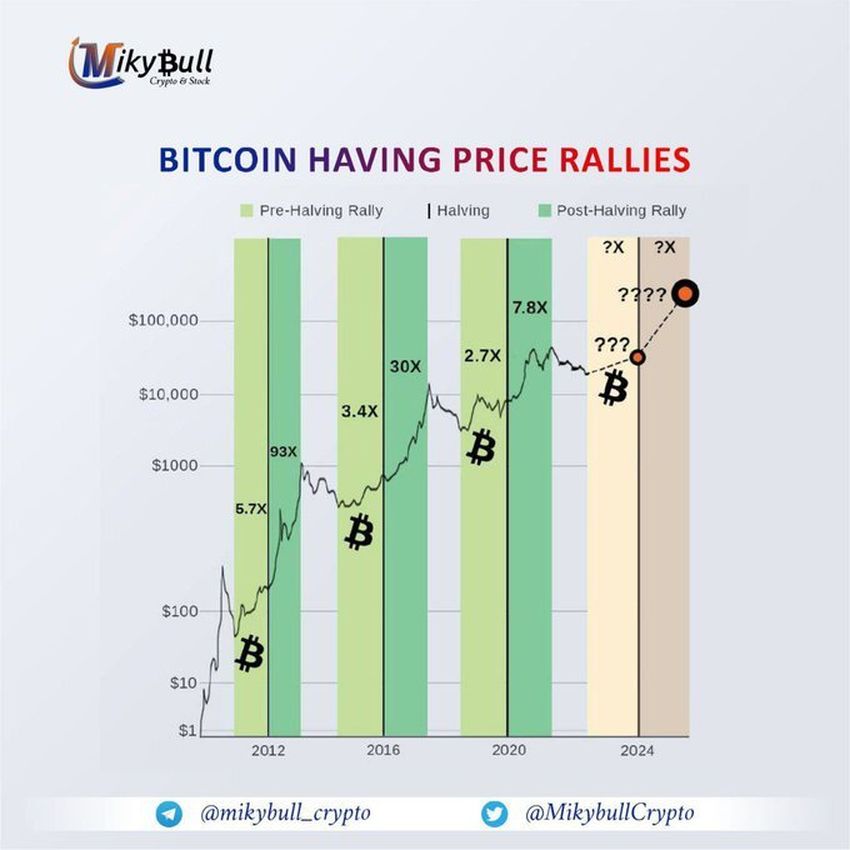
An interesting addition to this perspective is the chart recently posted by @MikybulCrypto, where we see the BTC price in the context of subsequent halving. Bear markets are shown here in gray, with relatively small increases before halving in light green, and the largest rallies after halving in dark green.
Here, too, we see – as in Benjamin Cowen’s data – that the declines in this cycle have been going on long enough to expect a macro bottom. Moreover, we see how both stages in successive bull markets have delivered smaller and smaller ROIs. This supports the diminishing returns hypothesis and again emphasizes that Bitcoin is in make it or break it time.
For BeInCrypto’s latest Bitcoin (BTC) analysis, click here.
