


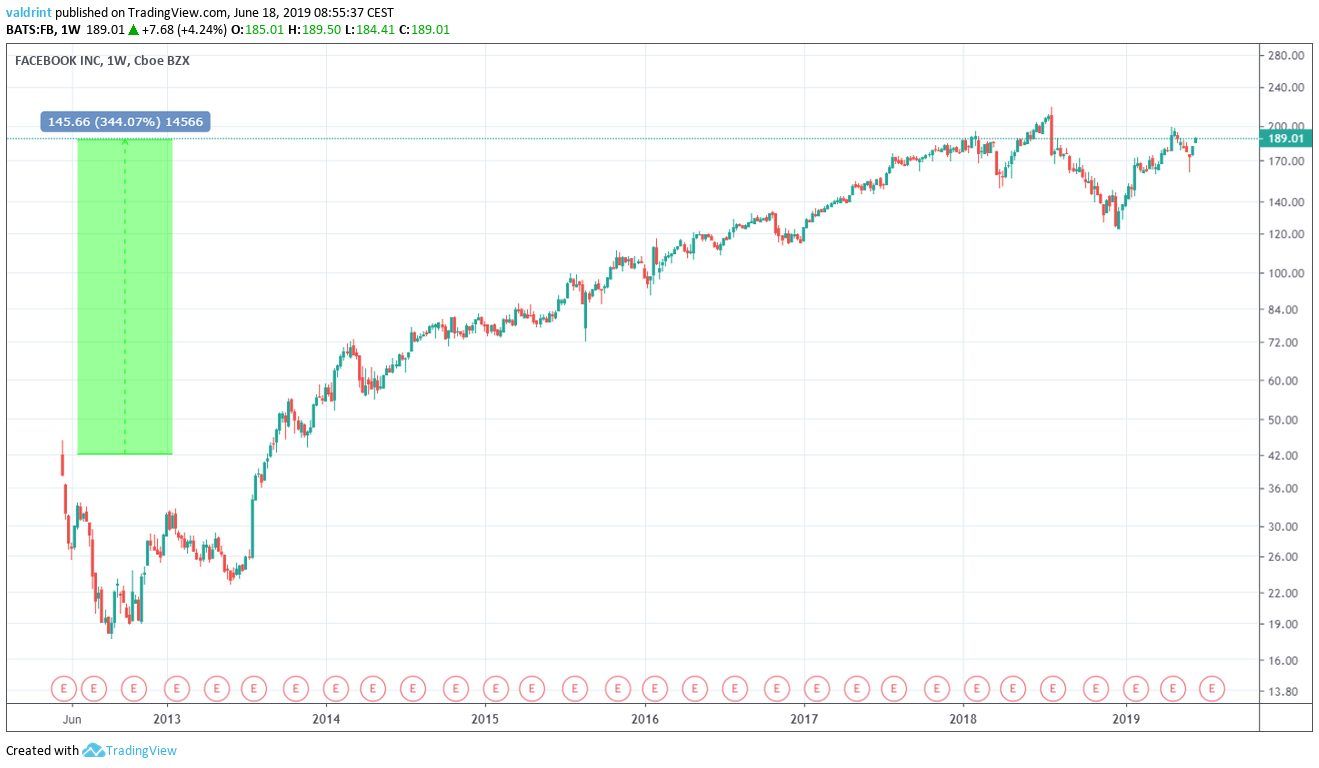
On May 18, 2012, Facebook Inc. (FB) held its initial public offering. The share prices opened at $42.05, before dropping and closing at $38.0 for the day.
In September of the same year, the price hit a low of $17.55. Since that point, however, it has been steadily increasing.
At the time of writing, FB was trading at $189. Measuring from the opening price, this is an increase of 344 percent.
Facebook is expected to launch its native digital currency ‘Libra’ on June 18, 2019.
Will this have an effect on its price? Do the current market conditions point towards a price surge?
Continue reading for our analysis and opinions.
Facebook: Trends And Highlights For June 18
- The price previously broke down from an ascending channel.
- It is trading above the weekly moving averages.
- Price made an attempt at breaking out above the resistance at $200.
- There is a slight bearish divergence developing in the RSI and the MACD.
Weekly Time-Frame
Since February 2014, when the price made lows near $55, it has been trading inside the parallel ascending channel outlined below:
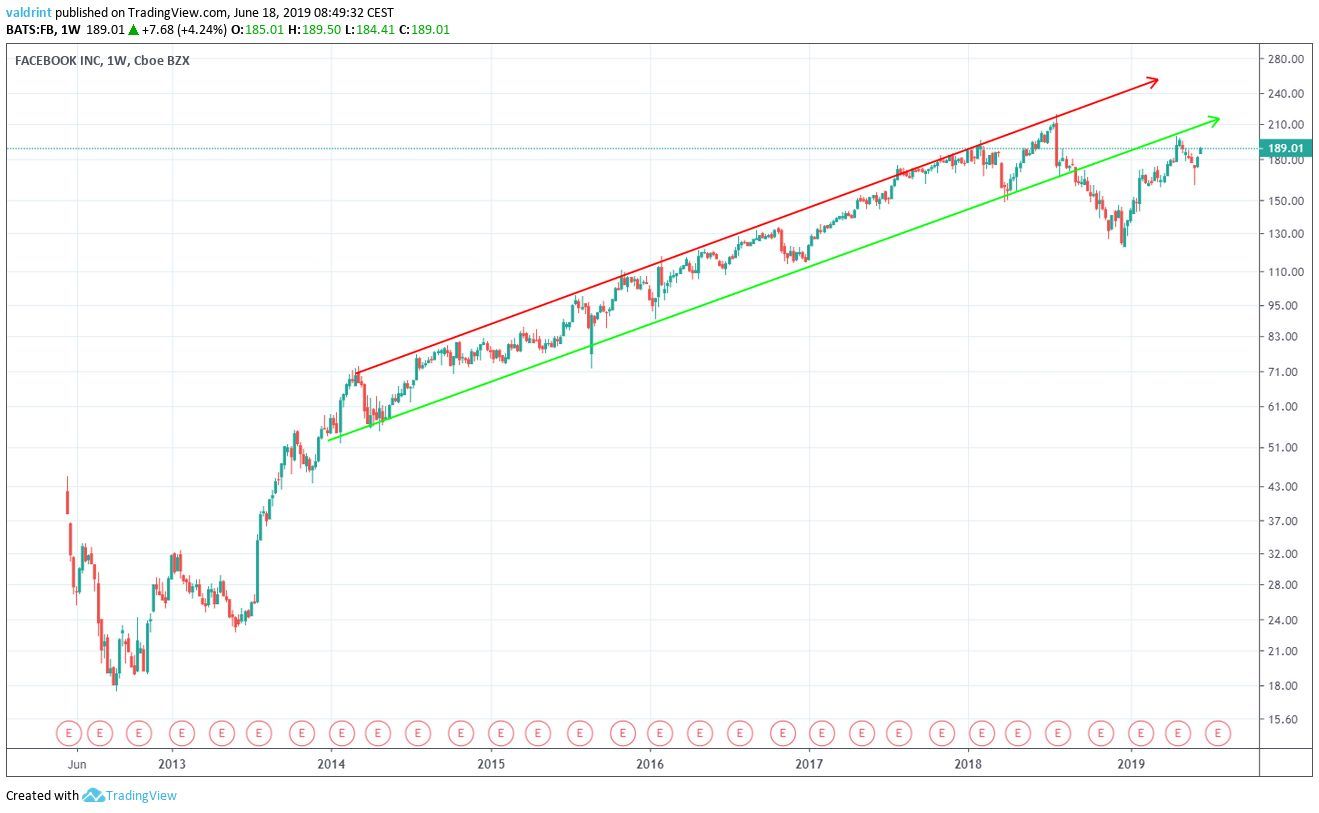
In July 2018, the price made an all-time high of $218.69. Afterward, it began to decrease and broke down from this channel on Sep 2018. A reversal ensued shortly after, and the price increased to touch the previous support line.
During this drop, the price initially fell below the moving averages, as is visible in the graph below:
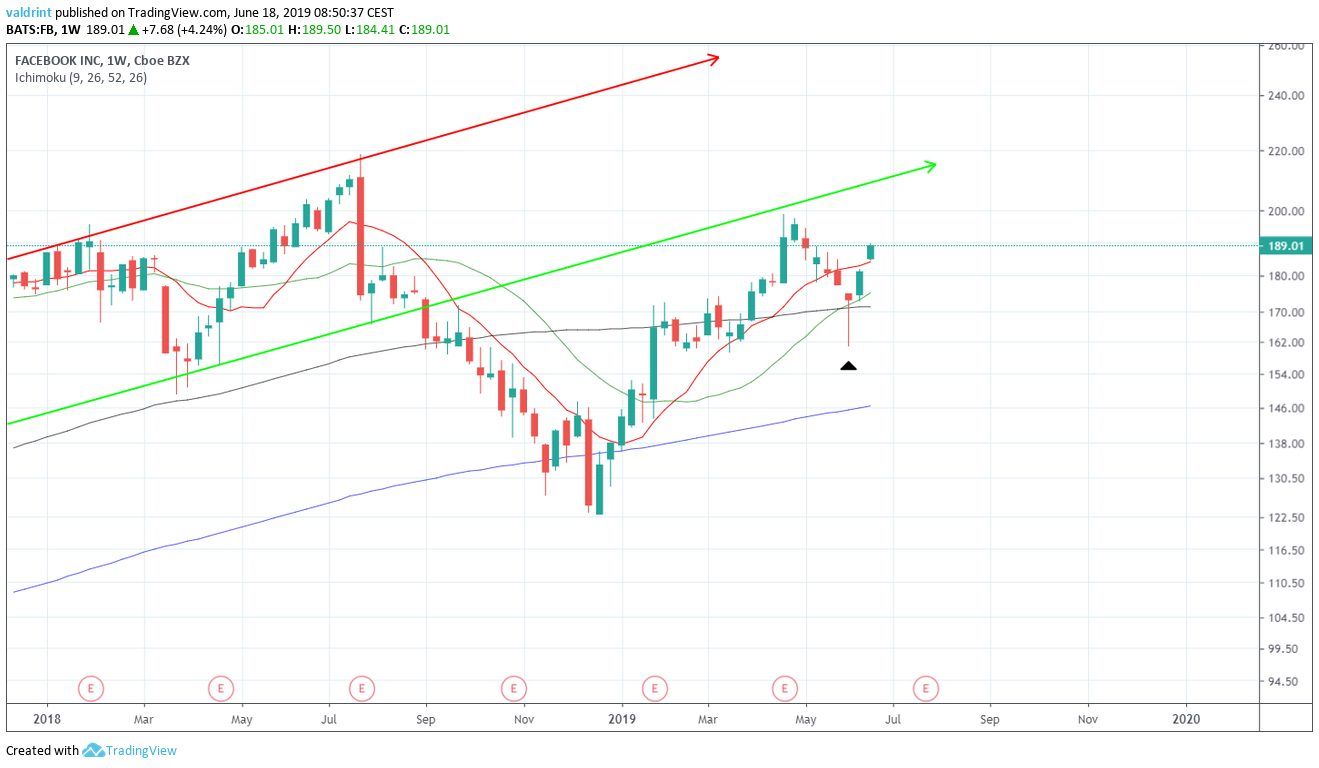
However, at the beginning of 2019, it found support above the 200-week MA. An upward move was initiated, which was combined with a bullish cross between the 10 and 20-period MAs in Feb of the same year. This is often a sign that a short-term uptrend has begun.
After another small downward move, the price created a hammer candlestick in the week of June 2-8. When found in a downtrend, it is often a sign of reversal. Prices have been increasing since, trading above all the moving averages.
Daily Time-Frame
As mentioned in the previous section, the price made a high of $218.69 before beginning to decrease. The ensuing reversal took the price right to the 0.786 fib ratio of the entire drop.
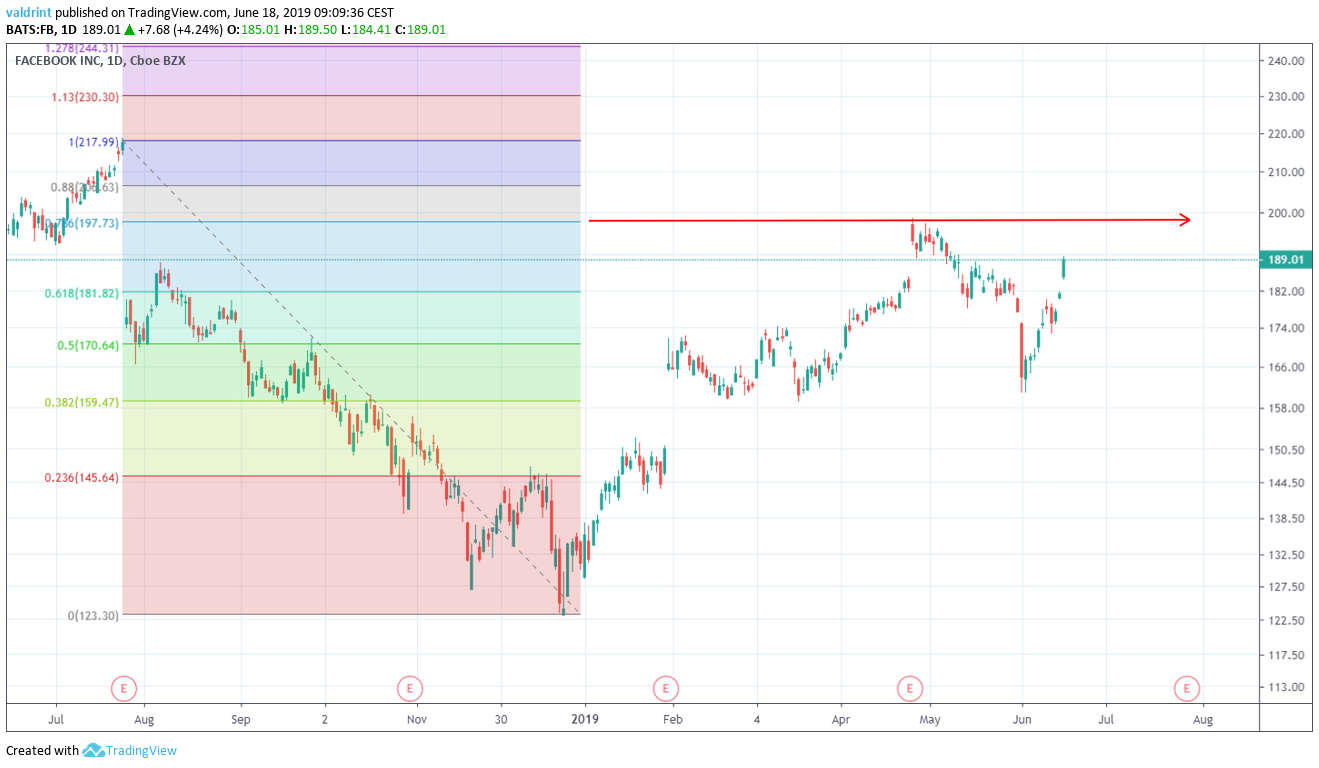
The first attempt at a breakout was unsuccessful. At the time of writing, the price was initiating a second.
During the first attempt, the price created bearish divergence in both the RSI and the MACD. The divergence was more pronounced in the MACD.
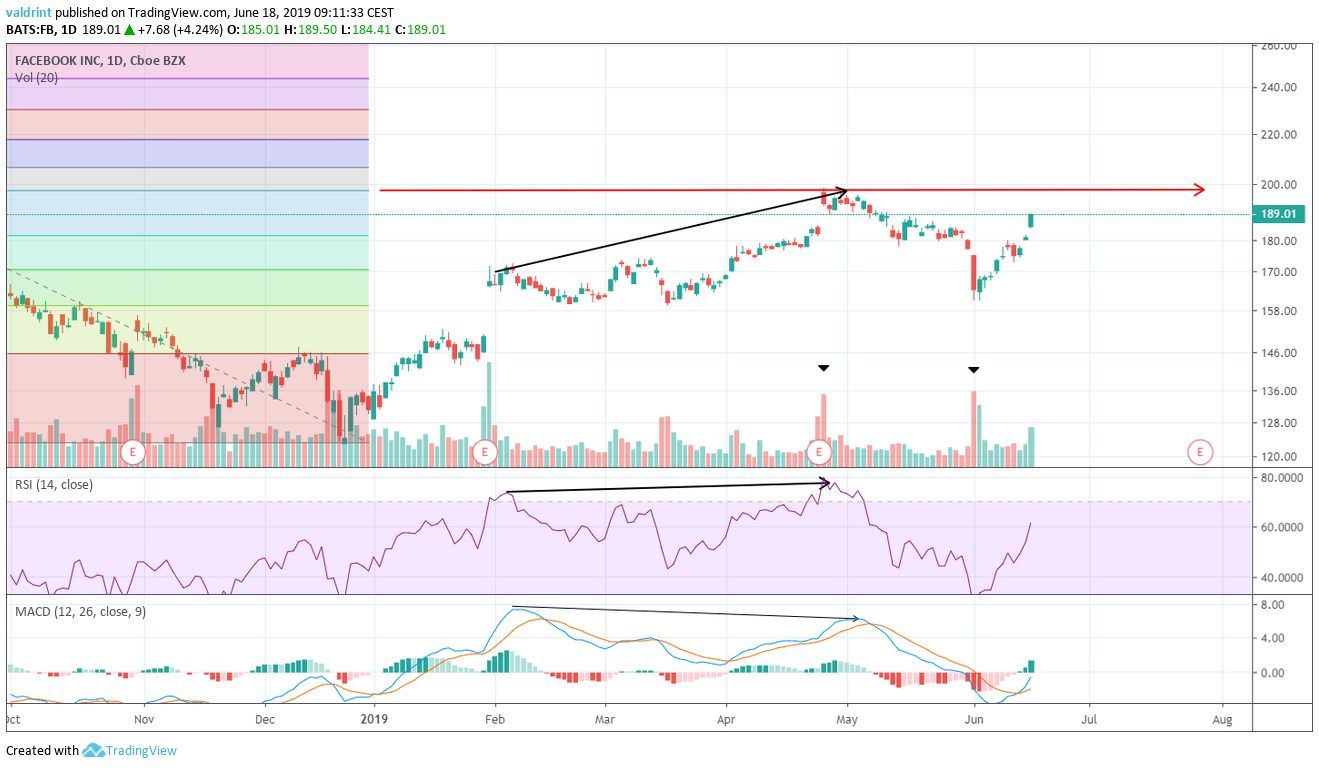
Furthermore, the volume during bearish candles has been higher than during bullish ones. This was especially evident on April 25, when the price made its first breakout attempt. However, yesterday’s candle had significant volume. It is worth keeping an eye on today’s candle to see if it will act similarly.
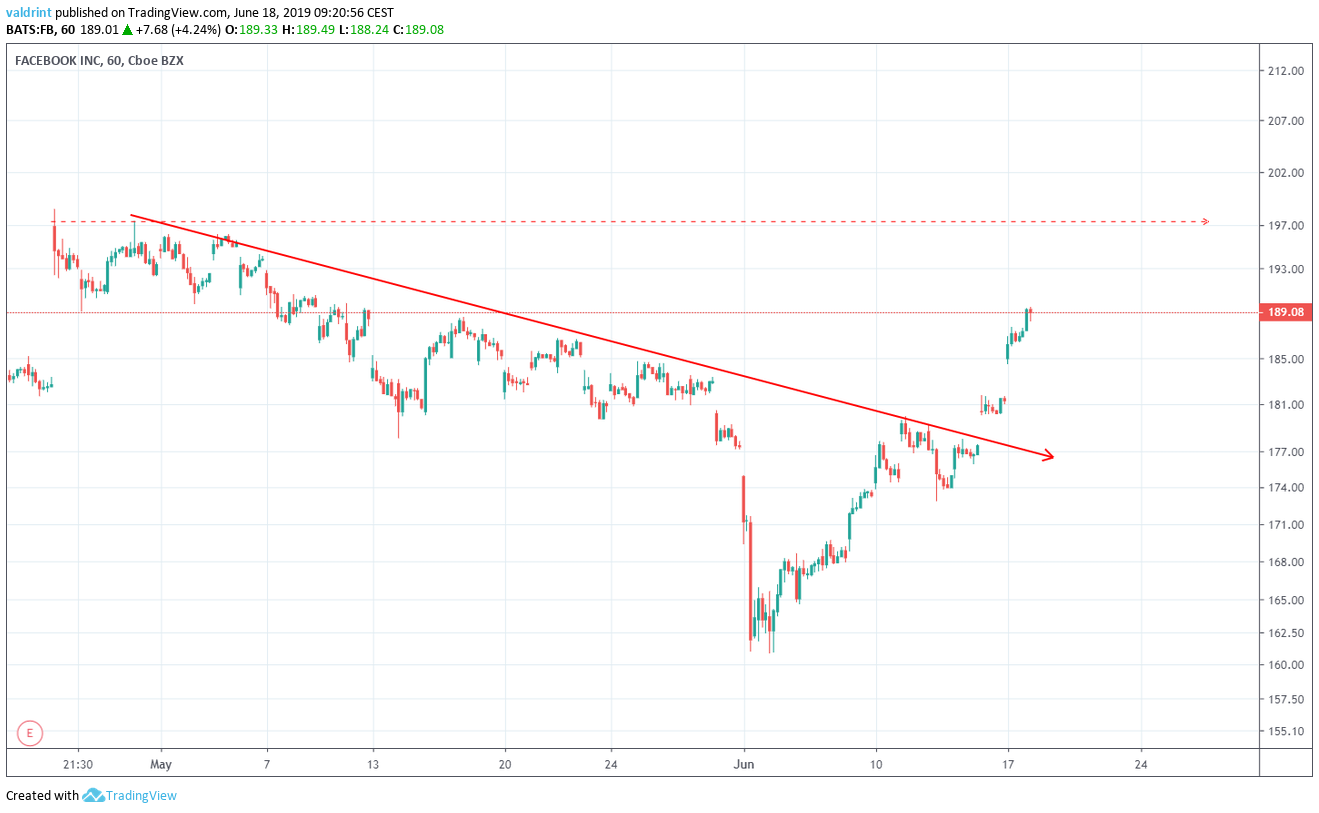
In very short-term time-frames, the price broke out above the resistance line without experiencing a pullback and is currently headed towards another resistance line near $200.
Do you think the price of Facebook will break out above the $200 resistance? Let us know your thoughts in the comments below.
Disclaimer: This article is not trading advice and should not be construed as such. Always consult a trained financial professional before investing in cryptocurrencies, as the market is particularly volatile.


