


Ethereum (ETH) is approaching a long-term resistance area between $835-$1015. This range contains a crucial Fib retracement level measured from the all-time high price.
The Ethereum trend has not shown any weakness yet, suggesting that the $835 area will be reached.
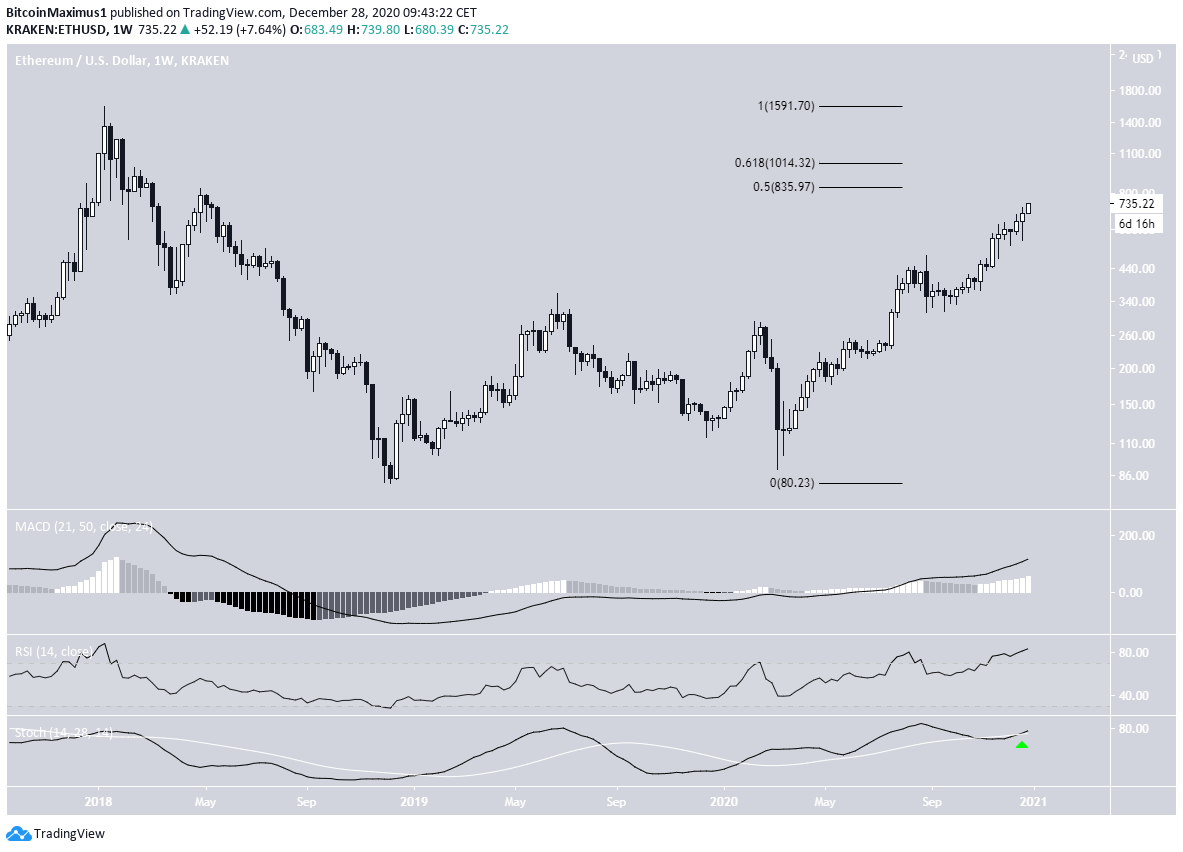
Long-Term Ethereum Levels
The weekly chart for ETH shows that the price is approaching the long-term $835 resistance level (0.5 Fib retracement). If successful in moving above it, the next resistance area would be found at $1,014, (0.618 Fib retracement).
Weekly indicators have not yet shown any weakness, suggesting that the bullish trend is expected to continue.
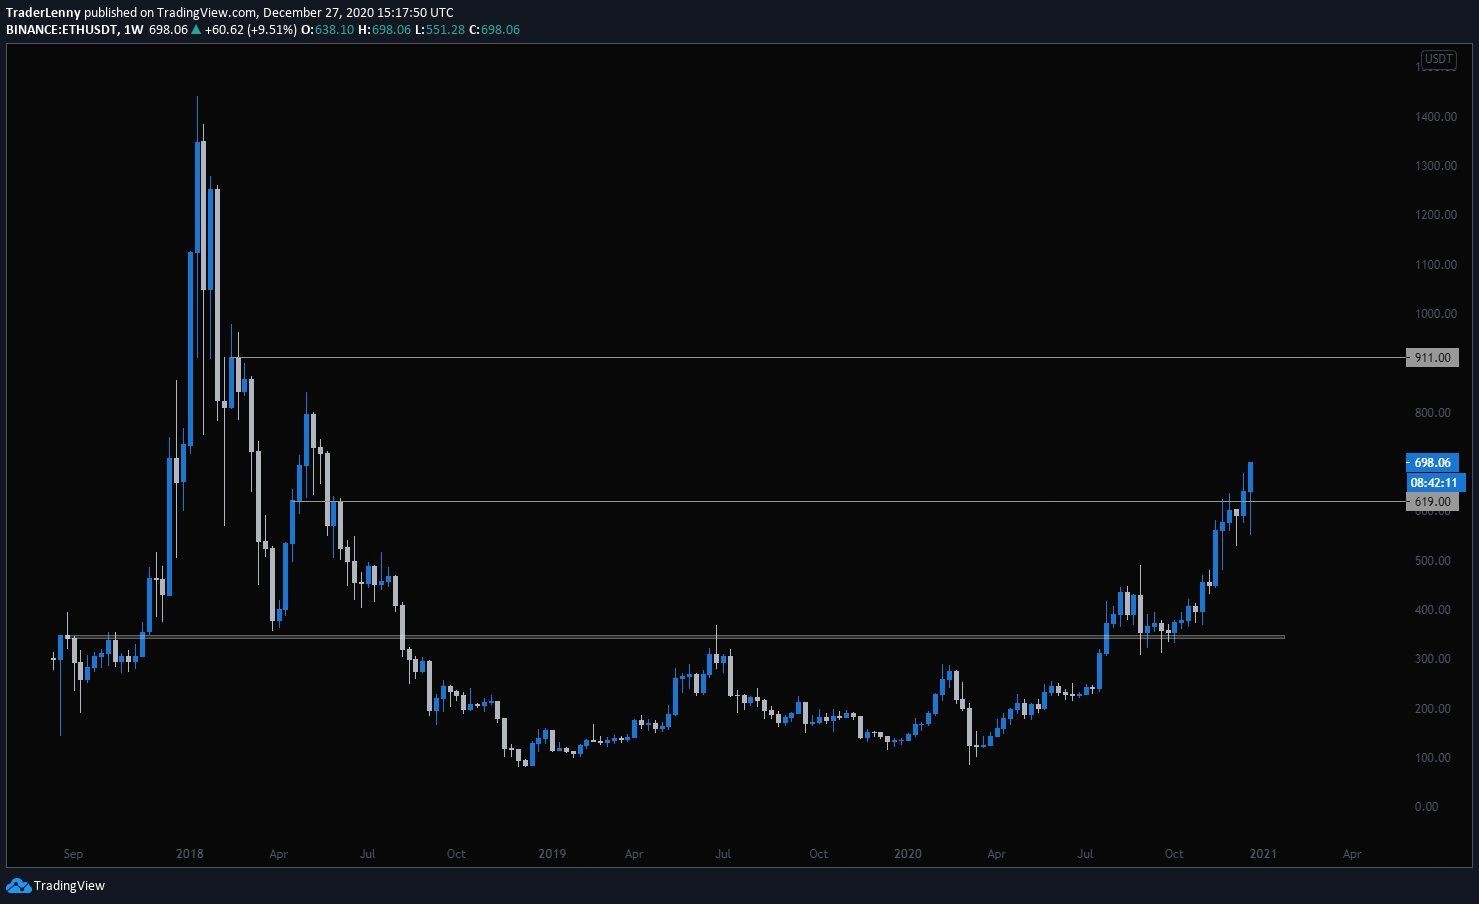
Cryptocurrency trader @TraderLenny outlined an ETH chart, stating that because of its weekly close, the price is expected to explode.
If ETH is successful in moving above $835 as indicators suggest, it could indeed rapidly increase towards $1,014.
Ongoing Increase
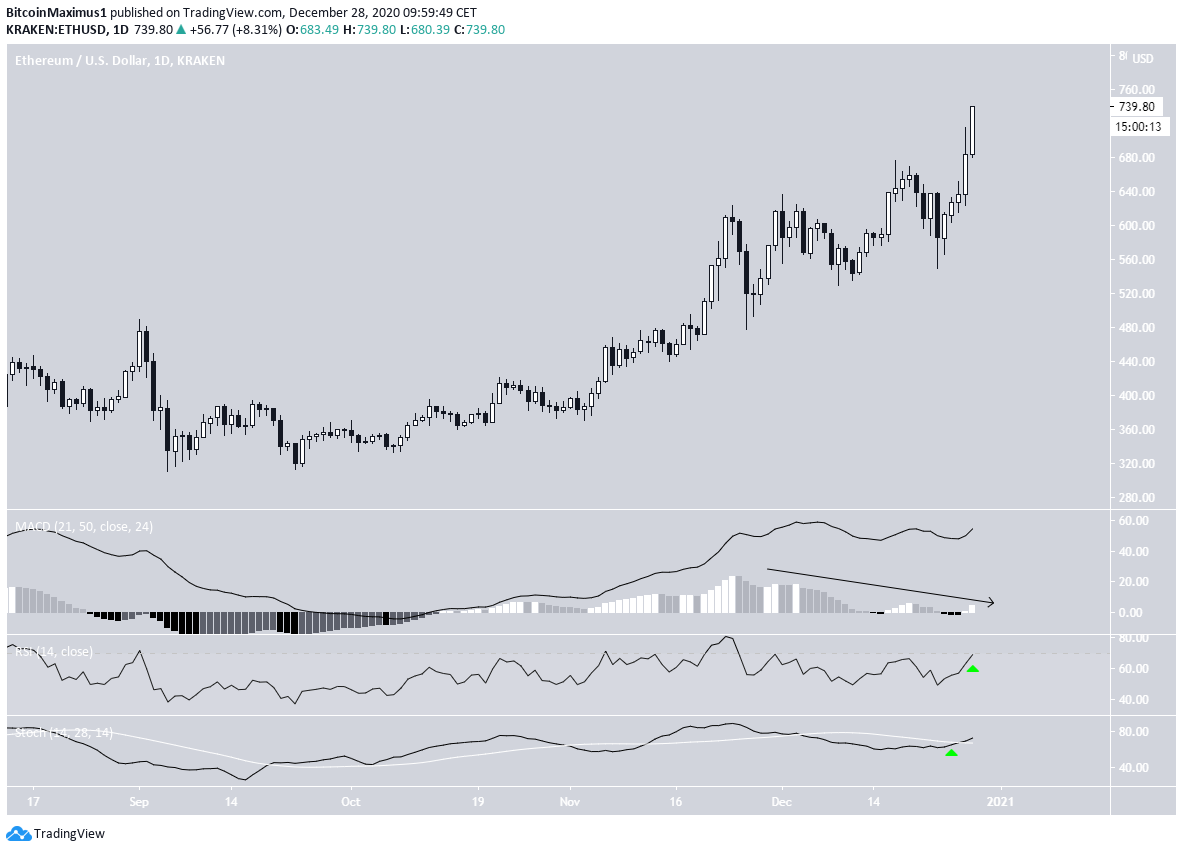
The daily chart for ETH shows the ongoing upward move and the lack of immediate resistance above the current price, with the exception of the previously outlined Fib retracement levels.
While the MACD is losing strength, both the RSI and Stochastic oscillator are moving upwards. This supports the possibility that ETH continues to increase towards the previously outlined targets.
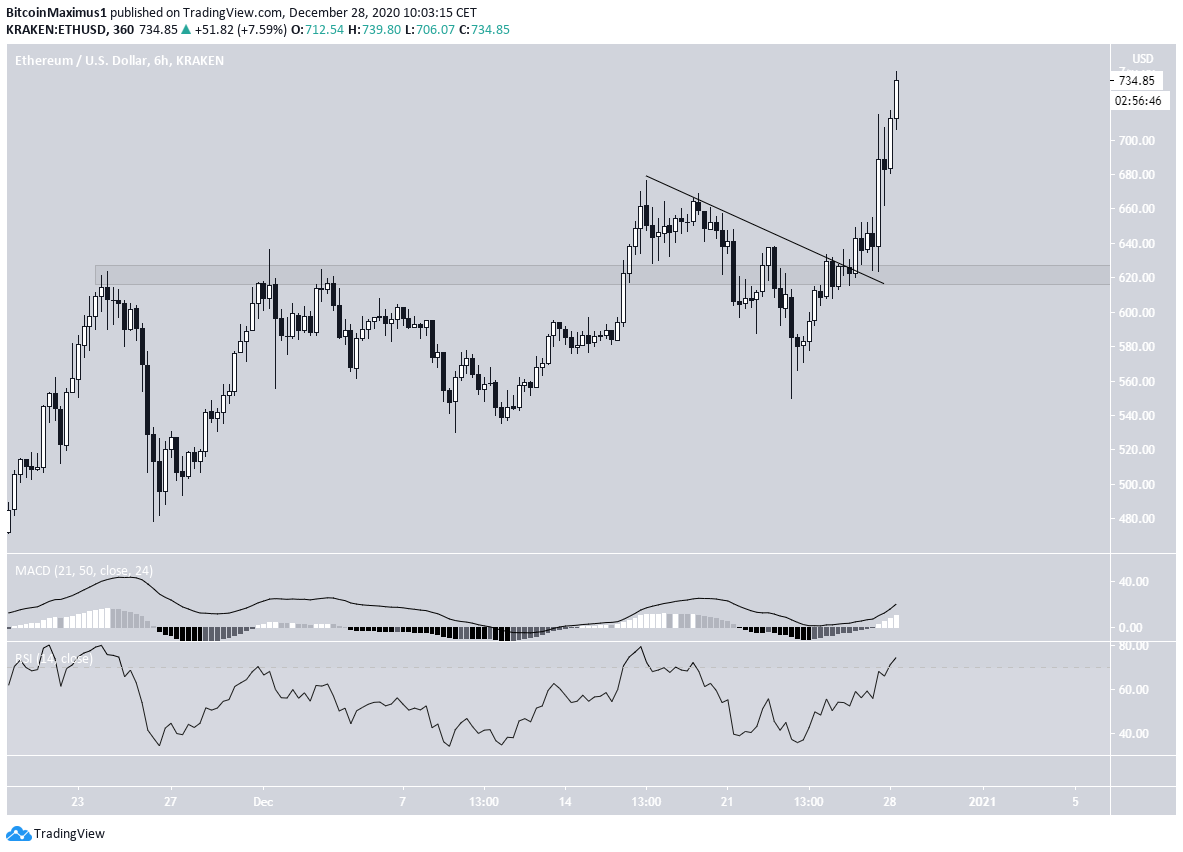
Similarly, the six-hour chart shows that ETH has broken out from a descending resistance line and has been increasing since validating it as support.
Furthermore, it is also trading above the $625 support area. As long as it’s above this support, the trend is considered bullish. Also, there is no weakness in technical indicators, further supporting the possibility that ETH will continue increasing towards the targets.
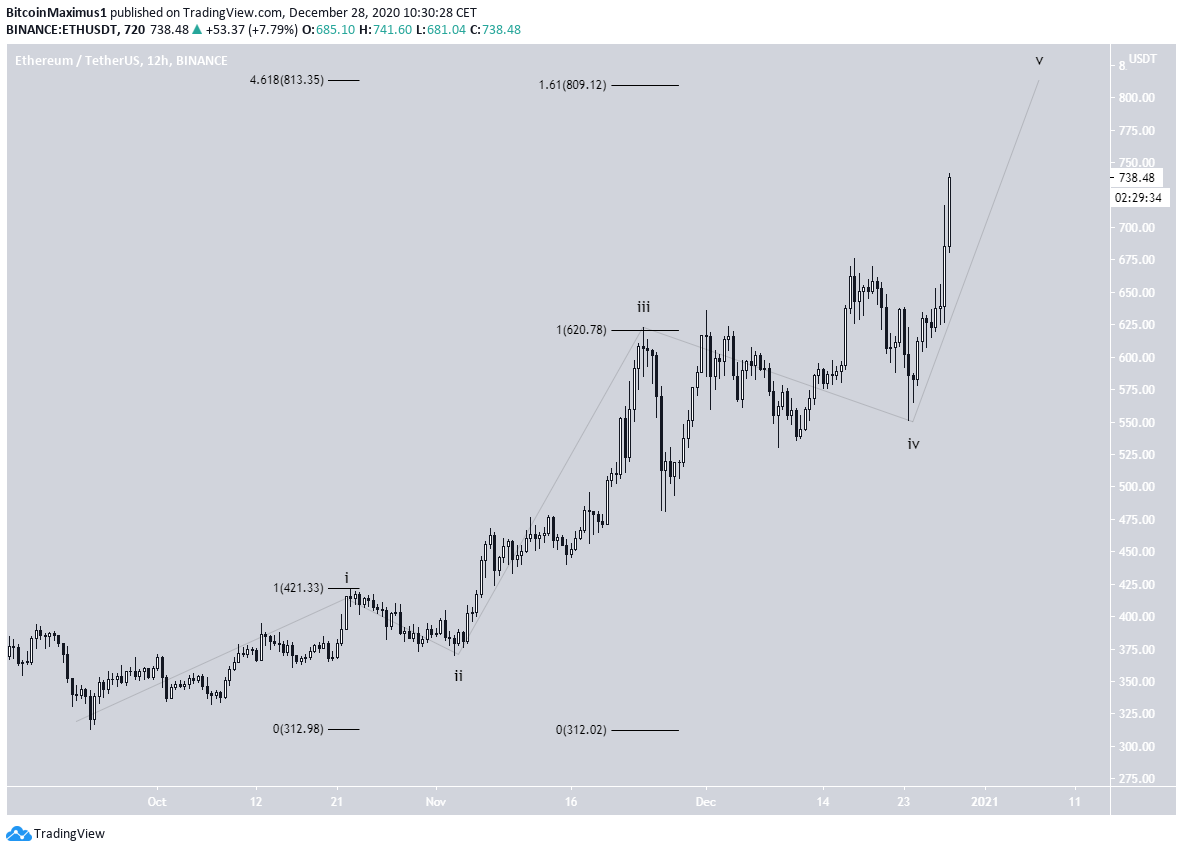
Wave Count
The wave count suggests that ETH has begun wave 5 (shown in black below), after completing a running flat in wave 4.
A likely target for the top of the move is found between $809-$813 (4.61 Fib extension of wave 1 and 1.61 Fib extension of wave 1-3).
Since this target also fits with the long-term resistance area, it’s likely to act as the top.
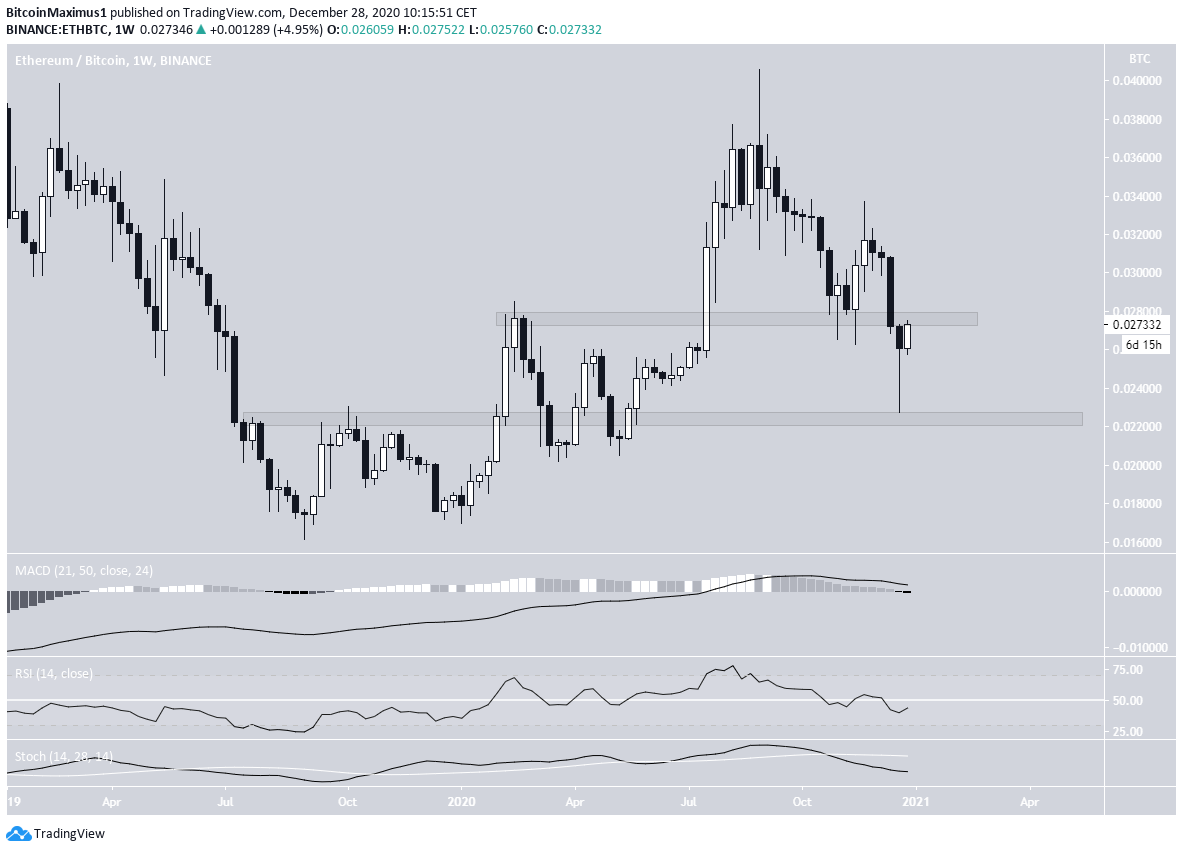
ETH/BTC
The weekly chart shows that ETH/BTC is trading just below the ₿0.0275 resistance area after creating a long upper wick on a bounce from the ₿0.0225 support.
However, technical indicators are bearish, suggesting that the current movement could just be a resistance/support flip, after which ETH will decrease.
This scenario would be further solidified if ETH were to get rejected from the ₿0.0275 resistance area.
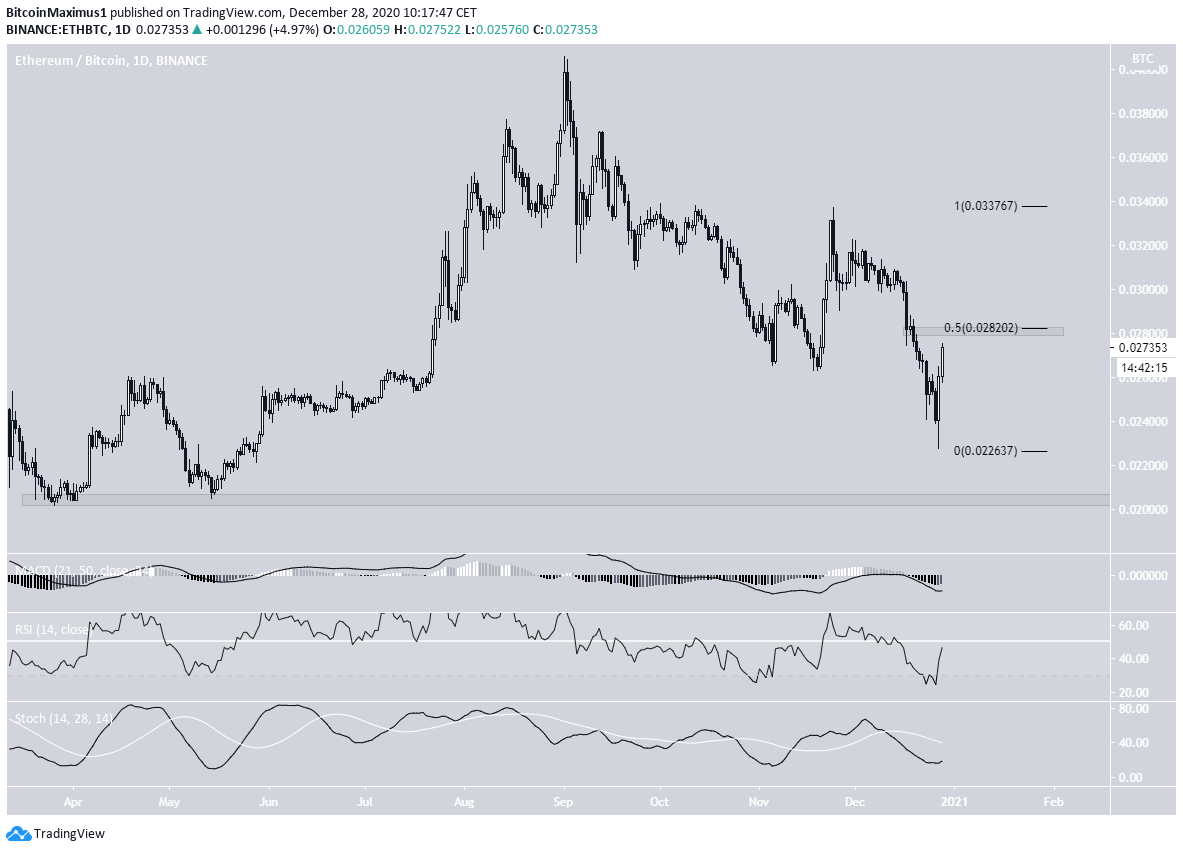
Similarly, the daily chart shows the ongoing ETH attempt at moving higher, which is somewhat supported by technical indicators. The current resistance area is also shown to be the 0.5 Fib retracement level of the prior downward move.
Therefore, whether or not ETH is successful in reclaiming the current resistance area will be crucial in determining the direction of the future trend.
Conclusion
Ethereum is expected to continue increasing towards the targets at $835 and possibly $1015.
Whether or not ETH/BTC is able to reclaim the next resistance area will be crucial in determining the direction of the future trend.
For BeInCrypto’s latest Bitcoin (BTC) analysis, click here!
Disclaimer: Cryptocurrency trading carries a high level of risk and may not be suitable for all investors. The views expressed in this article do not reflect those of BeInCrypto.


