

On July 2, 2019, the Ethereum price reached a low of $272. A gradual increase ensued until July 9, when the price reached a high of $318. However, a decrease began the next day.

Ethereum Price: Trends and Highlights for July 11
- ETH/USD broke down from an ascending channel.
- It also broke down from a longer-term ascending wedge.
- There is support near $260 and $230.
- Short-term moving averages are bearish.
- Long-term moving averages are bullish.
Previous ETH Price Movement
Since reaching the aforementioned low on July 2, the Ethereum price has been trading inside the ascending channel outlined below. On July 10, the ETH price broke down from this channel.
As is visible above, the breakdown transpired with very significant volume, affirming its validity.
On July 10, the ETH price broke down from this channel.
As is visible above, the breakdown transpired with very significant volume, affirming its validity.
ETH Price in an Ascending Wedge
A look at a longer time-frame shows that the Ethereum price has been trading inside a descending wedge since February 23.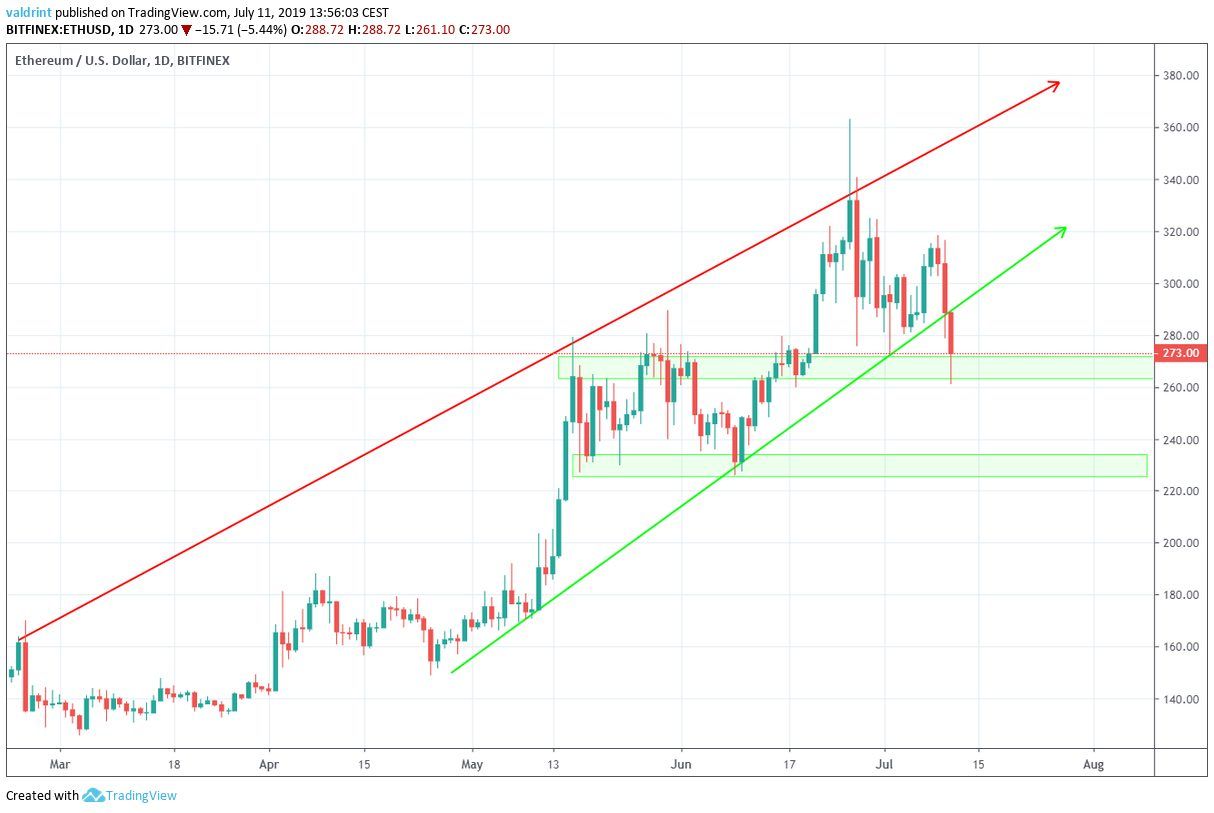 The recent breakdown from the channel also caused a breakdown from the ascending wedge.
At the time of writing, the ETH price was trading slightly above the support area between $260-$270. Once it got there, the price immediately pushed upward, creating a long lower wick. This is a sign that there is buying pressure around that area.
If the support line fails to hold the price, the next one can be found near $230.
A look at the moving averages (MA) gives mixed signals.
The short-term MAs give a bearish outlook, while the long-term ones are bullish.
The recent breakdown from the channel also caused a breakdown from the ascending wedge.
At the time of writing, the ETH price was trading slightly above the support area between $260-$270. Once it got there, the price immediately pushed upward, creating a long lower wick. This is a sign that there is buying pressure around that area.
If the support line fails to hold the price, the next one can be found near $230.
A look at the moving averages (MA) gives mixed signals.
The short-term MAs give a bearish outlook, while the long-term ones are bullish.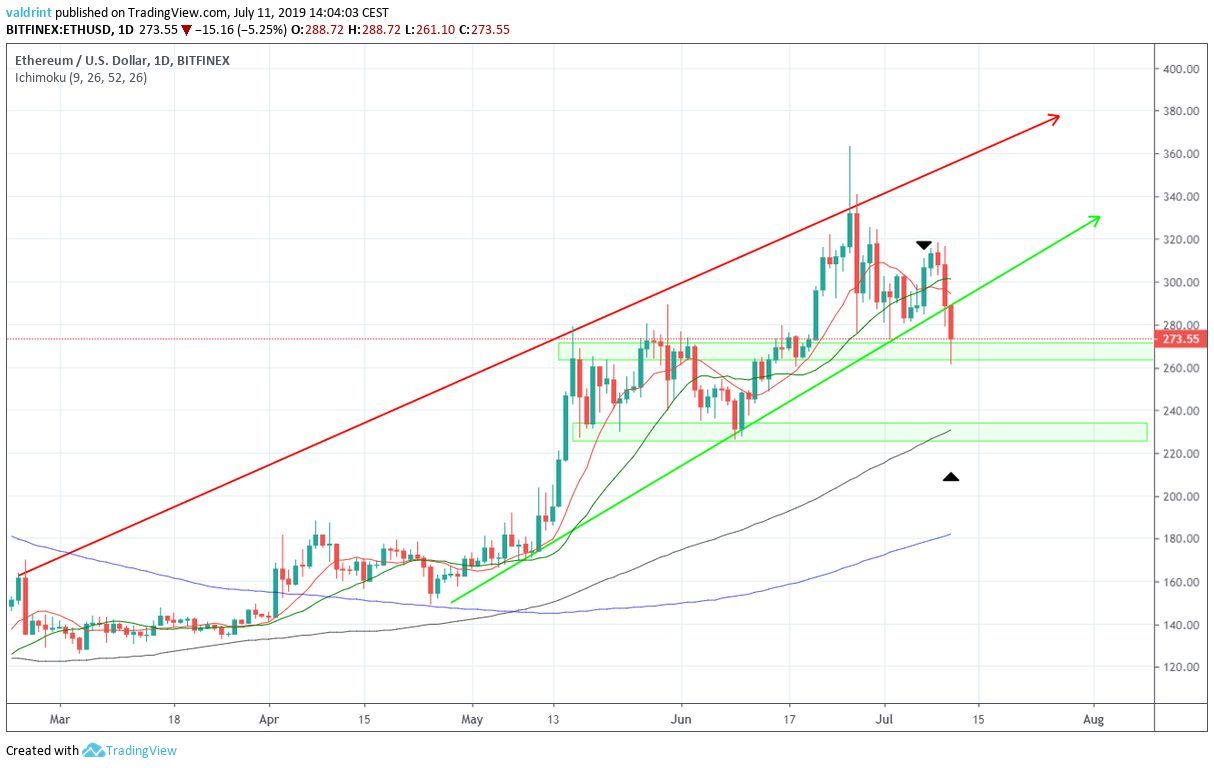 On July 6, a bearish cross transpired between the 10- and 20-day MAs. The recent decrease caused the ETH price to fall below both of them.
As of now, the price is facing close resistance from the former.
However, a long-term bullish cross between the 100- and 200-period MAs transpired on May 9.
Furthermore, the 100-day MA is currently inside the support area at $230. This further adds to the validity of the area.
So, if the Ethereum price were to continue its decrease, it would be very likely for it to begin a reversal at around $230.
On July 6, a bearish cross transpired between the 10- and 20-day MAs. The recent decrease caused the ETH price to fall below both of them.
As of now, the price is facing close resistance from the former.
However, a long-term bullish cross between the 100- and 200-period MAs transpired on May 9.
Furthermore, the 100-day MA is currently inside the support area at $230. This further adds to the validity of the area.
So, if the Ethereum price were to continue its decrease, it would be very likely for it to begin a reversal at around $230.
Future Movement
For the future movement, there are two possible paths which we can see the price taking.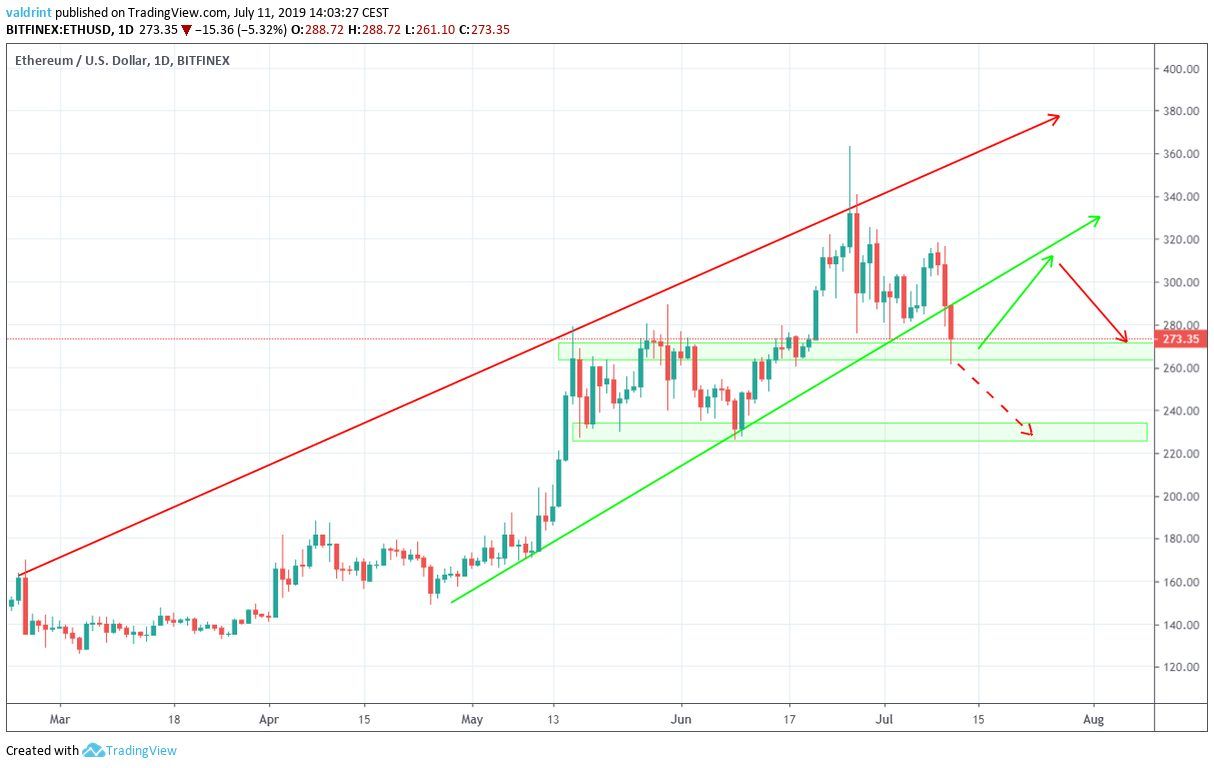 In the first scenario (solid lines), the $265-$275 support area will hold, and the price will begin an upward move.
It should increase until it reaches the support line of the ascending wedge before again dropping to the support area.
The second scenario has the Ethereum price continuing its decrease until it reaches the support area at $230.
As for which is more likely, we believe that it depends on the price of BTC.
Since, during decreases, the price of ETH usually mirrors that of BTC, albeit with larger fluctuations, if the BTC price continues to drop, we would expect ETH to do the same.
You can read our BTC analysis here.
In the first scenario (solid lines), the $265-$275 support area will hold, and the price will begin an upward move.
It should increase until it reaches the support line of the ascending wedge before again dropping to the support area.
The second scenario has the Ethereum price continuing its decrease until it reaches the support area at $230.
As for which is more likely, we believe that it depends on the price of BTC.
Since, during decreases, the price of ETH usually mirrors that of BTC, albeit with larger fluctuations, if the BTC price continues to drop, we would expect ETH to do the same.
You can read our BTC analysis here.
Summary
The Ethereum price recently broke down from both an ascending channel and wedge. The short-term moving averages suggest that the price will continue to decrease. If it does, there is a very significant support area near $230. How long do you think Ethereum will continue its decrease? Let us know in the comments below.Disclaimer: This article is not trading advice and should not be construed as such. Always consult a trained financial professional before investing in cryptocurrencies, as the market is particularly volatile. Images are courtesy of Shutterstock, TradingView.
Disclaimer
In line with the Trust Project guidelines, this price analysis article is for informational purposes only and should not be considered financial or investment advice. BeInCrypto is committed to accurate, unbiased reporting, but market conditions are subject to change without notice. Always conduct your own research and consult with a professional before making any financial decisions. Please note that our Terms and Conditions, Privacy Policy, and Disclaimers have been updated.

Valdrin Tahiri
Valdrin discovered cryptocurrencies while he was getting his MSc in Financial Markets from the Barcelona School of Economics. Shortly after graduating, he began writing for several different cryptocurrency related websites as a freelancer before eventually taking on the role of BeInCrypto's Senior Analyst.
(I do not have a discord and will not contact you first there. Beware of scammers)
READ FULL BIO
Sponsored
Sponsored