


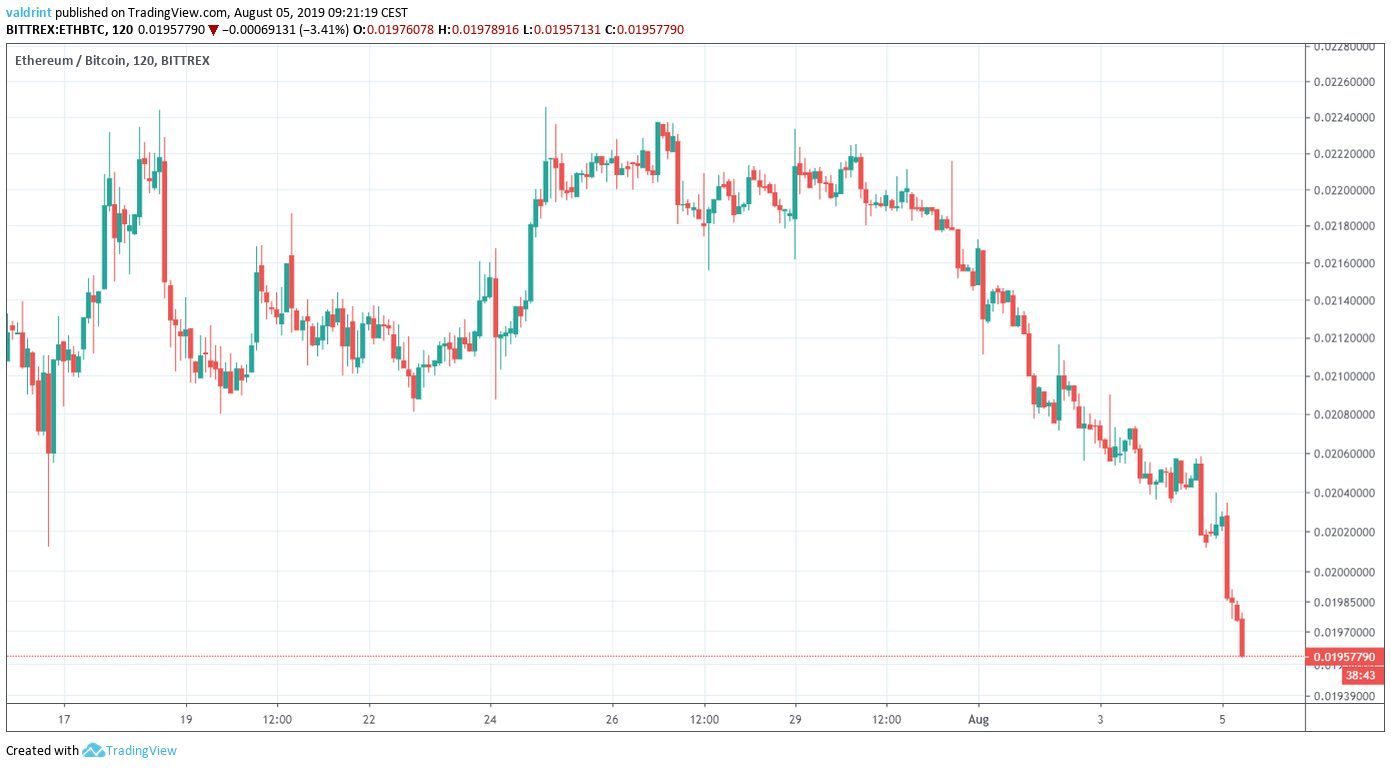
On July 15, 2019, the Ethereum price reached a low of ₿0.0205. An upward move ensued. ETH traded inside a range between ₿0.0205 and ₿0.022 until August 2. A decrease ensued that is still ongoing.
How long will ETH continue to decrease? In order to answer this question, we will analyze Ethereum in different time-frames alongside technical indicators.
For our previous analysis, click here.

Ethereum Price: Trends and Highlights for August 5
- ETH/BTC broke down from a descending channel.
- There is support at ₿0.0170.
- The RSI is at a critical level.
- ETH is not showing any signs of reversal.
Long-Term Support
A look at the weekly time-frame shows that ETH is trading above a very significant long-term support area.
The logarithmic chart is used to better visualize large price fluctuations.
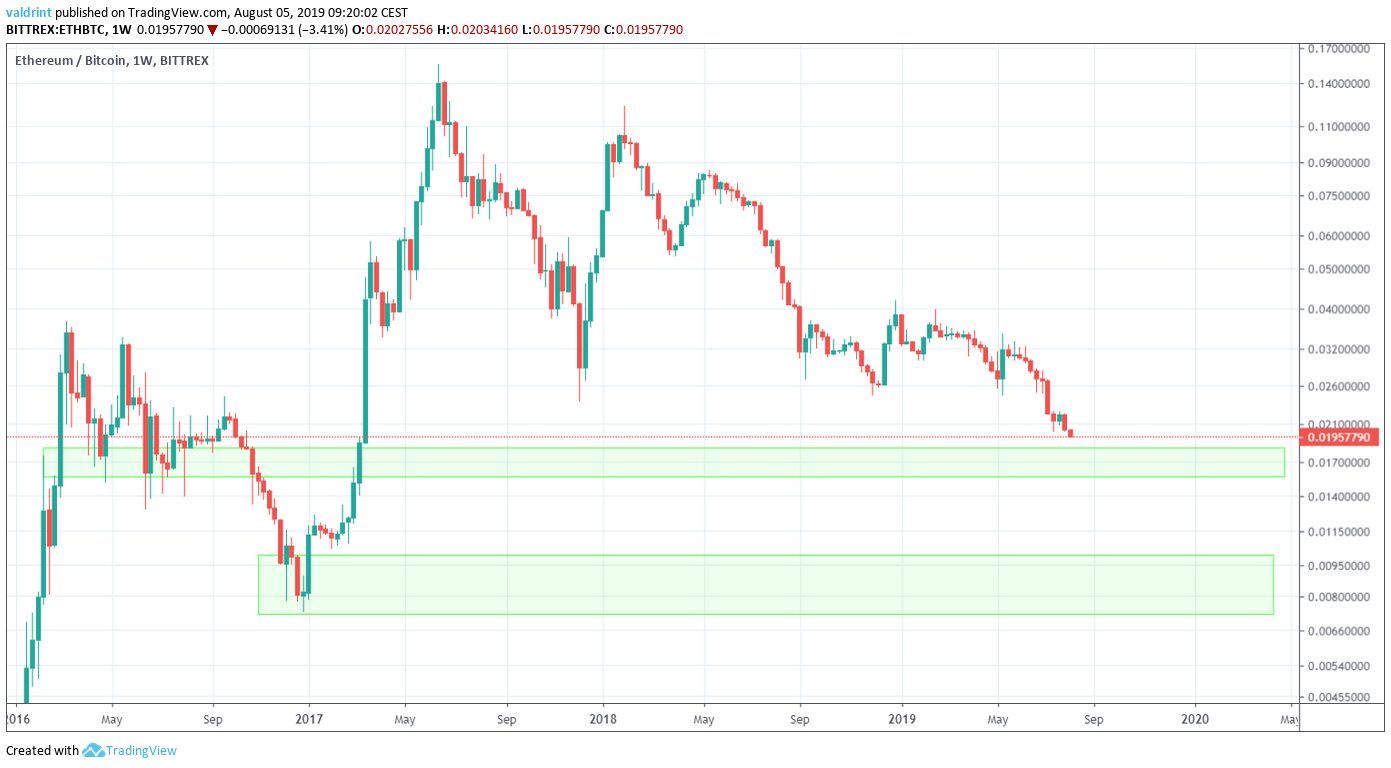
The support area was found at ₿0.0170.
The Ethereum price has not traded at this level since March of 2017.
Additionally, there is another support area at ₿0.0085.
Taking a closer look at the weekly candlesticks, we can see that ETH has generated several bearish candles in a row:
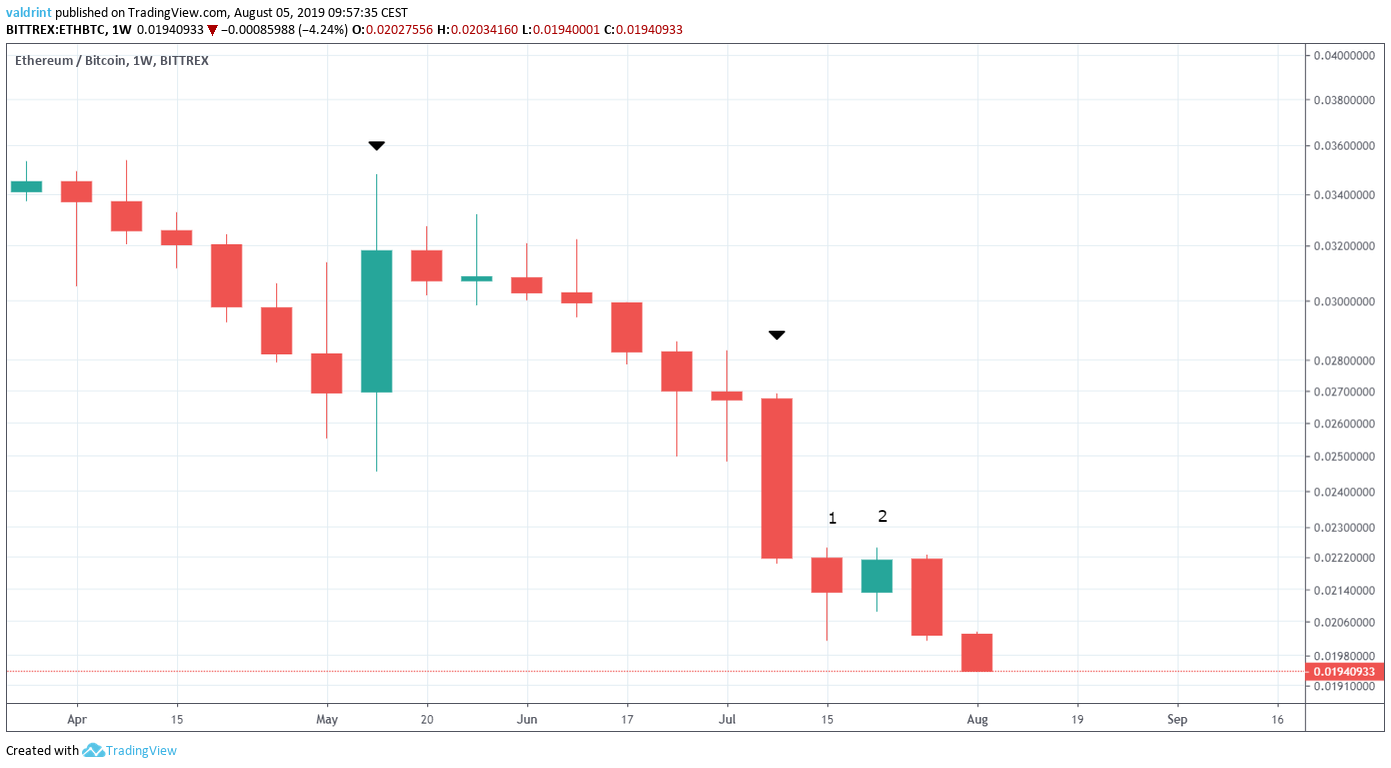
The last bullish candle was that from the week of May 13-20.
A gradual decrease followed. It intensified in the beginning of June.
Afterward, the ETH price showed some possible signs of reversal.
It did so by generating a hammer, albeit a bearish one, and following it with a bullish doji.
However, last week’s bearish engulfing candlestick effectively rendered them obsolete.
Breakdown
A look at the daily time-frame shows that ETH has been trading inside a descending channel since the beginning of 2019.
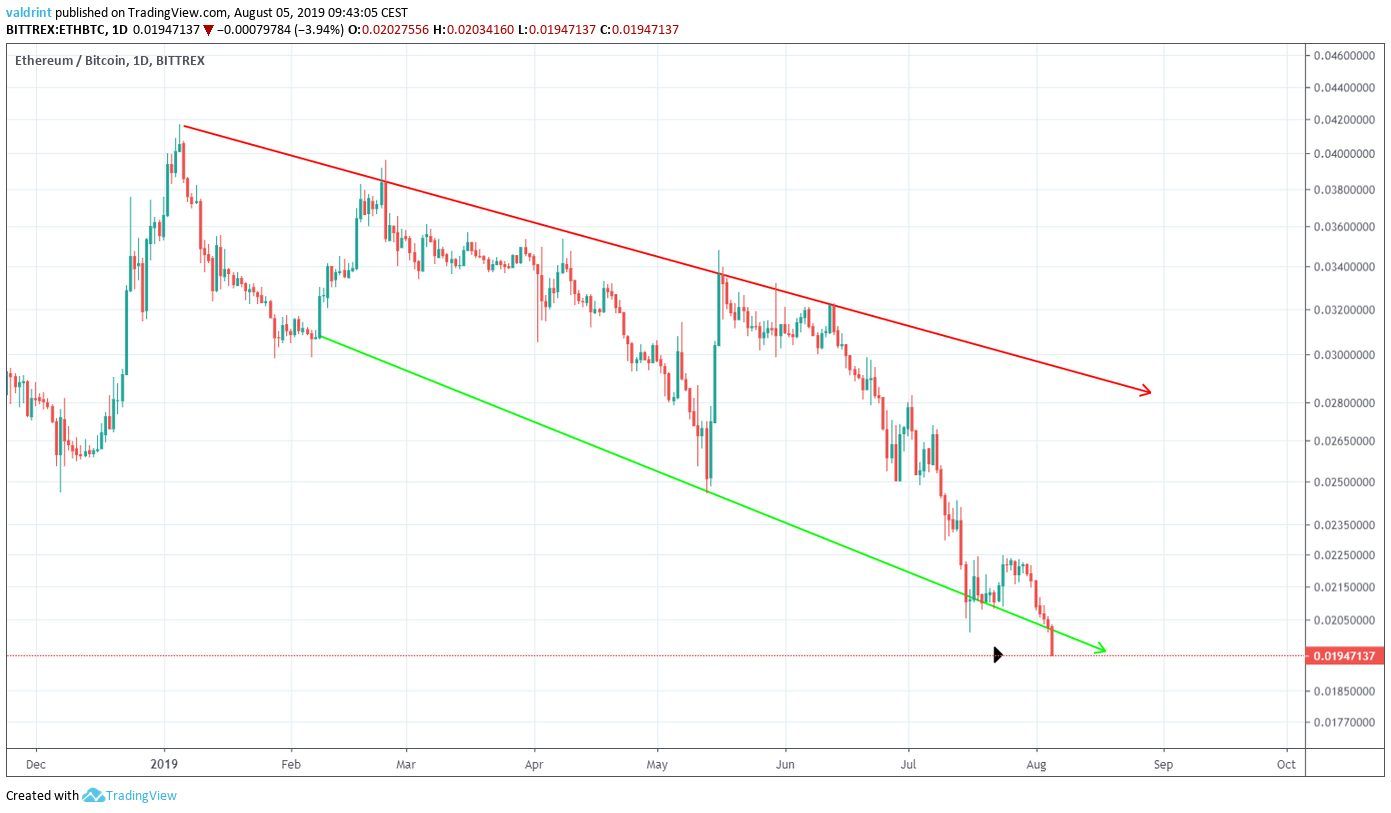
On August 3 the ETH price broke down from this channel.
It is not currently following any patterns.
In order to try and predict a likely area of reversal, we have used a fibonacci retracement tool on the upward move beginning on December 2018.
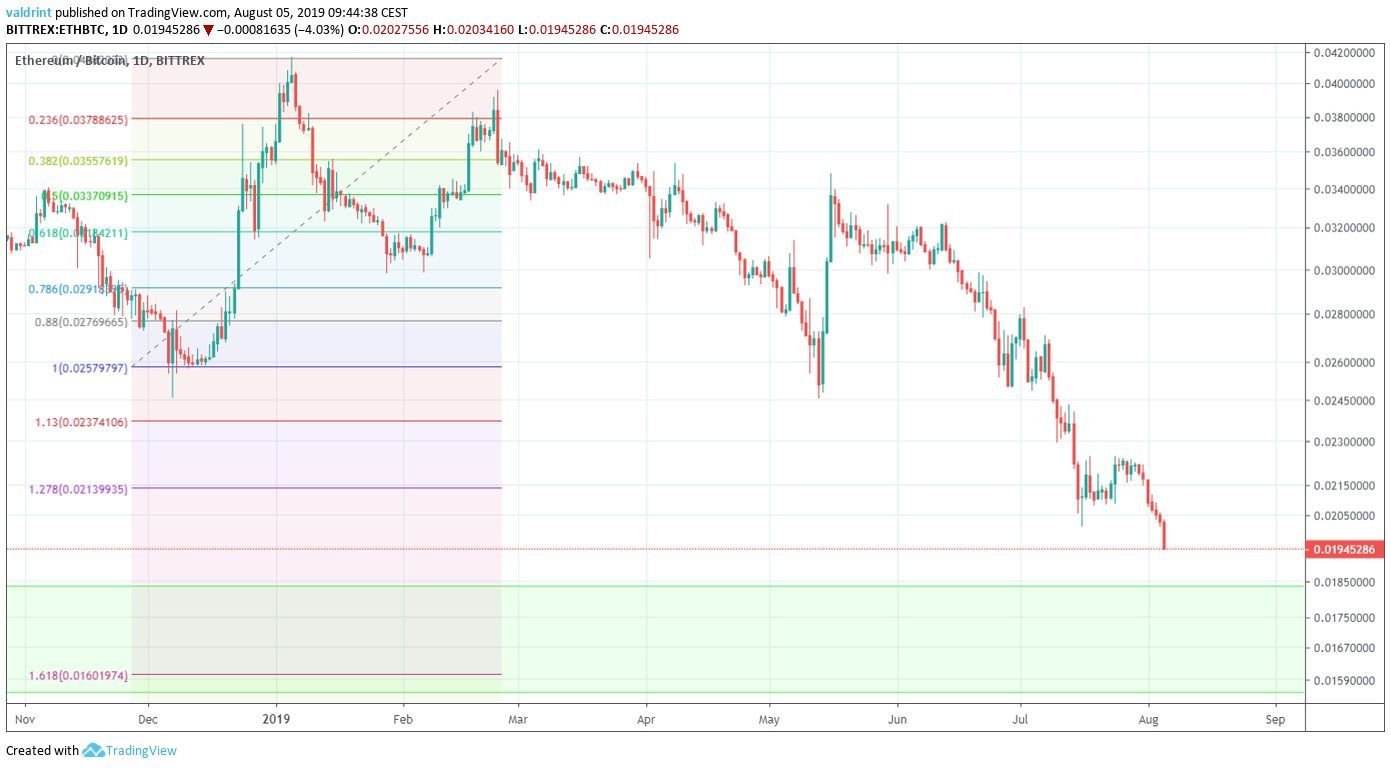
The closest fib level (1.618) that offers support is found at ₿0.0160.
This places it near the lower limit of the support line outlined in the first section.
An interesting development presents itself in the daily RSI.
It has not traded below 24 since September of 2018.
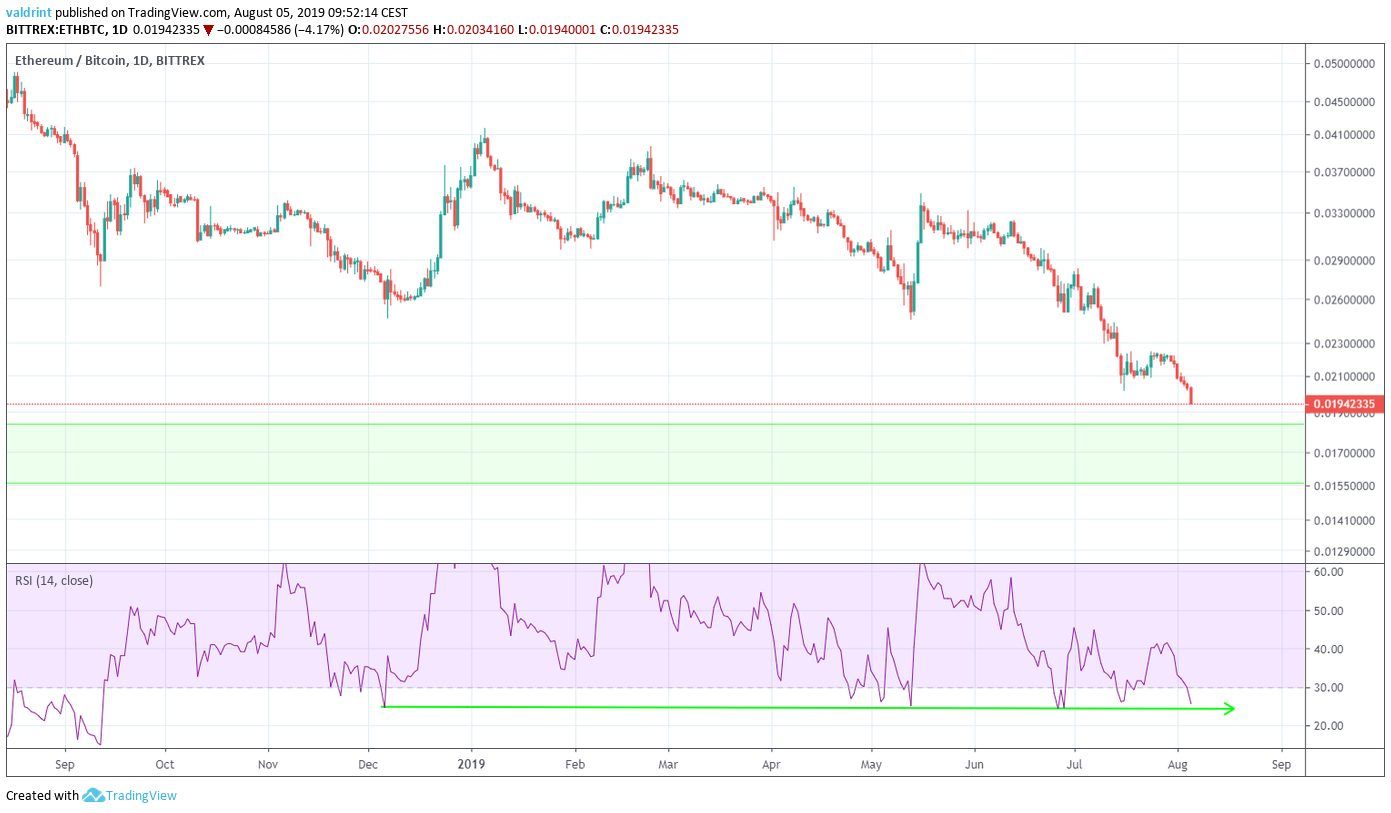
At the time of writing, it was 24.6.
A decrease below this level could cause a rapid decrease in the price of ETH, possibly reaching our target.
Ethereum Price Summary
The Ethereum price recently broke down from a descending channel.
According to our analysis, it is likely to continue decreasing until it reaches at least one of the support areas outlined above.
Do you think Ethereum will reach the support areas? Let us know in the comments below.
Disclaimer: This article is not trading advice and should not be construed as such. Always consult a trained financial professional before investing in cryptocurrencies, as the market is particularly volatile.
Images are courtesy of TradingView, Shutterstock.


