

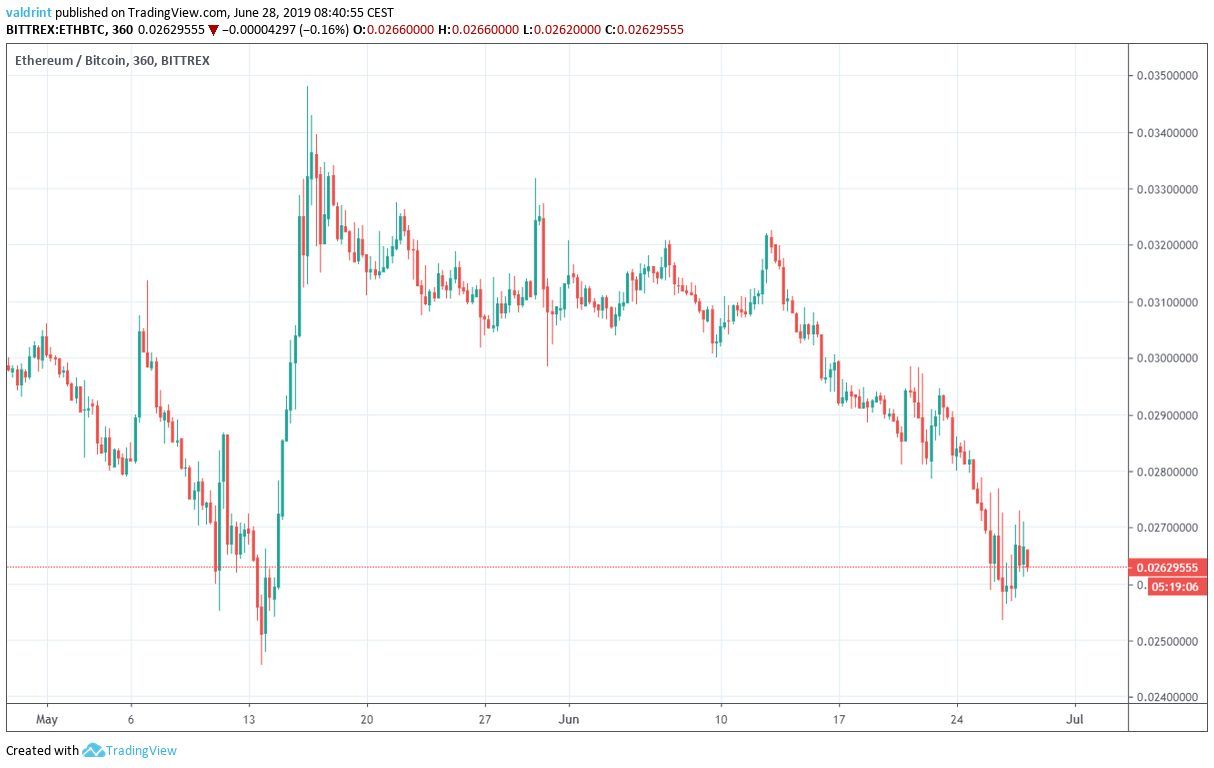
On May 13, 2019, the price of ETH made a low of ₿0.02475. A rapid upward move ensued and a high of ₿0.0348 was reached on May 16. Since then, the Ethereum price has been decreasing — reaching lows similar to those on May 13.
Will prices begin to reverse? Keep reading below and find out:
 Since then, the Ethereum price has been decreasing — reaching lows similar to those on May 13.
Ethereum Price: Trends and Highlights for June 28
- ETH/BTC is trading inside a descending channel.
- The Ethereum price is inside a long-term support area.
- There is bullish divergence developing in the RSI and the MACD.
- The weekly moving averages are offering resistance to the price.
- There is a strong support area near ₿0.025.
ETH Price in a Descending Channel
The price of ETH/BTC is analyzed at daily intervals from November 2018 to June 2019
On Jan 5, 2019, the price of ETH made a high of ₿0.0416.
A gradual decrease began and since then, the ETH price has been trading inside the descending channel outlined below:
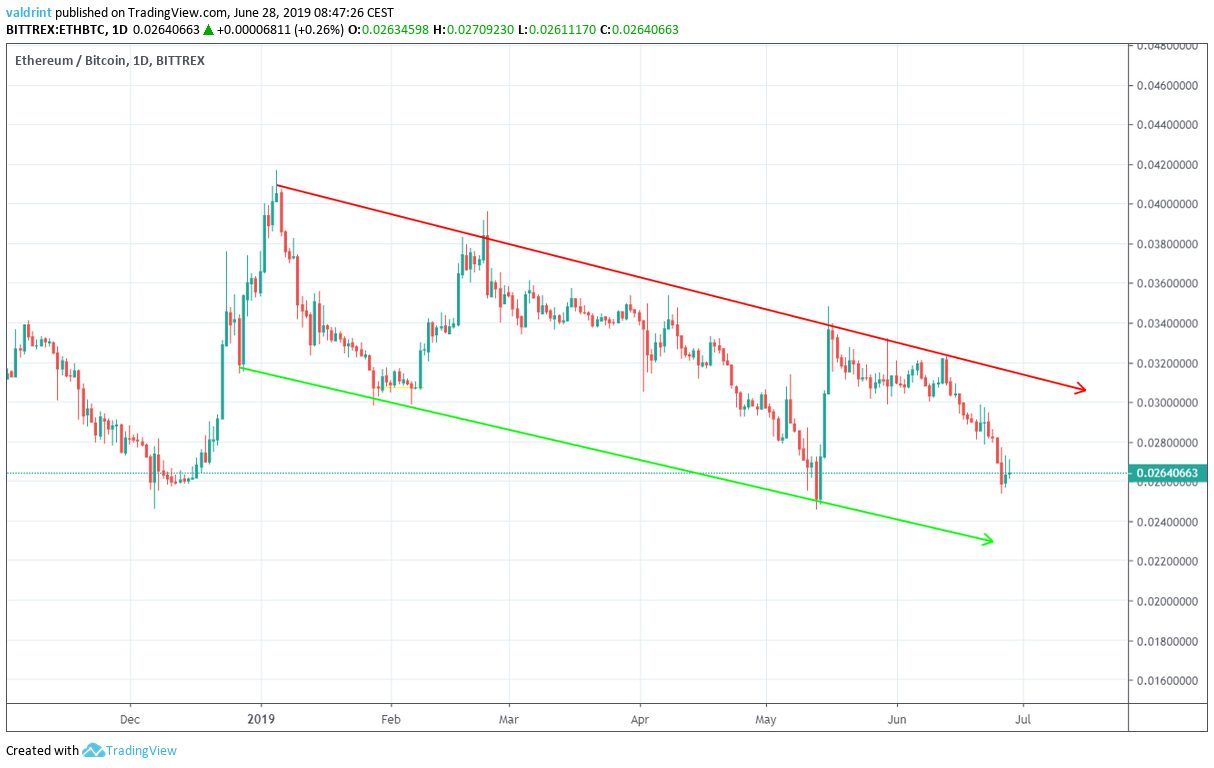 So far, ETH has made three unsuccessful attempts at breaking out from the channel.
Will the next one be successful? Let’s take a look at some technical indicators and find out.
So far, ETH has made three unsuccessful attempts at breaking out from the channel.
Will the next one be successful? Let’s take a look at some technical indicators and find out.
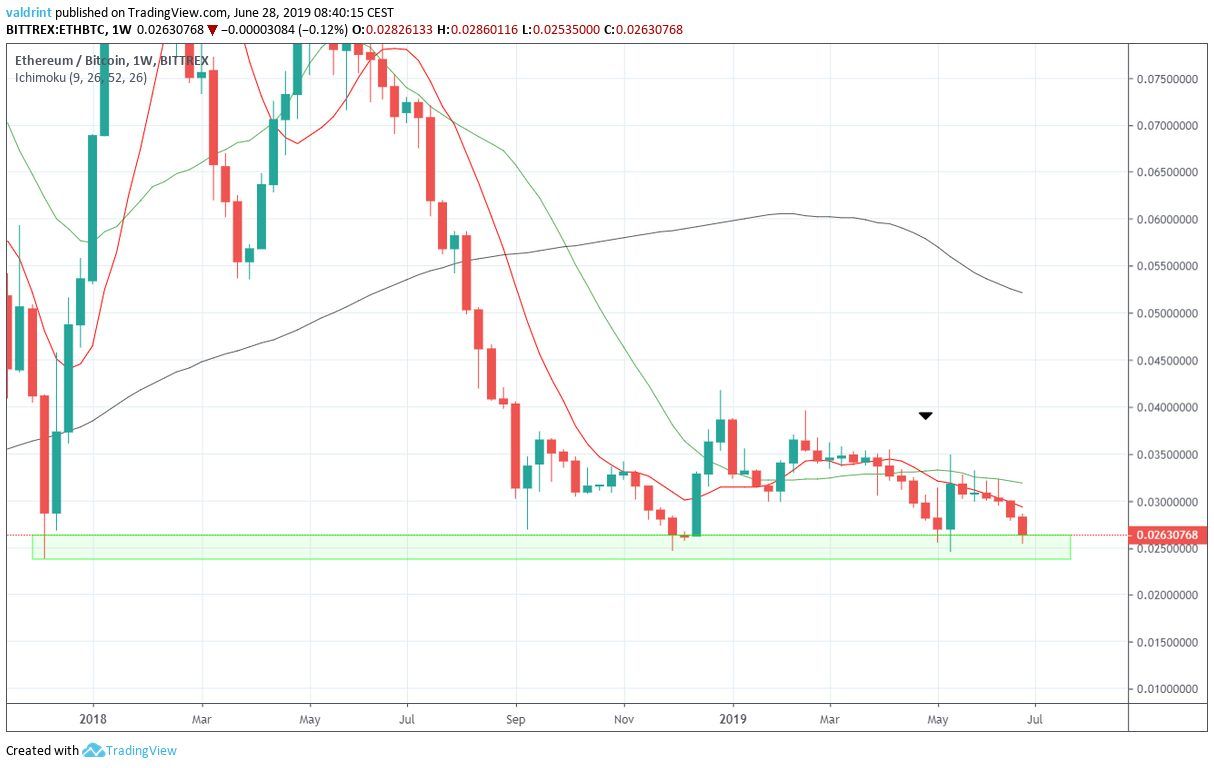
Long Term
The price of ETH is analyzed at weekly intervals from October 2017 to June 2019. The RSI and the MACD are included in the second graph, while the 10-, 20- and 100-period moving averages (MA) are included in the third.
A look at the weekly chart shows that this is the fourth time that the ETH price has reached a value of nearly ₿0.025.
Previously, every time that it did so, the price began a reversal. Therefore, we can say that there is a strong support area near ₿0.025.
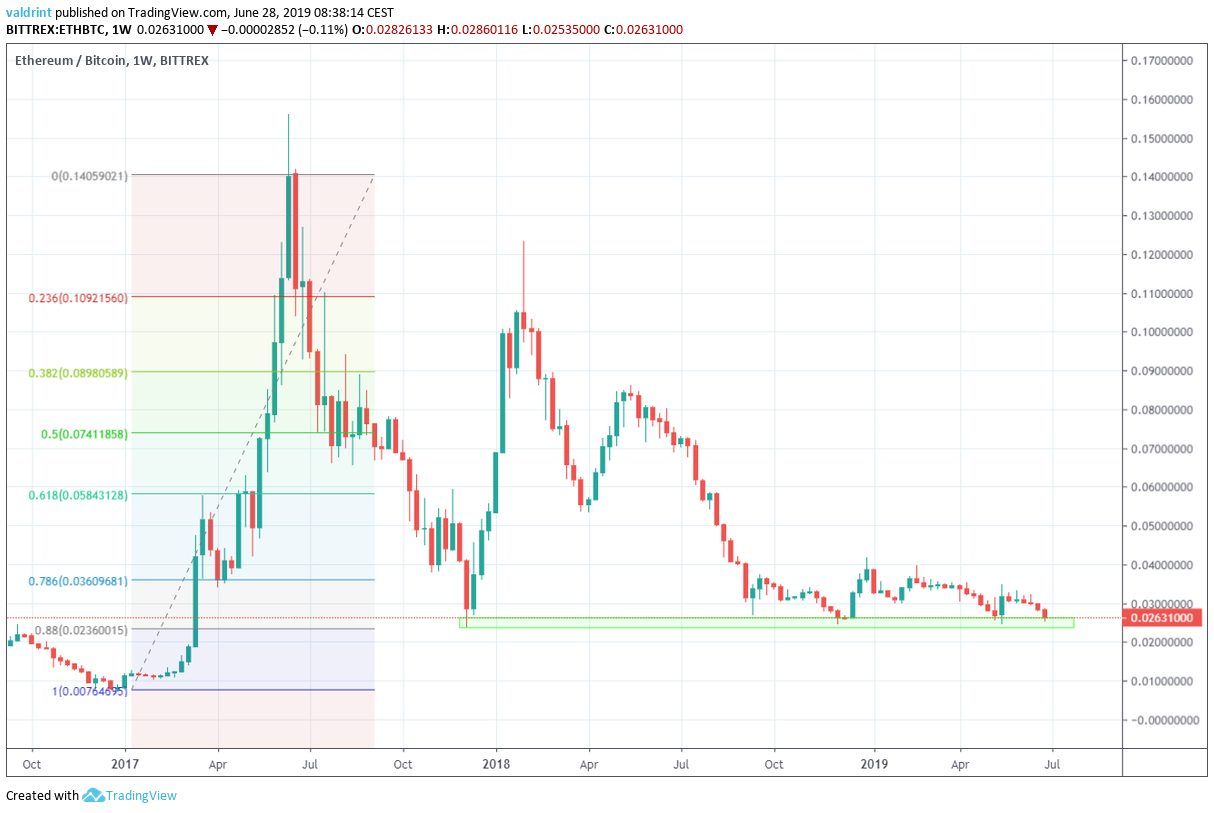 Furthermore, this area coincides with the 0.88 Fibonacci level of the entire upward move which began on January 2017.
Something to keep an eye on is the growing bullish divergence developing in the RSI and the MACD.
Furthermore, this area coincides with the 0.88 Fibonacci level of the entire upward move which began on January 2017.
Something to keep an eye on is the growing bullish divergence developing in the RSI and the MACD.
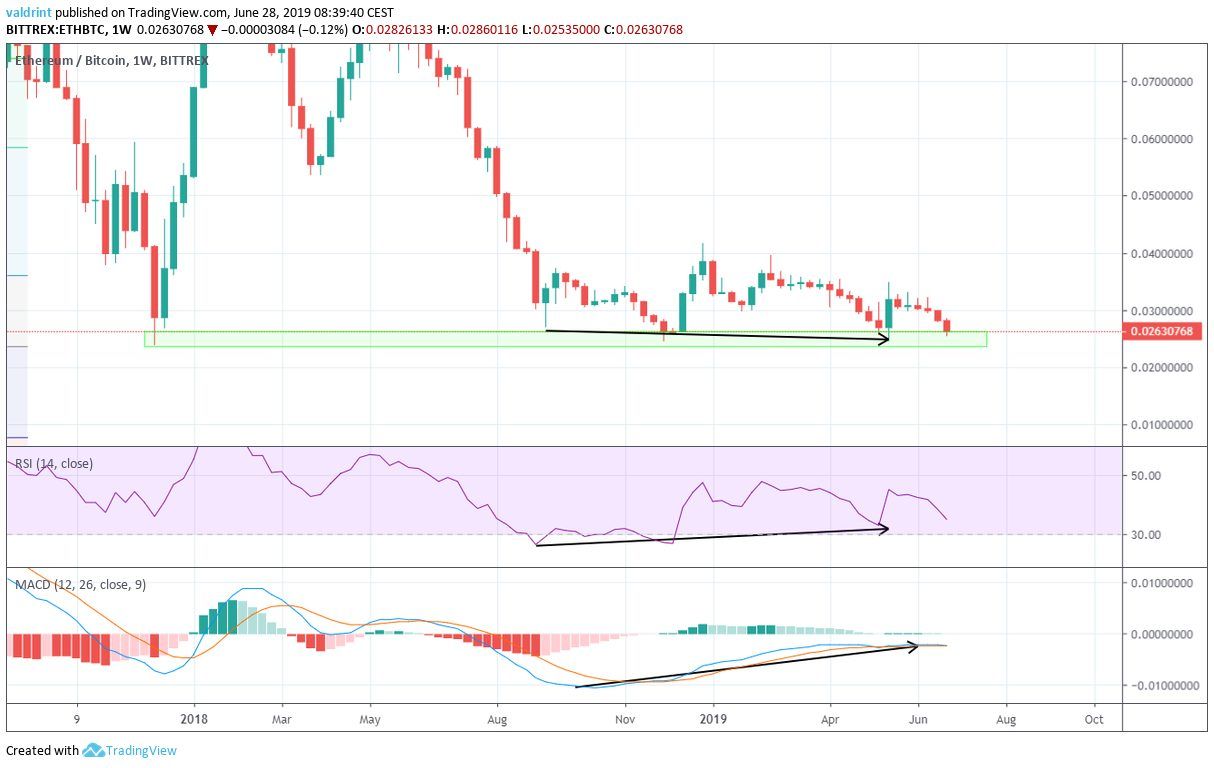 On Aug 2018, the price reached the support area outlined above. It did so again in December of the same year and May 2019. During this time, both the RSI and the MACD have generated higher values. This is known as bullish divergence and often precedes price increases.
The divergence is very significant in value, occurring in long-term time-frames and in both indicators.
Measuring from 2016, this is easily the highest level of divergence recorded in the RSI or the MACD.
The MAs, however, give a more bearish outlook. At the end of April, the 10-period MA crossed below the 20-period one.
On Aug 2018, the price reached the support area outlined above. It did so again in December of the same year and May 2019. During this time, both the RSI and the MACD have generated higher values. This is known as bullish divergence and often precedes price increases.
The divergence is very significant in value, occurring in long-term time-frames and in both indicators.
Measuring from 2016, this is easily the highest level of divergence recorded in the RSI or the MACD.
The MAs, however, give a more bearish outlook. At the end of April, the 10-period MA crossed below the 20-period one.
 This is known as a bearish cross and often precedes price decreases.
The 10-period MA has been offering very close resistance to the price since the cross. Furthermore, candlesticks — which have broken out above it — have found resistance at the 20-period one and have been characterized by long upper wicks.
However, the MAs are a lagging indicator. As a result, a reversal would have to occur first before the MAs turn bullish. The RSI and MACD indicate that this is likely to occur.
The 100-period MA is currently far above the price, near ₿0.05.
If the price begins an upward move, it will likely eventually find resistance near the MA.
This is known as a bearish cross and often precedes price decreases.
The 10-period MA has been offering very close resistance to the price since the cross. Furthermore, candlesticks — which have broken out above it — have found resistance at the 20-period one and have been characterized by long upper wicks.
However, the MAs are a lagging indicator. As a result, a reversal would have to occur first before the MAs turn bullish. The RSI and MACD indicate that this is likely to occur.
The 100-period MA is currently far above the price, near ₿0.05.
If the price begins an upward move, it will likely eventually find resistance near the MA.
Summary
The price of Ethereum is currently trading inside a very significant support area. There is a considerable amount of bullish divergence developing in the RSI and the MACD in long-term time-frames. However, the ETH price still faces resistance from the moving averages. It is trading inside a descending channel. What do you think of the Ethereum price? Let us know your thoughts in the comments below!Disclaimer: This article is not trading advice and should not be construed as such. Always consult a trained financial professional before investing in cryptocurrencies, as the market is particularly volatile. All images are courtesy of TradingView.
Disclaimer
In line with the Trust Project guidelines, this price analysis article is for informational purposes only and should not be considered financial or investment advice. BeInCrypto is committed to accurate, unbiased reporting, but market conditions are subject to change without notice. Always conduct your own research and consult with a professional before making any financial decisions. Please note that our Terms and Conditions, Privacy Policy, and Disclaimers have been updated.

Valdrin Tahiri
Valdrin discovered cryptocurrencies while he was getting his MSc in Financial Markets from the Barcelona School of Economics. Shortly after graduating, he began writing for several different cryptocurrency related websites as a freelancer before eventually taking on the role of BeInCrypto's Senior Analyst.
(I do not have a discord and will not contact you first there. Beware of scammers)
READ FULL BIO
Sponsored
Sponsored