The Ethereum price is trading inside a vital resistance area. A breakout above could trigger a rapid price rise. However, the price has been showing signs of weakness lately, making a rejection more likely.
Current Resistance
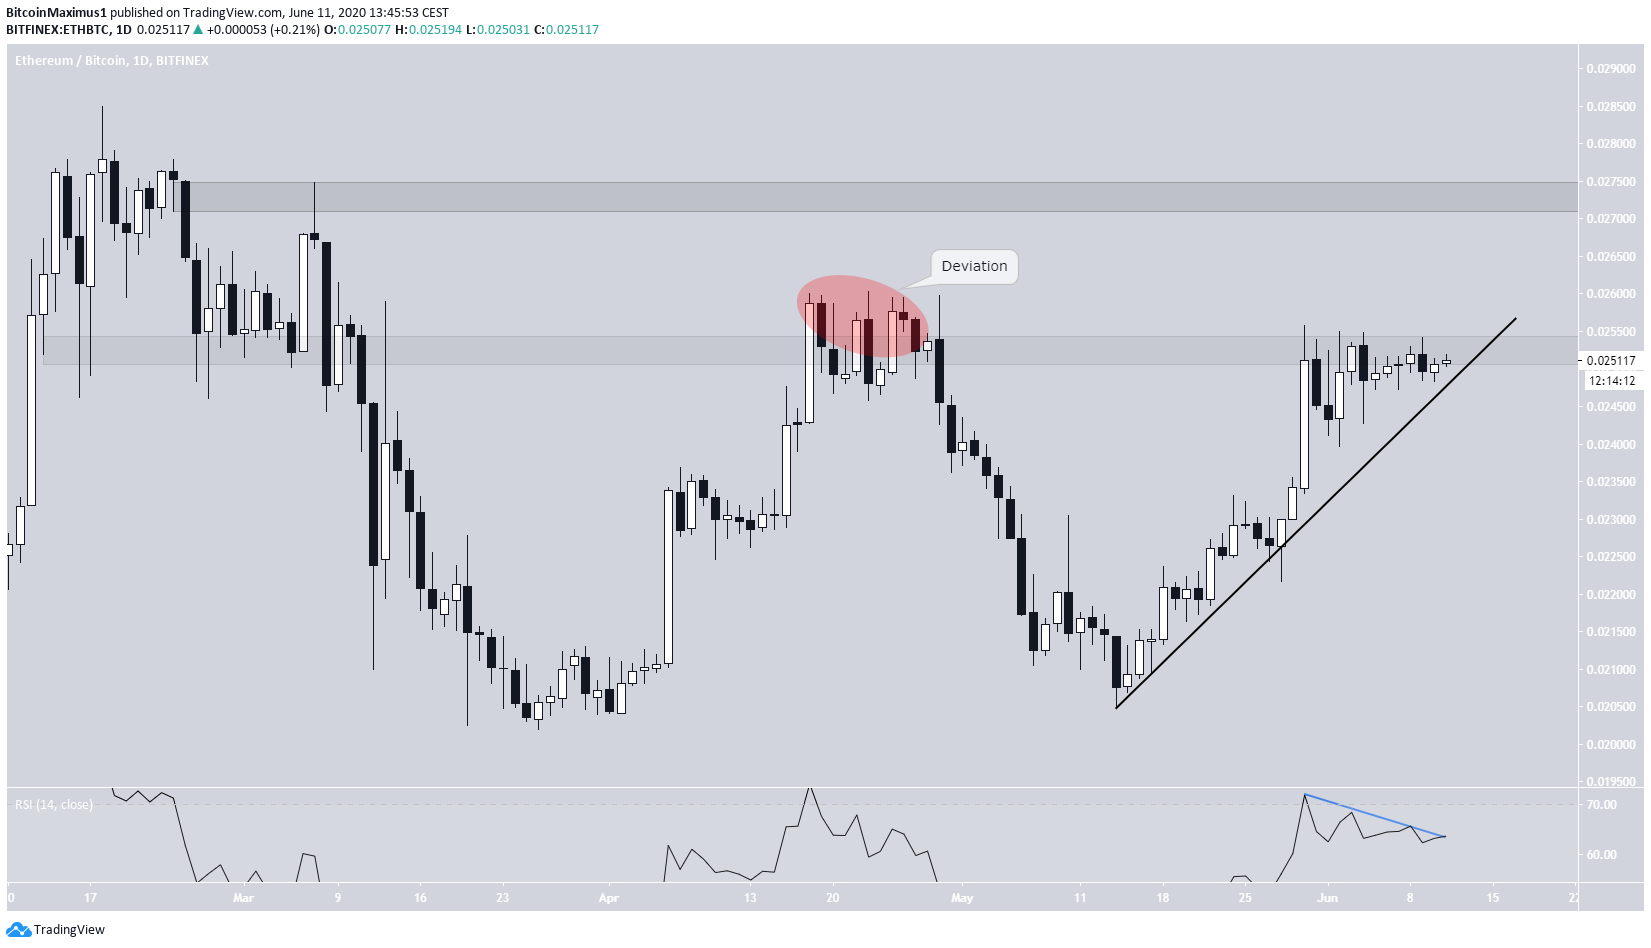
The Ethereum price has been increasing since May 14, following a very steep rising support line. At the time of writing, it was trading inside the ₿0.0252 resistance area. This area acted as support throughout February before the price broke down and continued to decrease rapidly.
While it initially moved above this area at the beginning of March, it subsequently fell below, indicating that the failed breakout was just a deviation above this resistance area. Therefore, the area is now expected to act as resistance once more.
If the price breaks out, the next resistance area can be found at ₿0.0272. However, there is growing bearish divergence on the RSI, indicating that the price is more likely to break down instead.
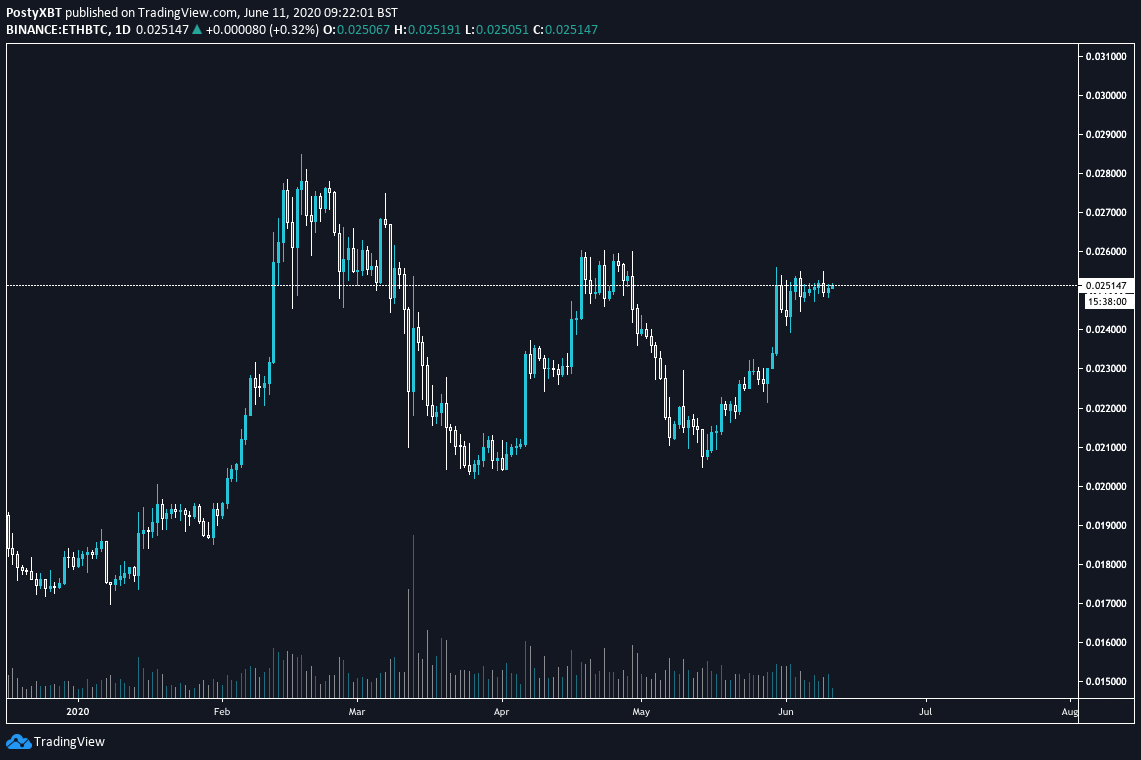
Cryptocurrency trader @PostyXBT also has a bearish outlook. He tweeted simply that:
Sometimes there is no need to draw any lines on a chart
$ETH / BTC is one of those right now
Short-Term Movement
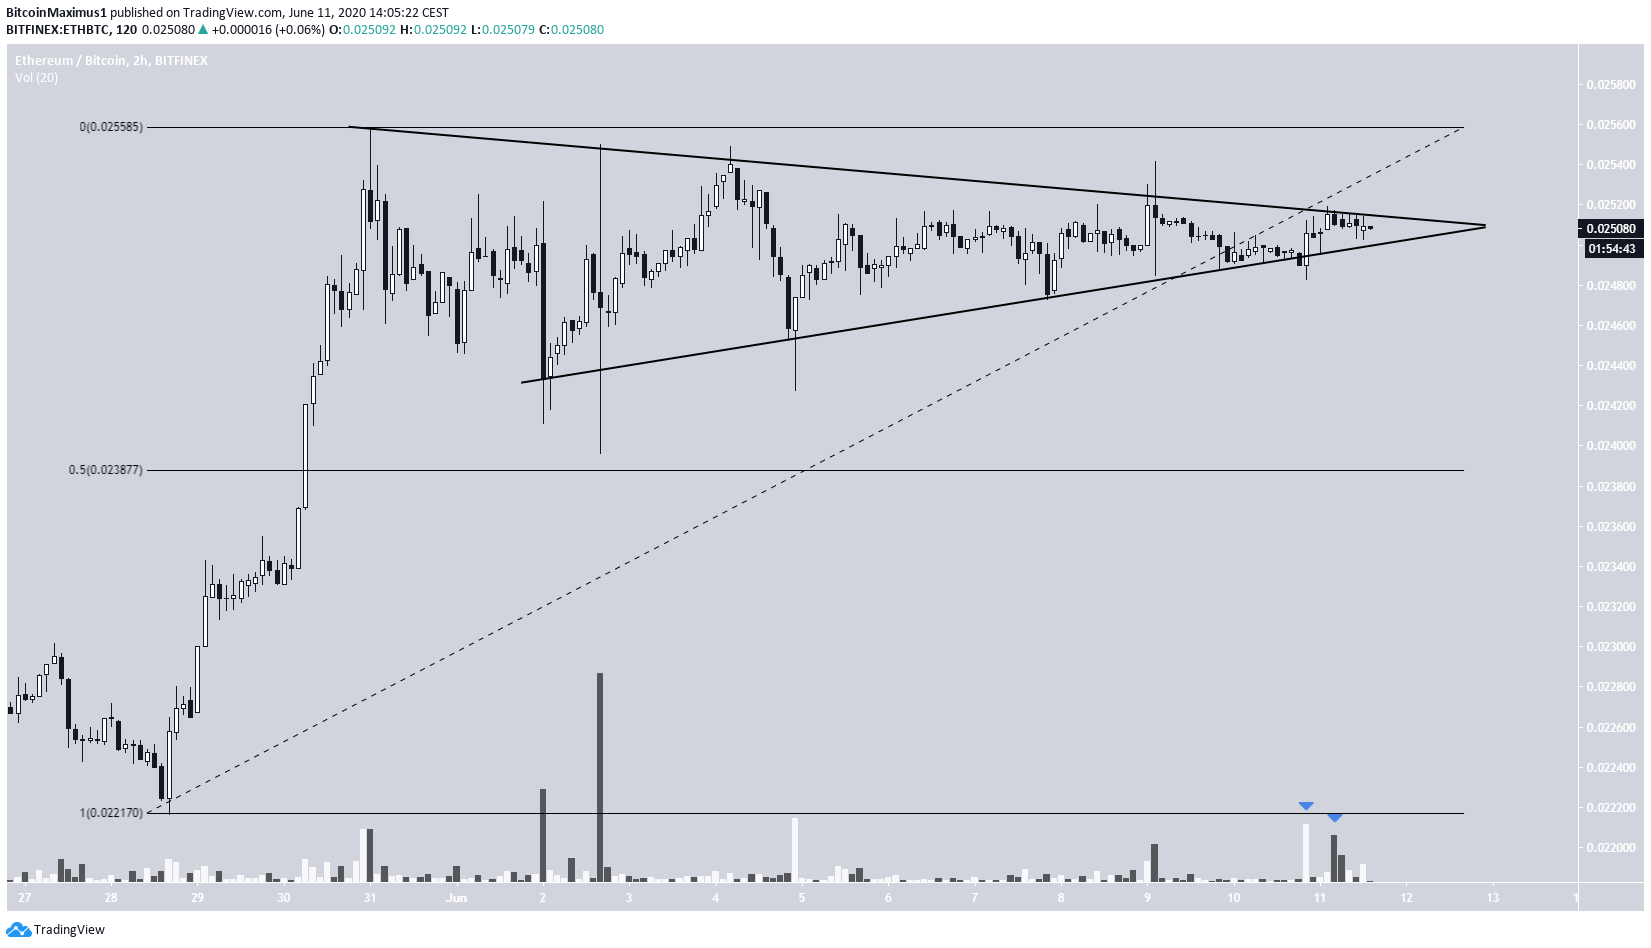
In the short-term, the price is trading inside a symmetrical triangle. While the triangle is considered a neutral pattern, it is taking place after an upward move and is consequently more likely to break out. This is also supported by the slightly higher volume on the bullish candlesticks.
However, the longer-term indicators are leaning bearish, so the readings from different time-frames are not aligned with each other. A breakdown from the triangle would likely take the price to the 0.5 Fib level at ₿0.0239, which was also the wick low of June 2.
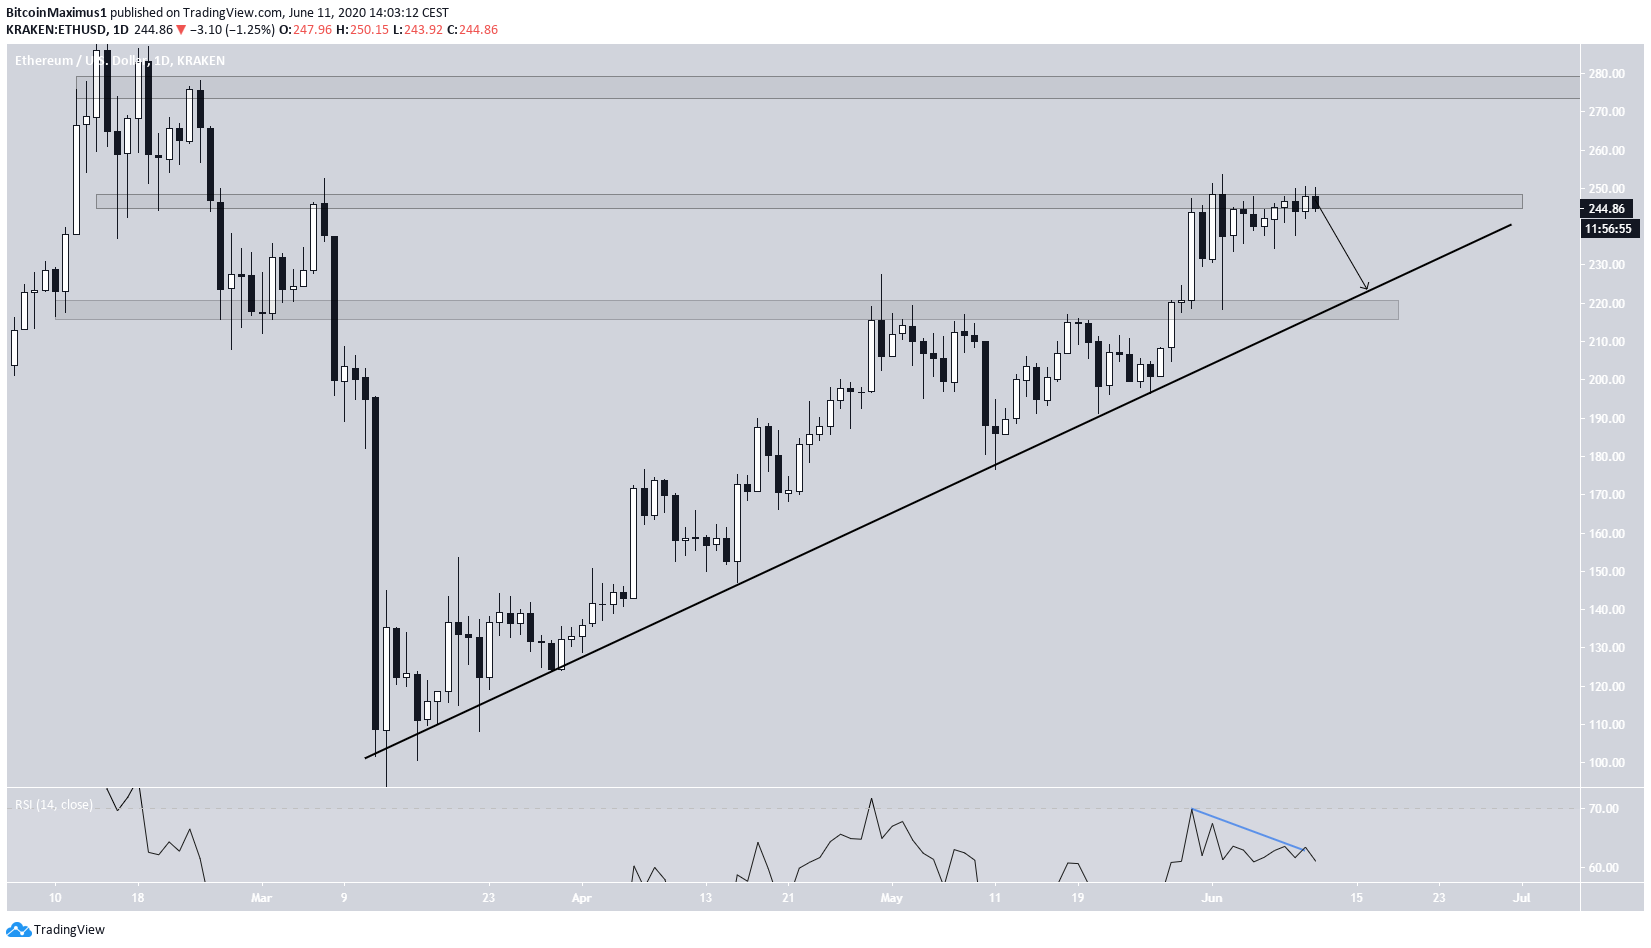
ETH/USD
The Etherum/USD price action is much simpler. The price is trading inside the $245 resistance area, and the daily RSI has formed considerable bearish divergence. This suggests that Ethereum is likely to decline and once again validate the rising support line, currently at $225.