


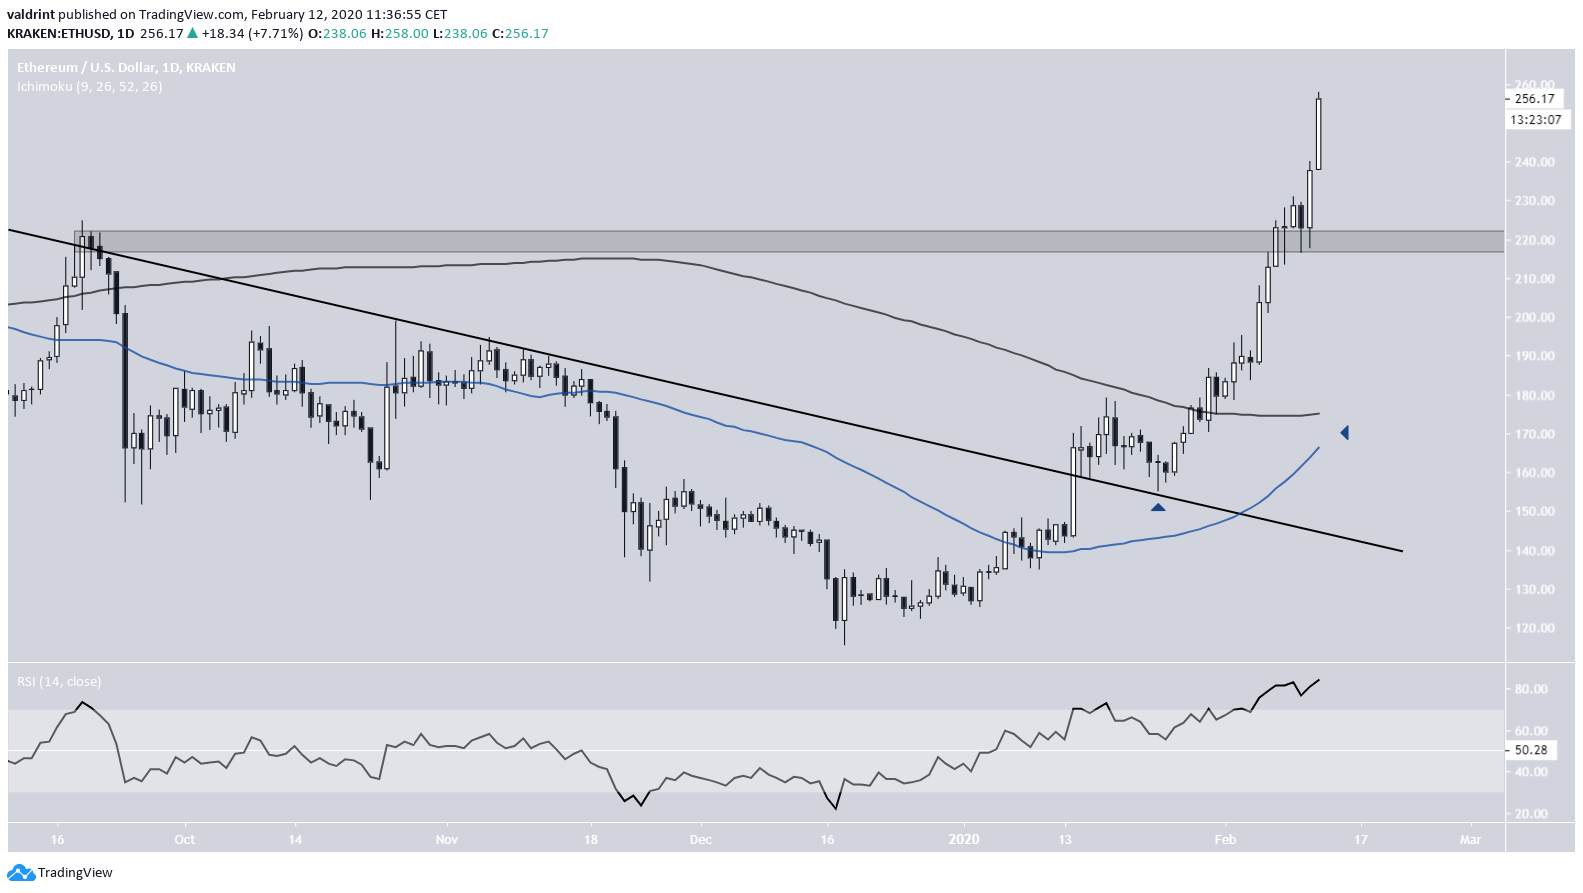
The Ethereum price has been moving upwards since January 24, having increased by 67% in the process.
Ethereum Highlights
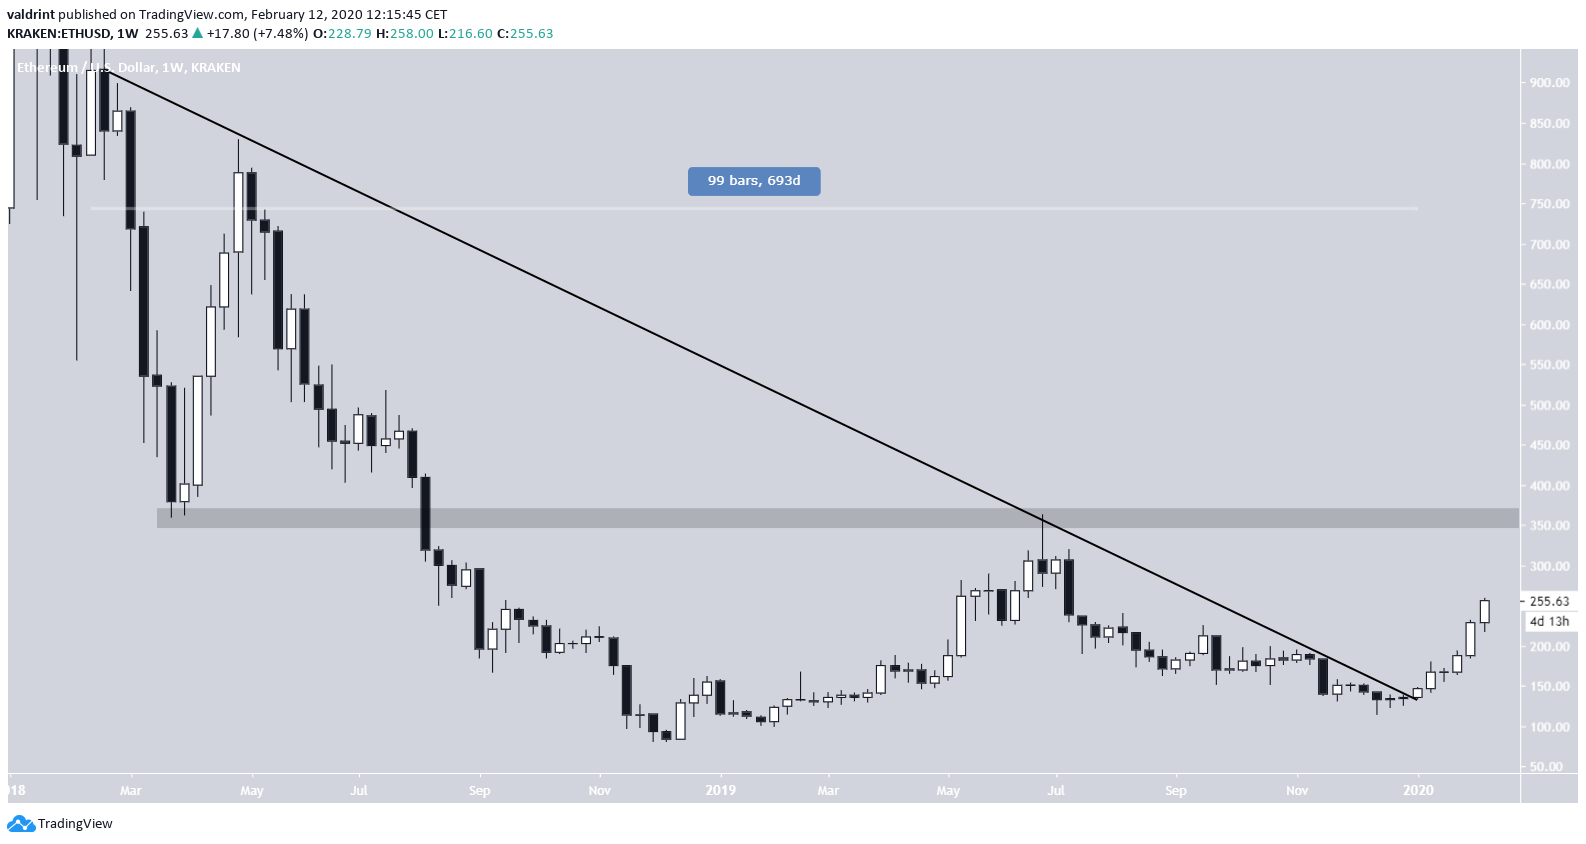
- Ethereum broke out from a two-year descending resistance line.
- There is support at $220.
- There is resistance at $350.
- Technical indicators are bullish.
- Ethereum possibly began the third wave out of a five-wave Elliott formation.
Well-known trader @PostyXBT outlined an Ethereum price chart, stating that the price just missed his re-entry target and continued moving upwards instead. But, he warned not to FOMO at the current price, rather wait for the next opportunity to enter.
Sometimes you don't get what you ask for.
Price was $5 away from coming back to $211. It's important to be reactive and seek out the next opportunity.
No sulking or FOMO'ing round here 🤡 pic.twitter.com/paaqiyJXJV
— Posty (@PostyXBT) February 12, 2020
How long will ETH continue to increase? Keep reading below if you are interested in finding out.
Current Increase
The Ethereum price has been increasing since breaking out and validating the short-term resistance line on January 24. The price broke out above the $220 area without much trouble and validated it as support afterward.
Technical indicators support the continuation of this upward move.
First, the price is trading above both the 50- and 200-day moving averages (MA). The 50-day one has turned sharply upwards and will almost certainly make a bullish cross this week.
The RSI is moving upwards with strength, and while it is in overbought territory, it has not generated any trace of bearish divergence.
The bullish outlook is strengthened once we take a look at the longer-term chart.
The price broke out from a 693-day resistance line at the beginning of January and has been increasing since. The closest resistance area is found at $350.
This level will likely provide strong resistance, since it acted as support in May 2018 and afterward as resistance in June 2019.
Ethereum Future Movement
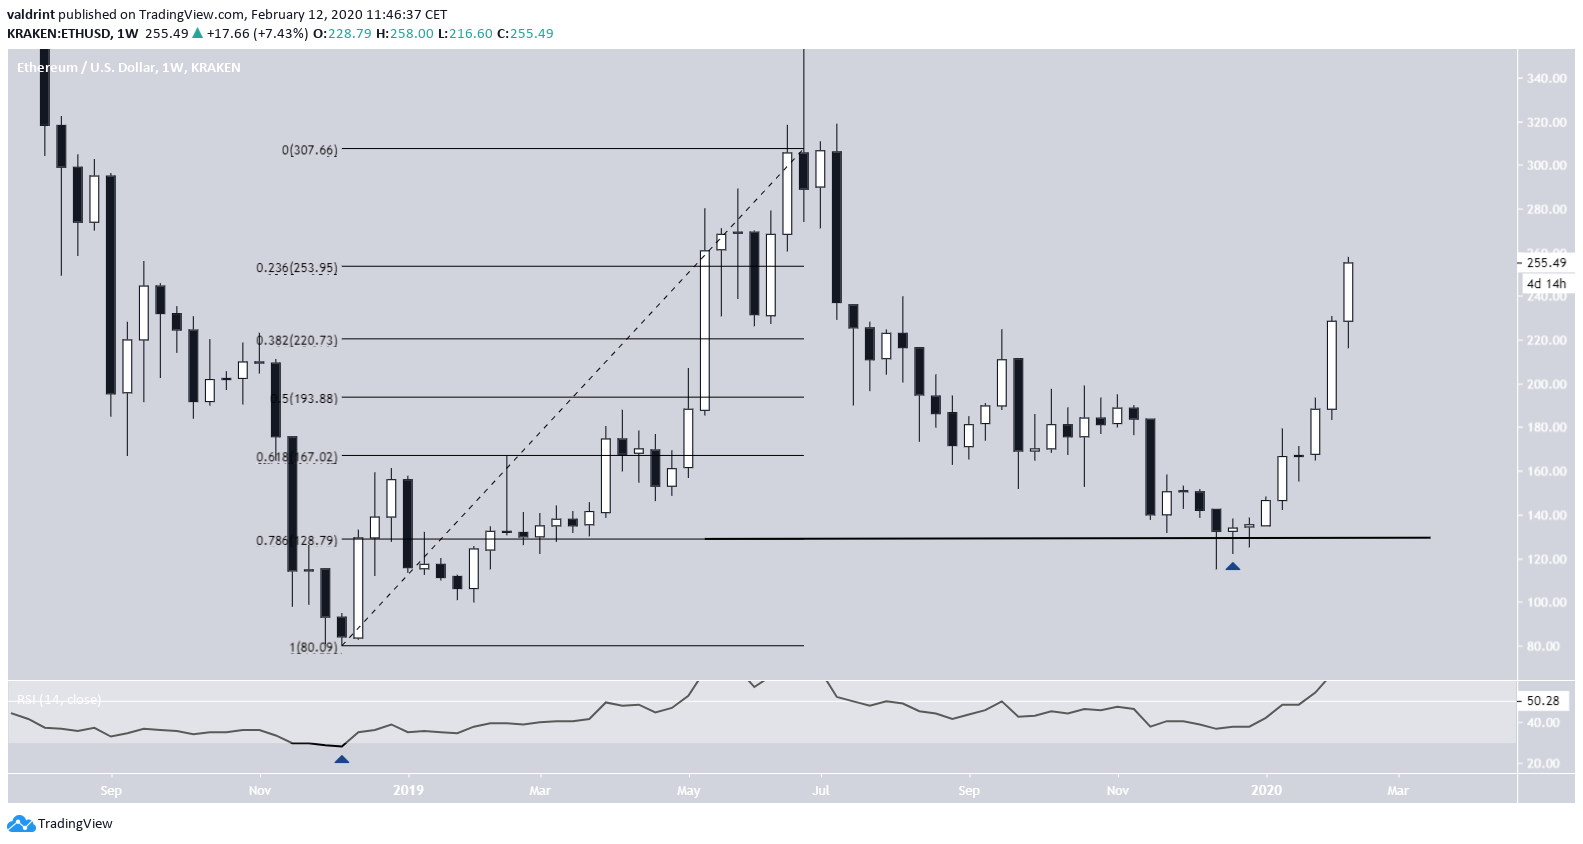
It is very likely that the price reversed its trend in December 2018, when the price reached a low of $80.56. This low was combined with the lowest ever weekly RSI value of 26. The ensuing upward move caused the previously discussed breakout from the long-term descending resistance line.
After reaching a high of $363.2 the corrective move ended at the 0.786 fib level of the entire increase in December 2019.
The movement discussed until now could have likely been the first and second waves of a long-term five-wave Elliott formation. Based on the length of the first two waves, the 3rd wave could end by June 20.
A possible target for the end of this move is given at $517, the 1.618 fib level of the entire second wave. In order to get there, the price has to break out above the ascending resistance line (white) that previously acted as support throughout the entire first wave.
Until it does so, the current movement can still be characterized as a retracement rather than a new upward move.
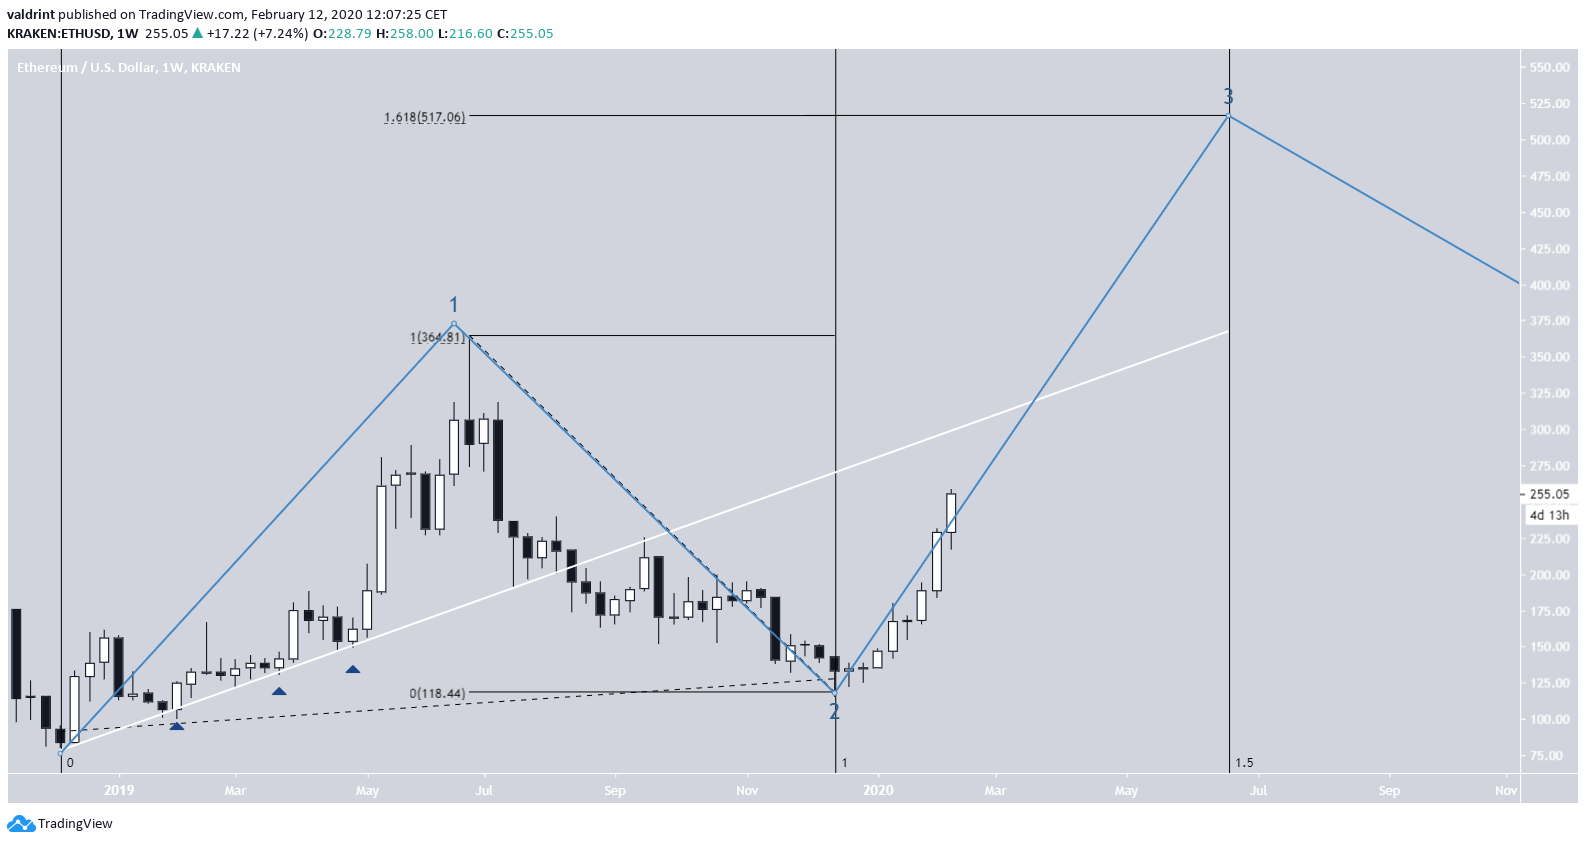
To conclude, the Ethereum price has been increasing rapidly since January 24. The closest target is found at $350 while a slightly longer-term one is at $517.


