


The Ethereum (ETH) price has struggled to retrace significantly since it dropped sharply at the beginning of September.
The price is currently trading inside a significant support area, the loss of which would go a long way in confirming a bearish trend.
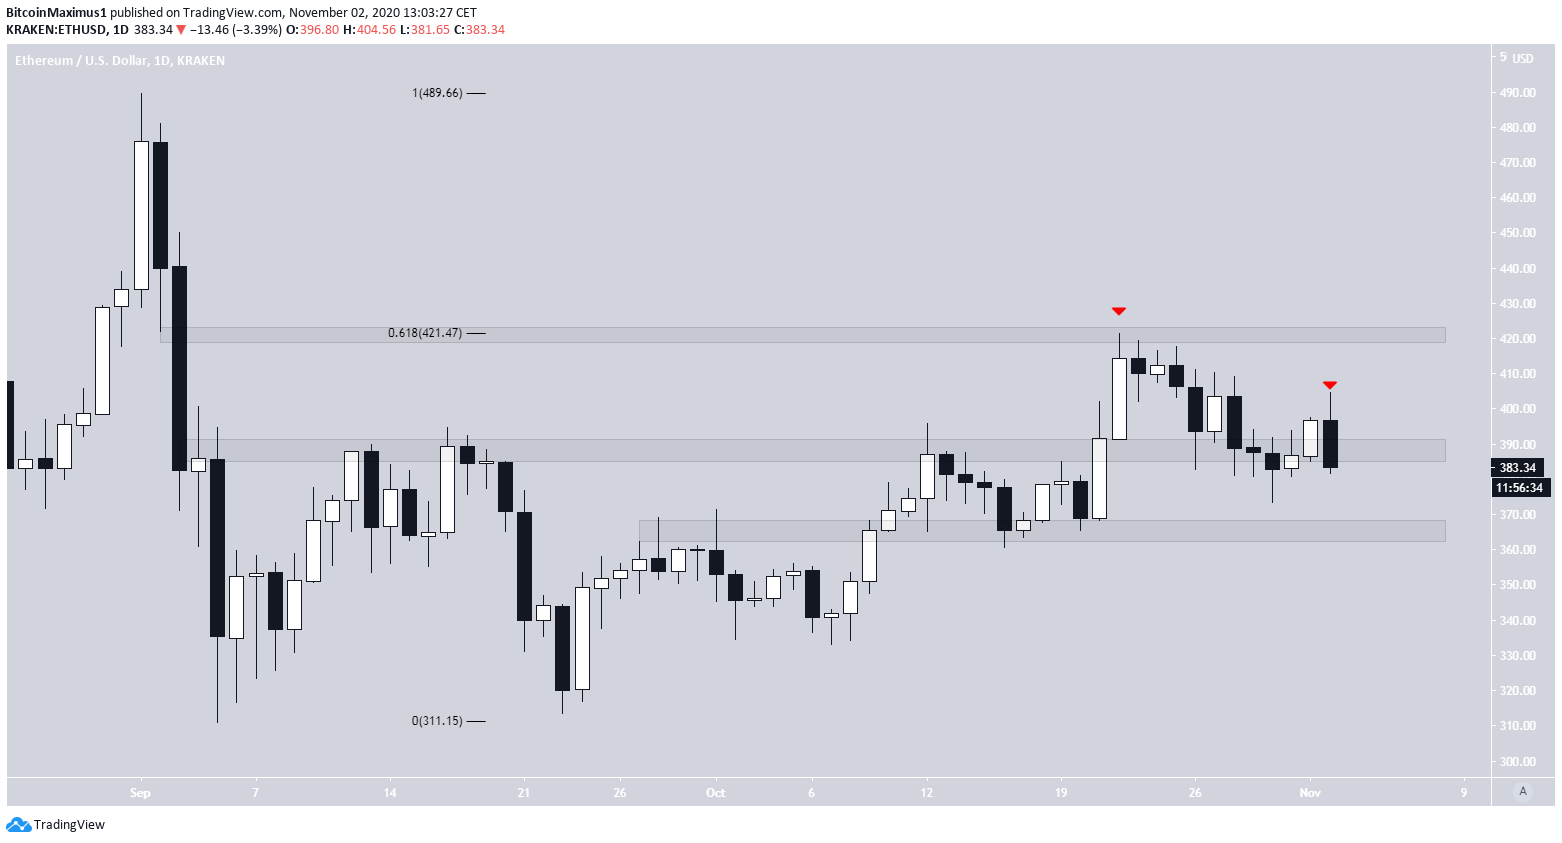
Ethereum Struggles to Maintain Support
The ETH price reached a high of $489.57 on Sept 1 but dropped sharply the next day, continuing to decline until it reached a low of $311.4 on Sept 5. Since then, the price has been moving upwards.
However, ETH was rejected by the $420 area on Oct 22. The area is the 0.618 Fib level of the entire drop and is now expected to act as resistance.
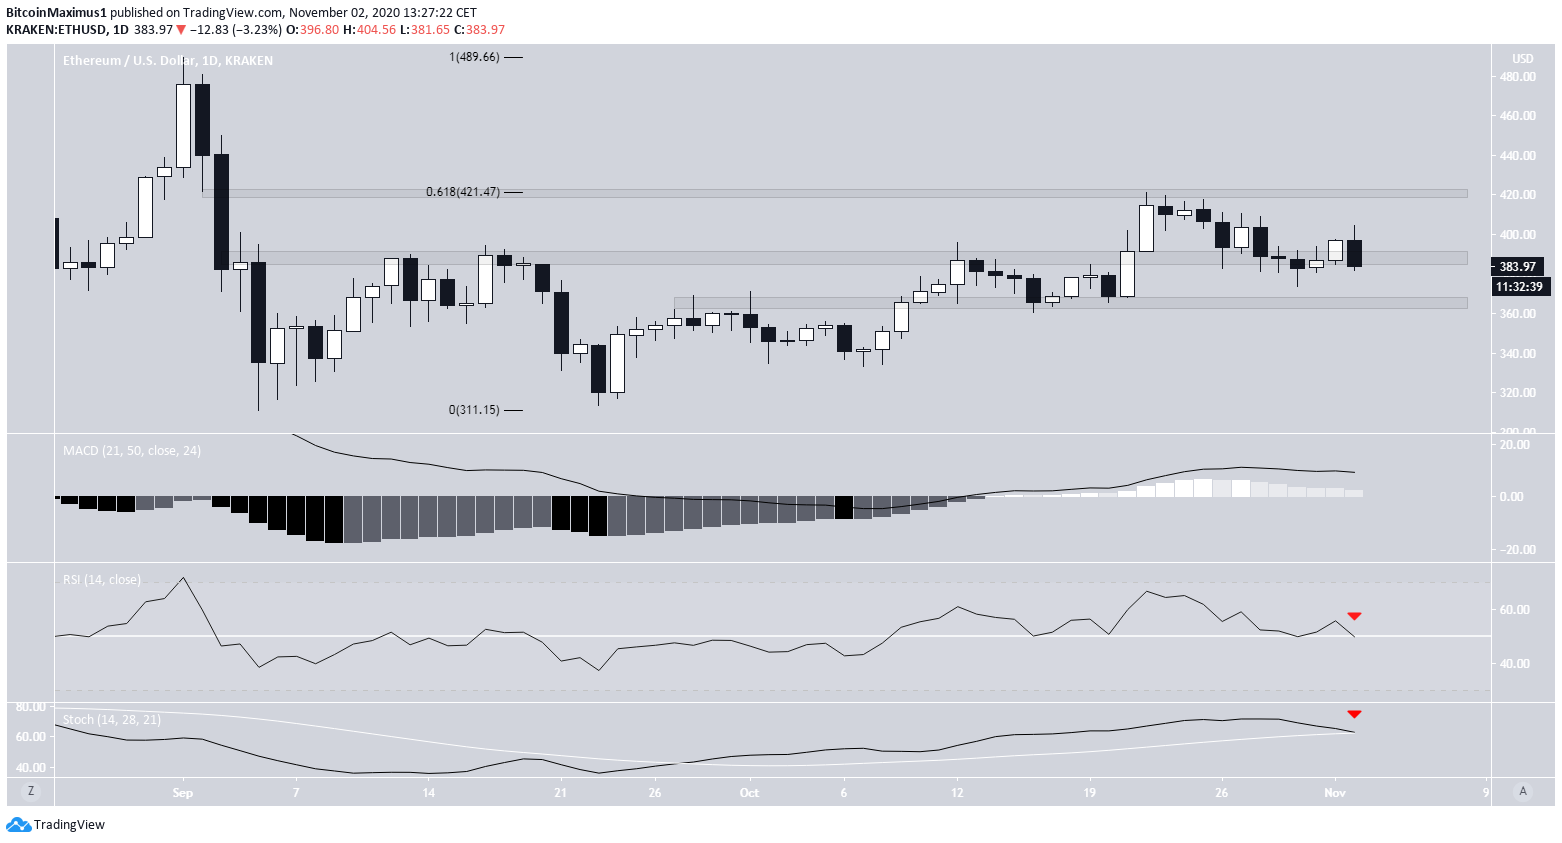
Currently, the price is trading inside the $390 area, which looks likely to act as support. However, the price is very close to breaking down, in which case the next closest support area would be found at $365.
Technical indicators on the daily time-frame are turning bearish, but have yet to confirm the bearish trend.
- The MACD is falling, but the signal line is above 0, and the MACD has yet to turn negative.
- The RSI is also falling and has reached the 50 line from above.
- The Stochastic Oscillator is in the process of making a bearish cross.
Therefore, a confirmed breakdown from the $390 area would confirm a bearish trend since it would likely also move the indicators into negative territory.
Future Move
Cryptocurrency trader @CryptoNewton stated that the ETH price could eventually break out from the current ascending channel, and outlined a rally that could take it all the way to it’s all-time highs.
Besides the bearishness from technical indicators, it seems that the price is trading inside a parallel ascending channel, and since slow, choppy movement contained within parallel lines is often corrective, it’s possible that the increase is a correction that will lead to lower lows, instead of it being a move that will lead to new highs, as outlined in the tweet.
If so, the price has completed an A-B-C corrective structure (blue), and will soon break down from the channel. A rally above the wave C high at $420.74 would invalidate this particular scenario.
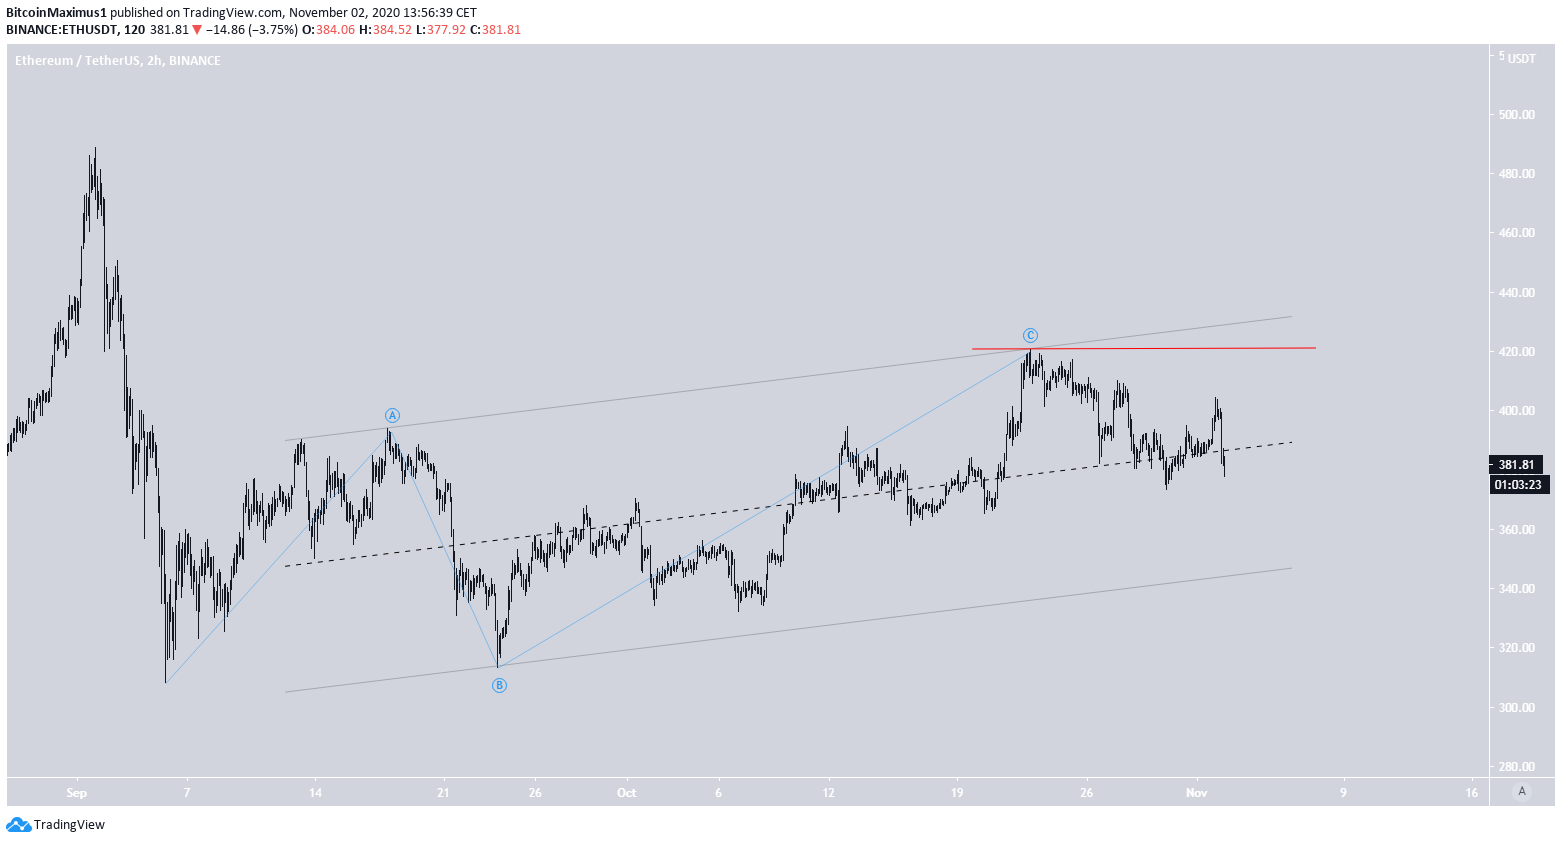
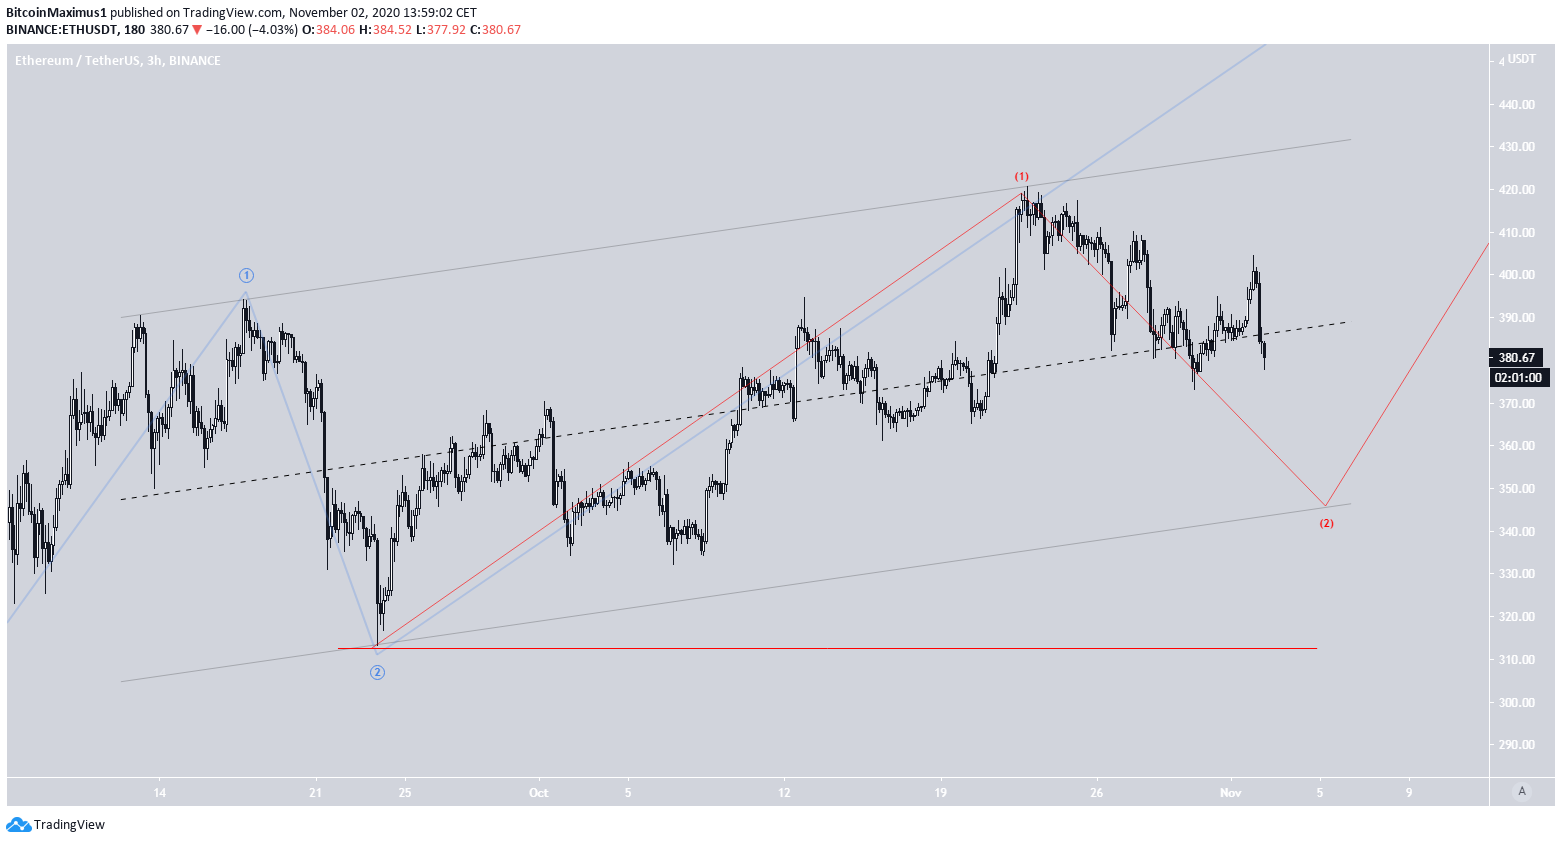
On the other hand, the only possibility of a bullish impulse would be if the price was in the process of completing a 1-2/1-2 wave formation (blue and red). If so, the proposed C wave in the previous image would be the top of the second 1 wave (red).
Even this scenario suggests that a drop towards the support line of the channel is likely, however, the price would probably rally afterward.
A decline below the wave 2 low (blue) at $313.9 would invalidate this particular wave count.
Conclusion
To conclude, it’s likely that Ethereum’s trend has been bearish since the Sept 3 drop while the current rally is corrective. A fall below $310 would confirm this.
On the other hand, an increase and breakout from the current parallel ascending channel would invalidate the scenario and indicate that ETH is heading higher. At the time of writing, this seems unlikely.
For BeInCrypto’s latest Bitcoin analysis, click here!
Disclaimer: Cryptocurrency trading carries a high level of risk and may not be suitable for all investors. The views expressed in this article do not reflect those of BeInCrypto.


