


Leading altcoin Ethereum broke below its narrow consolidation range on Friday, marking the beginning of a sustained downtrend poised to continue into the new week. The altcoin dipped below $2,300 for the first time in a month, as the tensions between the US, Israel, and Iran escalated yesterday.
The breakdown has triggered a surge in sell-side pressure across the Ethereum futures market, raising concerns of a deeper decline ahead.
Ethereum Bears Tighten Grip
The bearish bias against ETH is reflected by its taker buy/sell ratio, which has consistently posted negative values since Friday. At press time, this stands at 0.93 per CryptoQuant, indicating that sell orders dominate buy orders across the ETH futures market.
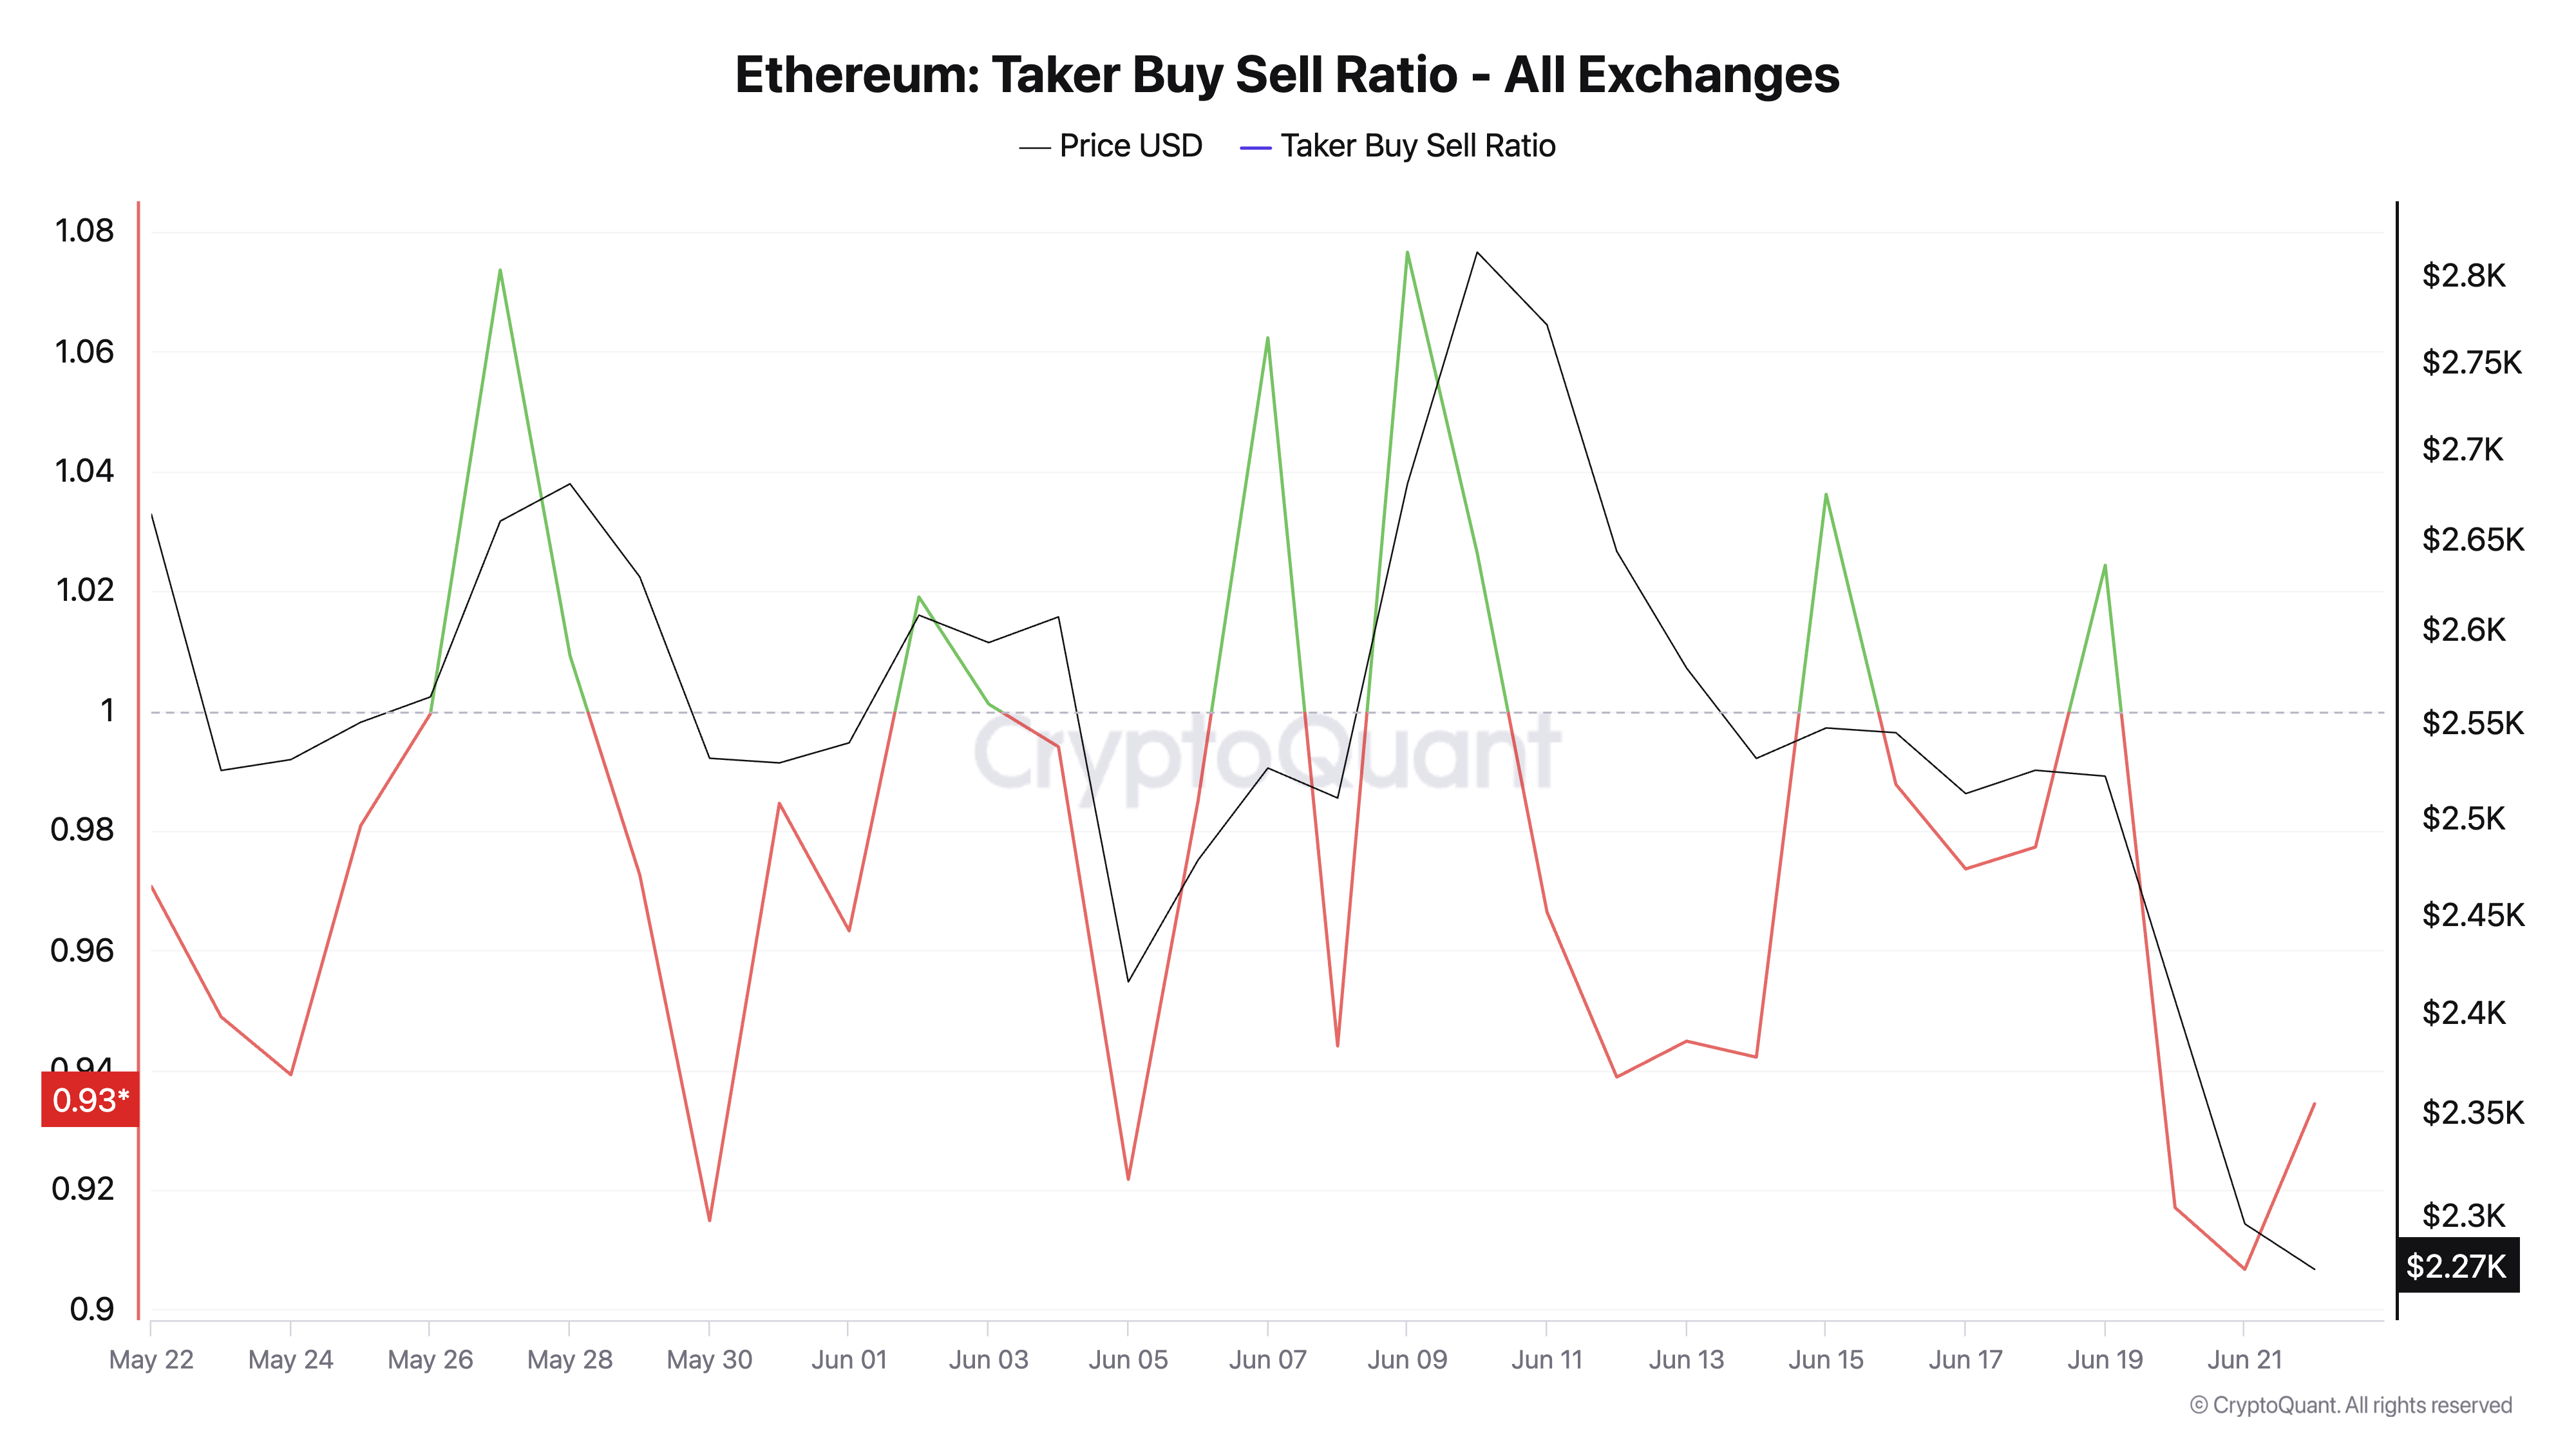
Ethereum Taker Buy Sell Ratio. Source: TradingView
An asset’s taker buy-sell ratio measures the ratio between the buy and sell volumes in its futures market. Values above one indicate more buy than sell volume, while values below one suggest that more futures traders are selling their holdings.
The steady dip in ETH’s taker buy/sell ratio over the past few days points to a climbing sell-off among futures traders. This mounting sell-side pressure confirms weakening sentiment and could accelerate price declines if it continues.
In addition, ETH remains significantly below its 20-day Exponential Moving Average (EMA), which shows the bearish sentiment surrounding the asset. At press time, this key moving average forms dynamic resistance above ETH’s price of $2,497.
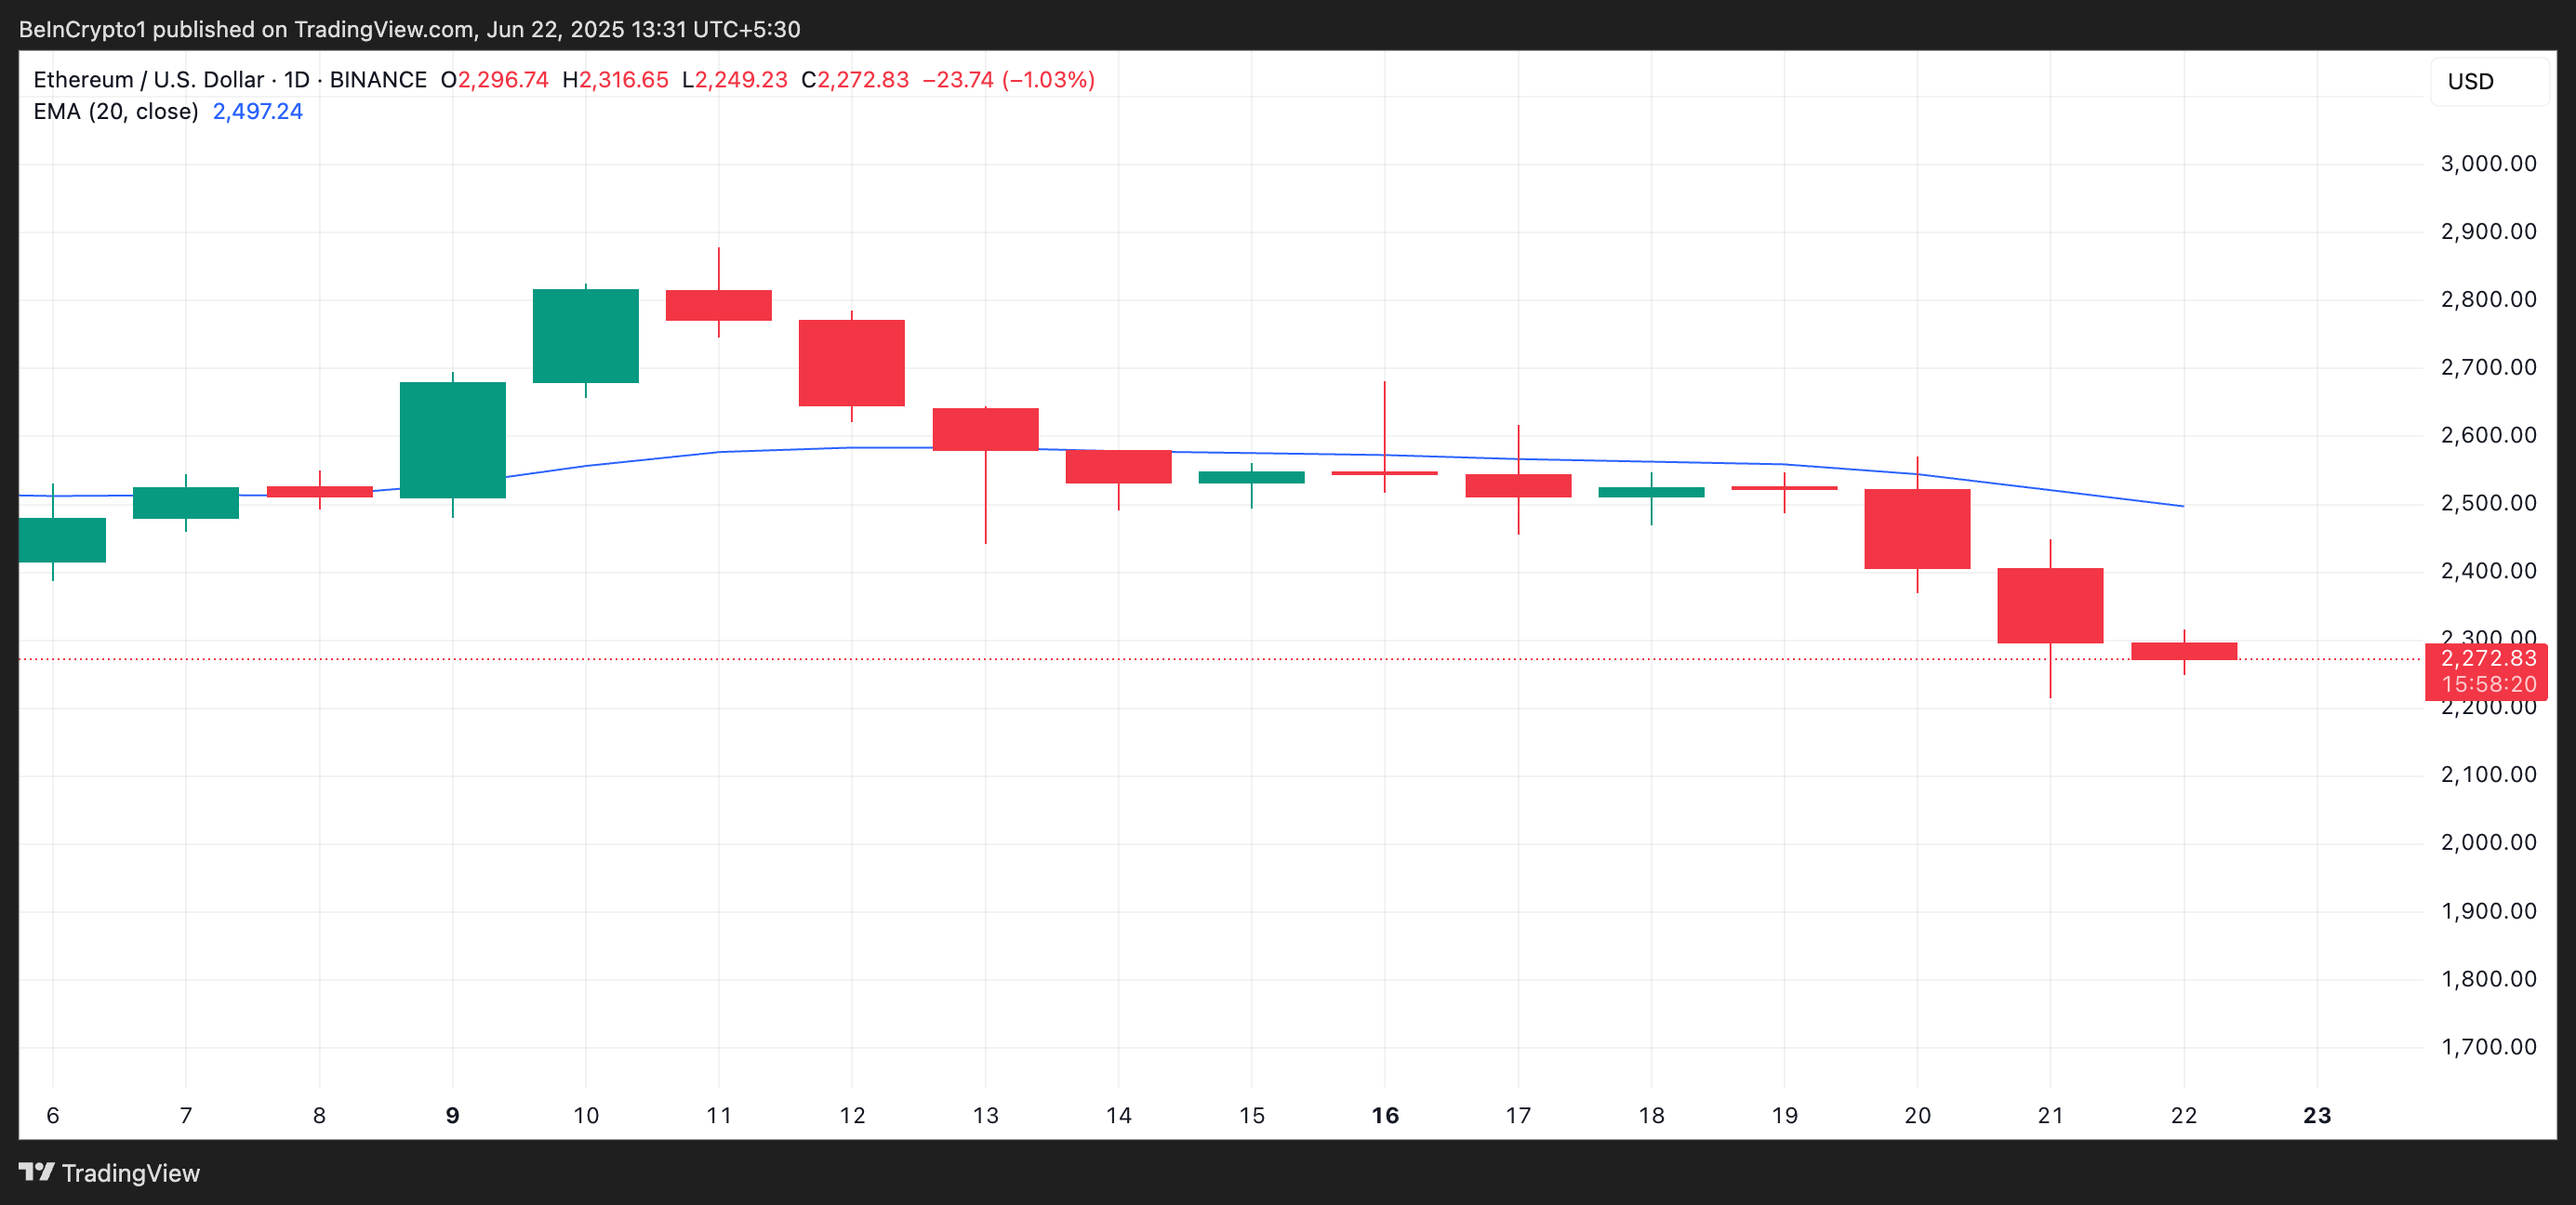
The 20-day EMA measures an asset’s average price over the past 20 trading days, giving weight to recent prices. When the price falls below the 20-day EMA, it signals short-term bearish momentum and suggests sellers are in control.
This further confirms the weakening bullish structure around ETH, as the asset struggles to reclaim short-term trend support.
Will Ethereum Hold the Line?
ETH currently trades at $2,272, noting a 6% decline amid the broader market’s pullback of the past 24 hours. With climbing sell pressure across its spot and futures market, ETH risks pulling toward the support at $2,185.
If this support fails, ETH’s price could plummet further to $2,027.
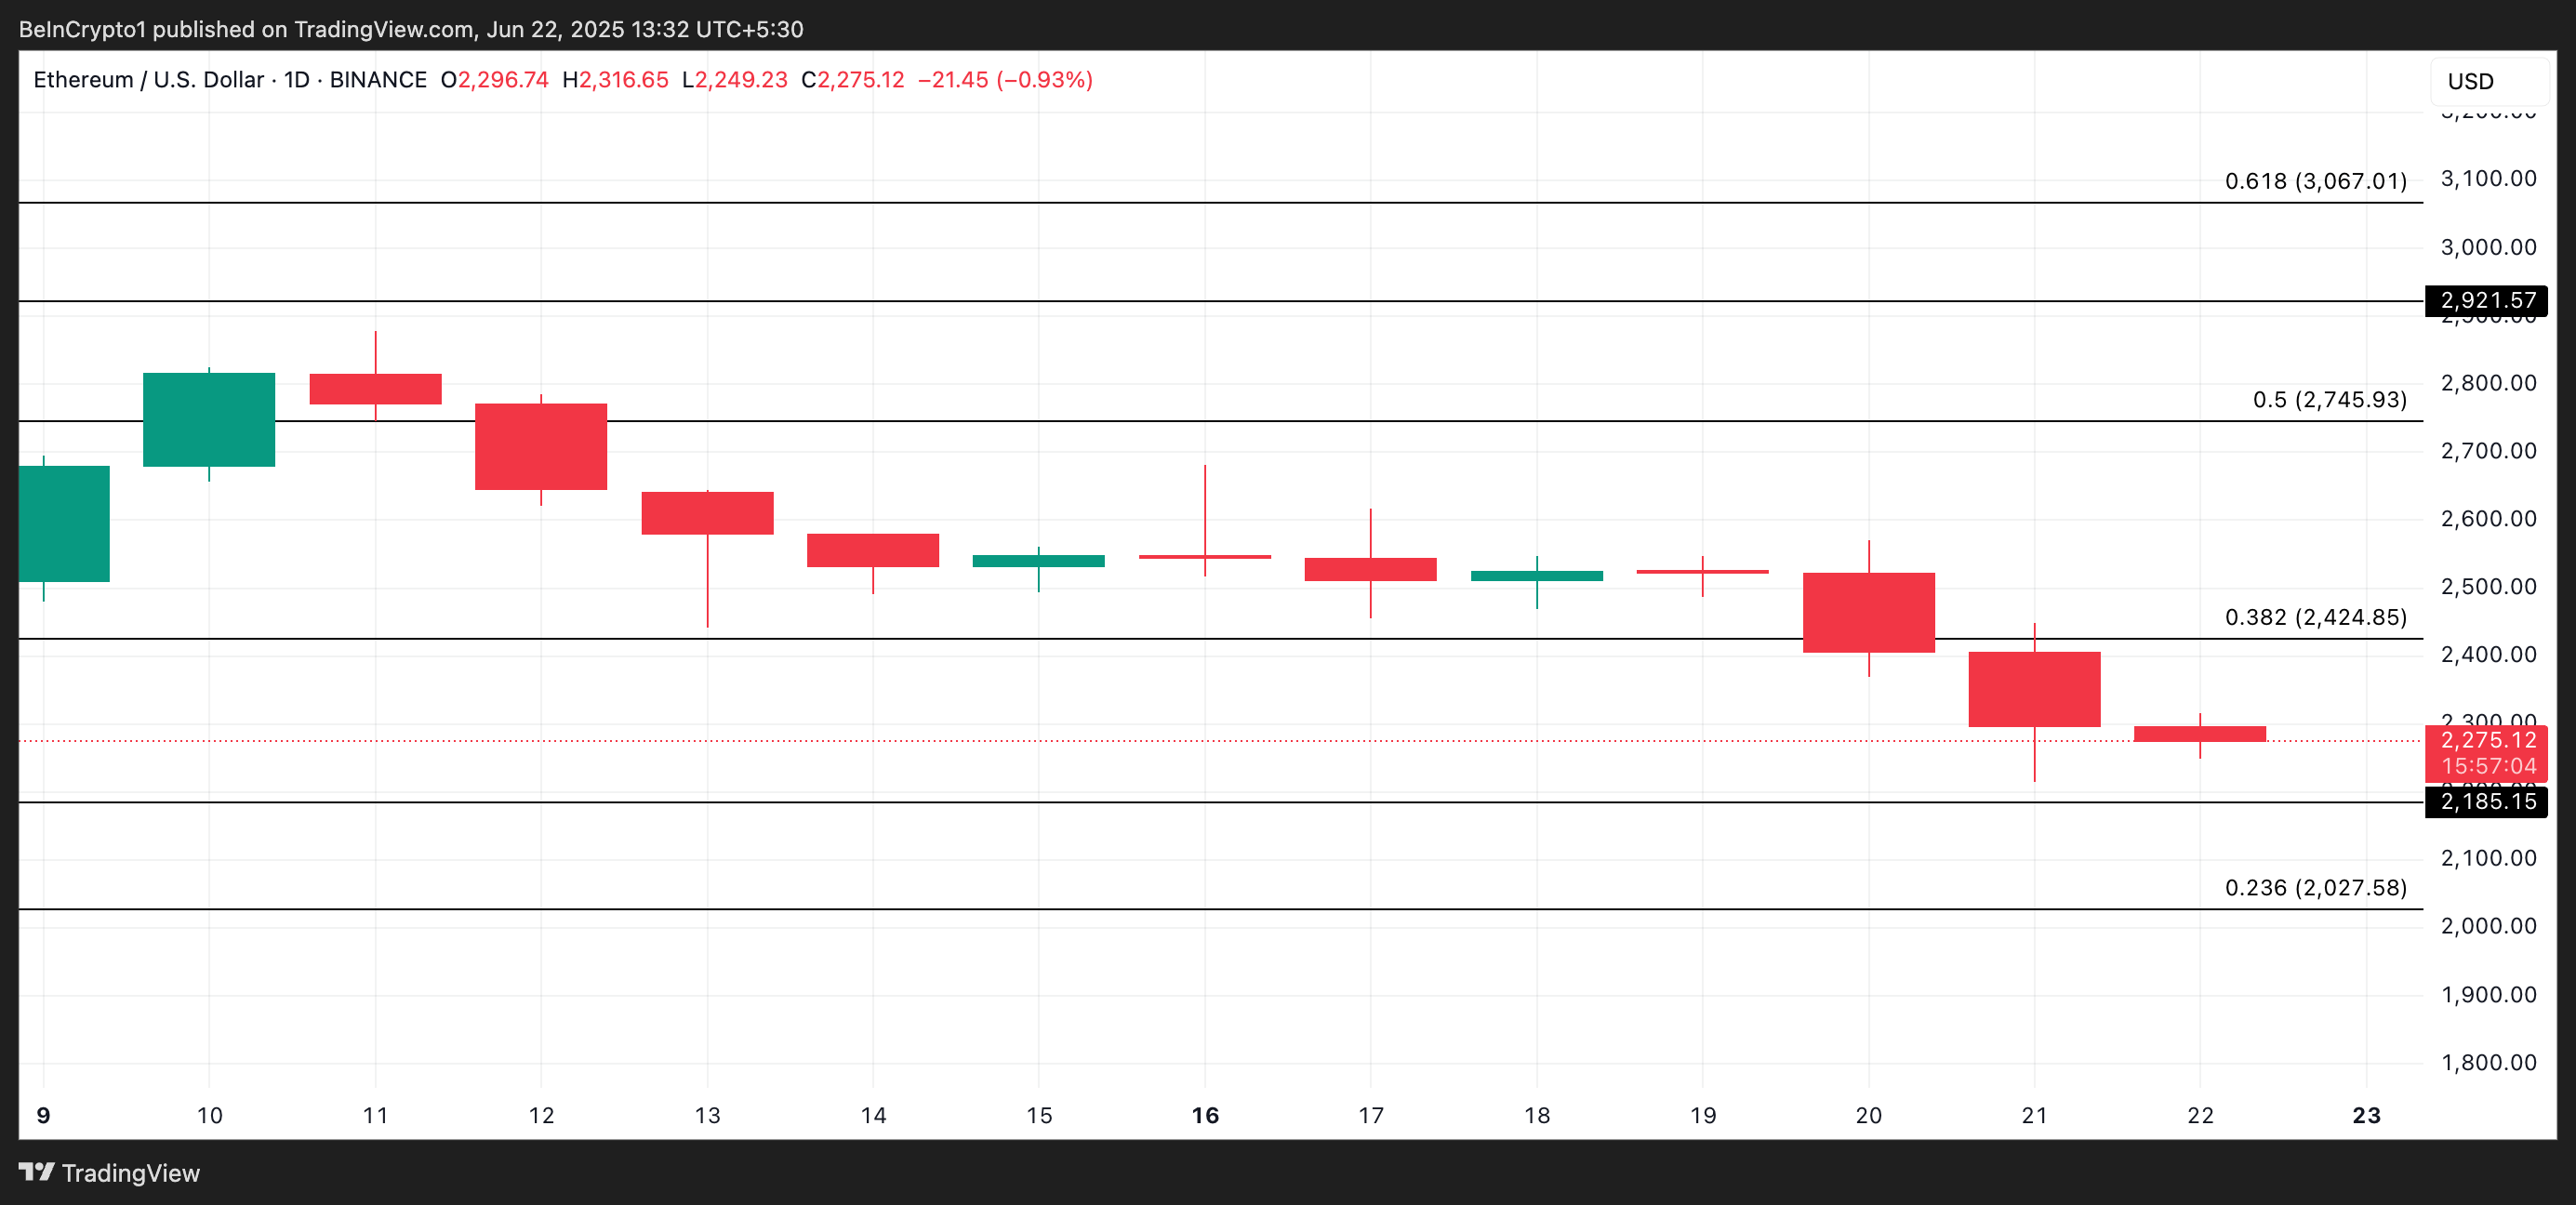
However, if buying pressure gradually gains momentum, ETH could rebound and climb to $2,424.



