The Ethereum (ETH) price has reached a massive long-term resistance area near $400. While it briefly managed to climb above this level, it has failed to close above it.
The shorter-term trend has begun to show weakness, and a retracement seems imminent before the price can resume its upward movement.
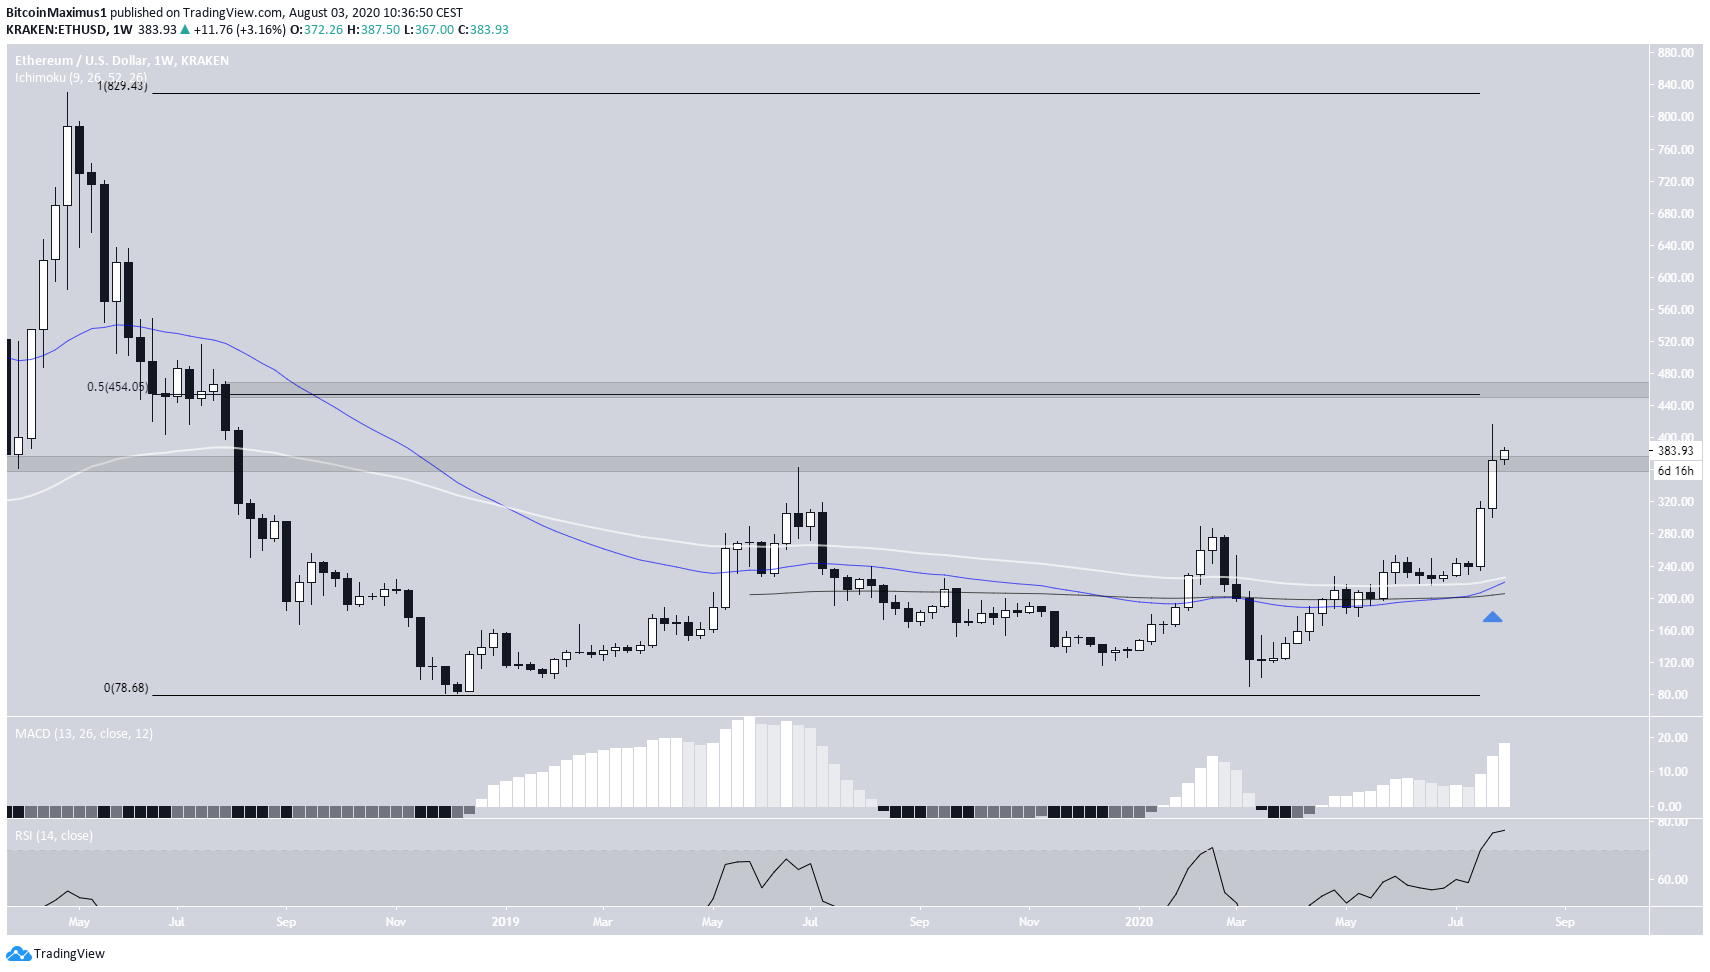
Long-Term Ethereum Trend
The weekly chart for Ethereum shows that while the price has likely begun an upward move, it is trading right inside a long-term resistance area between $375 and $400. The area acted as support in April 2018, before turning back into resistance in June 2019.
While the price is again trading in this range, it has failed to reach a weekly close above the upper limit and created a long upper-wick last week. The next resistance area is the 0.5 Fib level of the entire upward move around $455.
Technical indicators are bullish. Both the MACD and RSI are growing, even though the latter is inside the overbought territory.
The price is trading above the 50, 100, and 200-day moving averages (MA), which have made two bullish crosses between them.
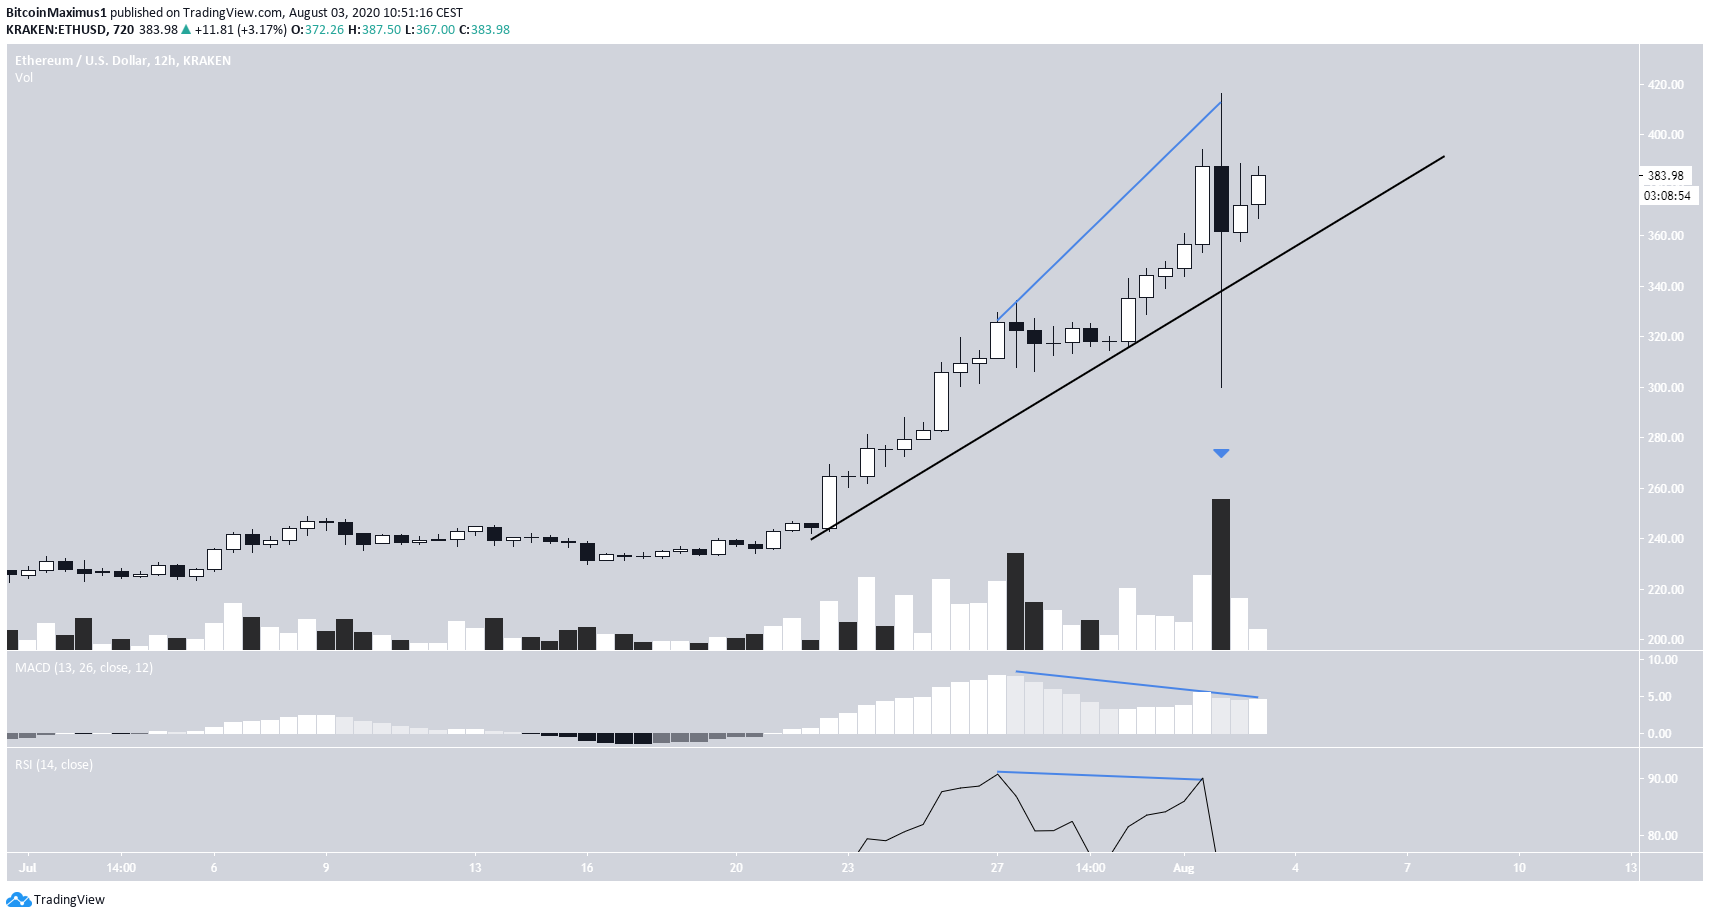
However, the shorter-term chart shows weakness in the form of bearish divergences in both the RSI and the MACD.
While we can see a bearish candlestick with very significant volume, it has wicks on both sides. The lower wick is longer and is a sign of buying pressure. In addition, the possible steep ascending support line that the price is following has not yet been broken.
A breakdown from the support line would likely confirm that a corrective phase has begun.
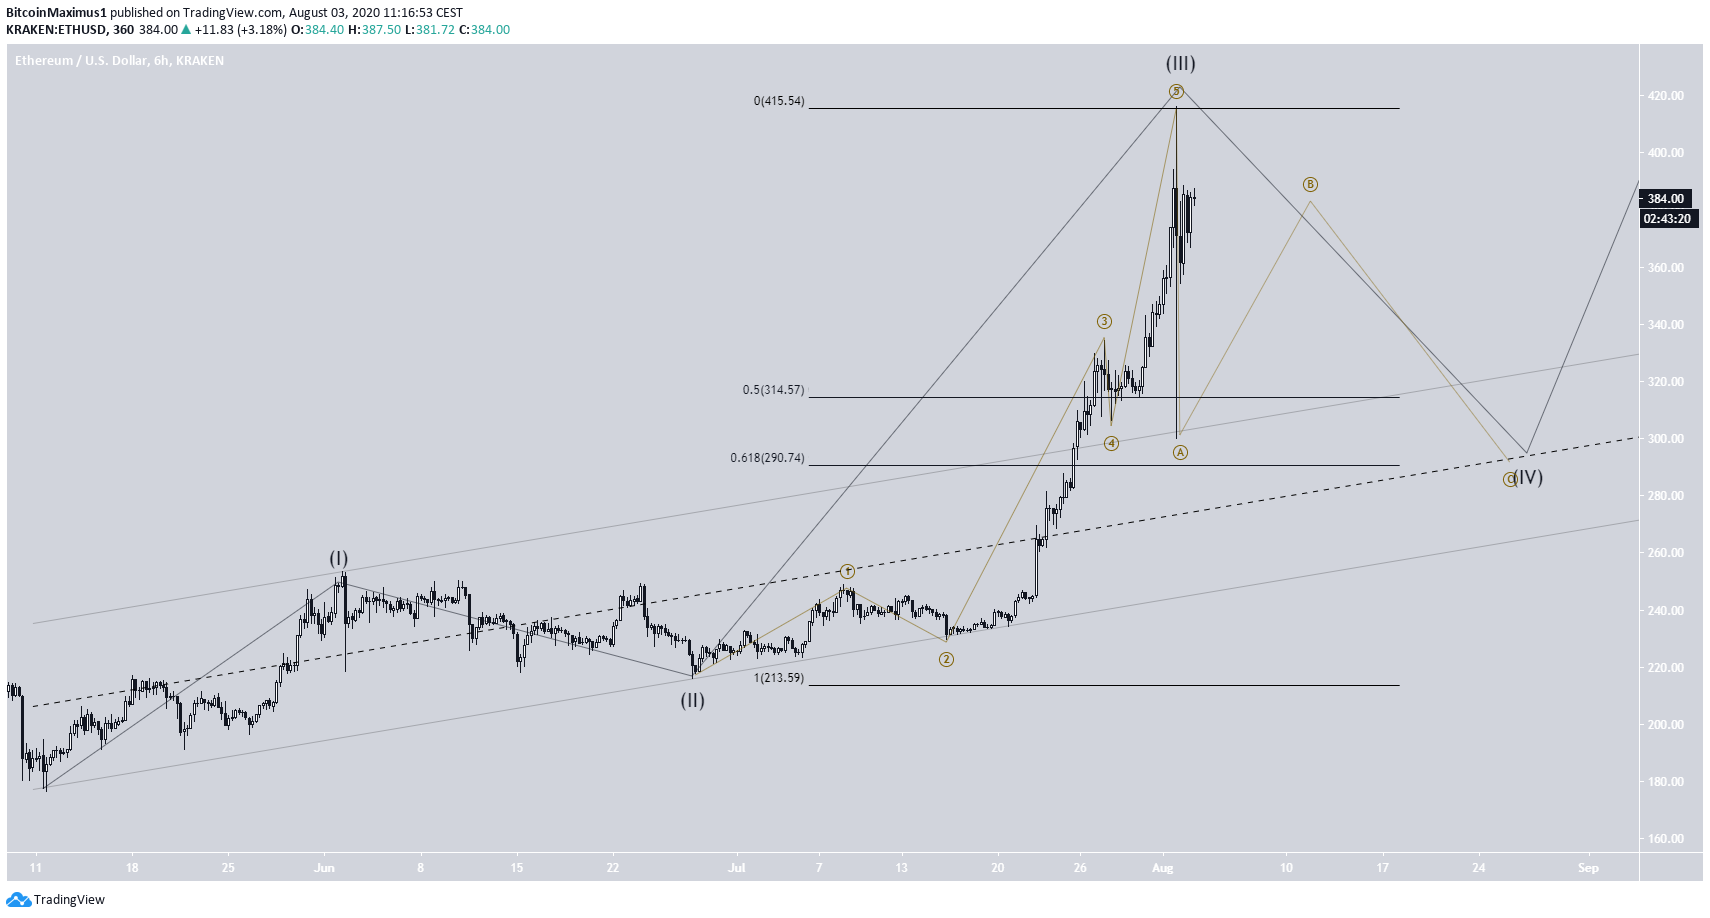
Wave Count
Cryptocurrency trader @glowto1994 outlined a chart for Ethereum, suggesting that the price will soon make another upward move. However, the movement is still part of a correction, which suggests that Ethereum could decrease afterward.
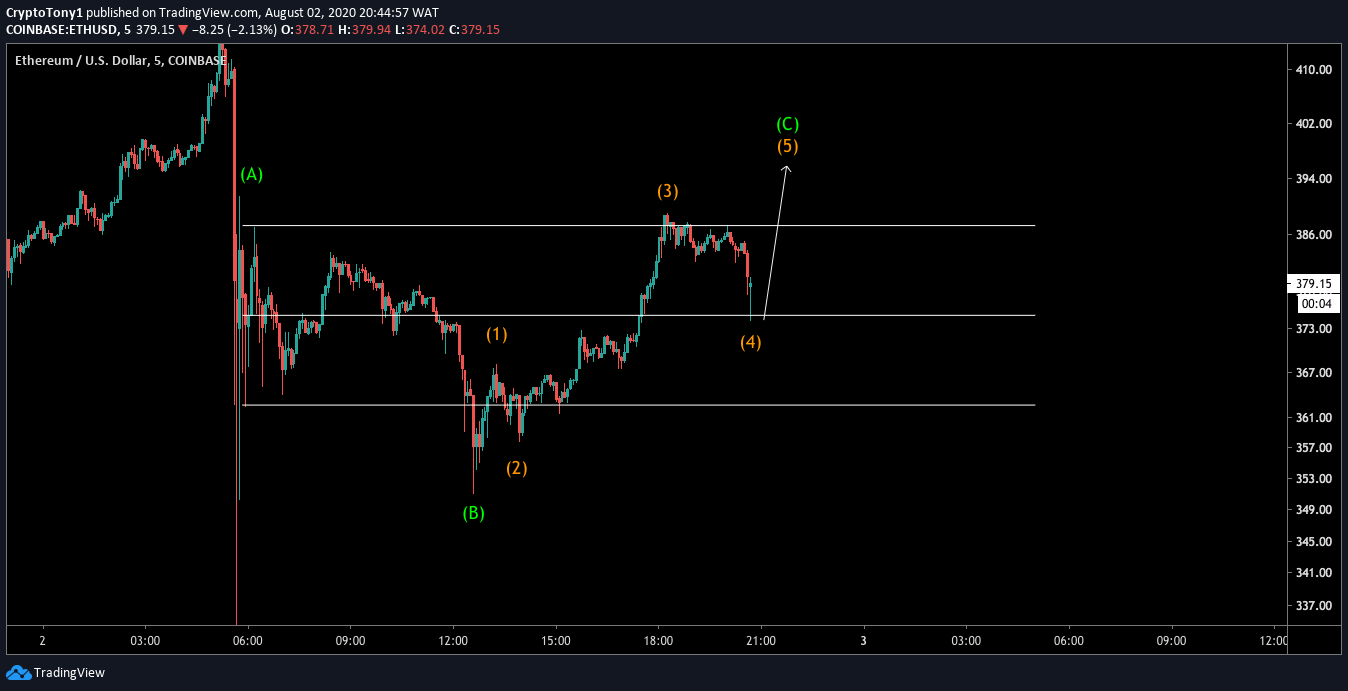
We can outline the beginning of an impulse wave on May 13 in which Ethereum has just finished the third wave and has begun the fourth. This fourth wave looks to be transpiring in an A-B-C correction, with the price currently being in the B wave.
A likely level for the correction to end would be at $290, the 0.618 Fib level of wave 3, and the middle of the channel connecting waves 1 and 2.
A decrease below the top of wave 1 at $255 would invalidate the wave count.
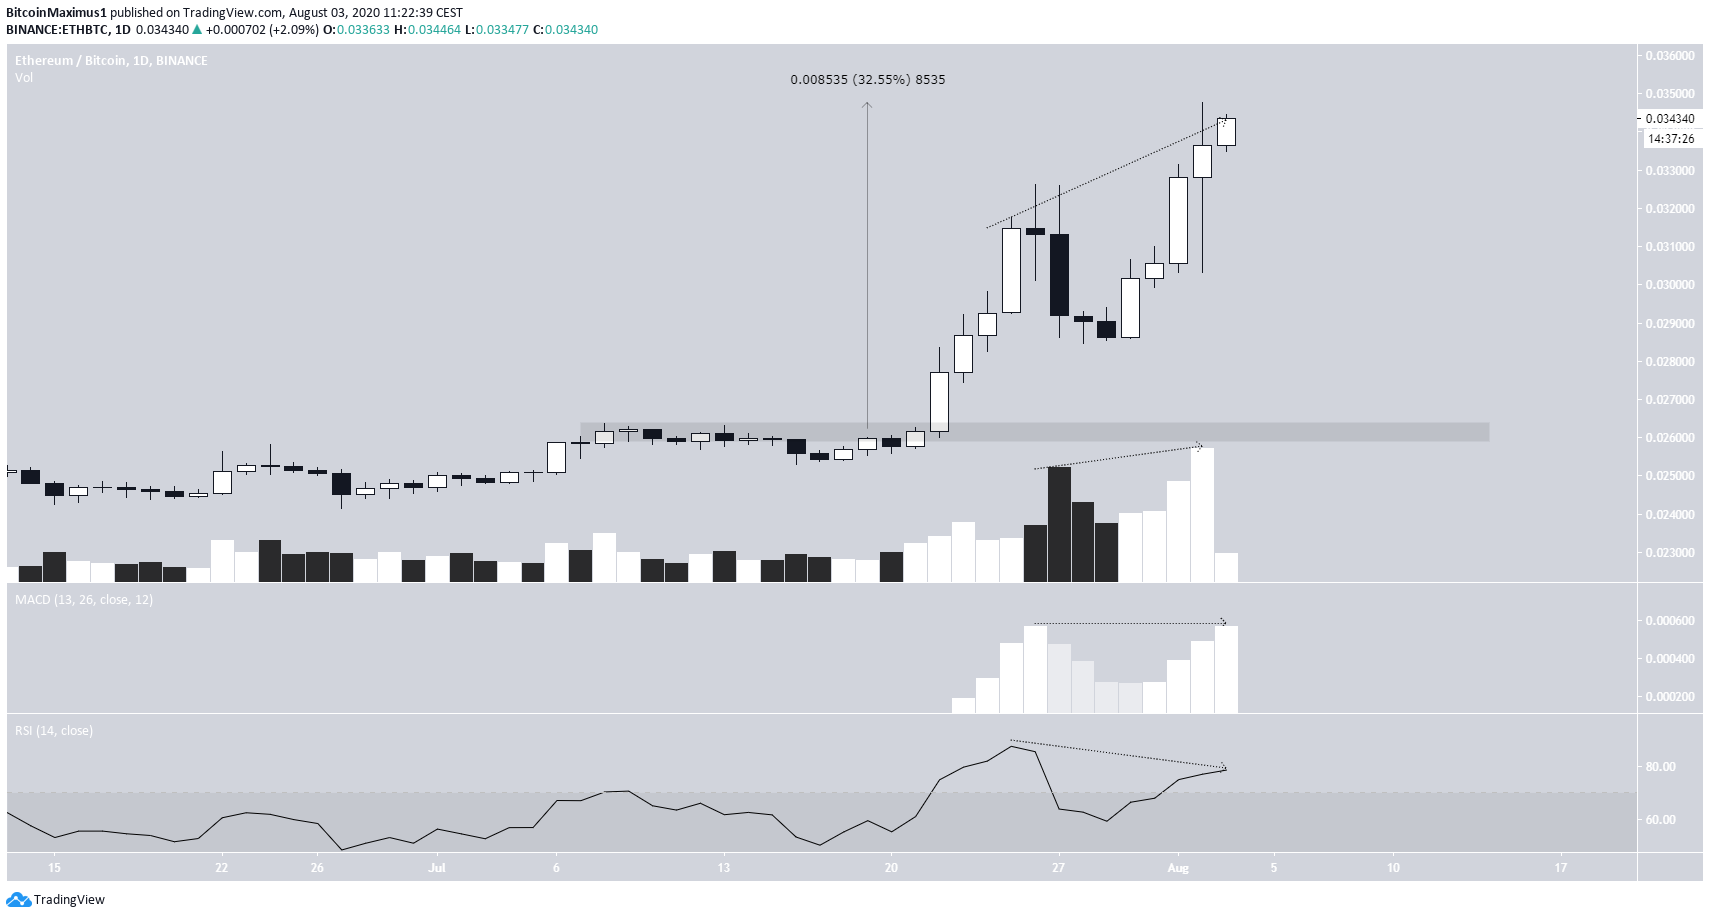
Ethereum/Bitcoin
The ETH/BTC pair has increased by 32% since July 22. Currently, the price has reached a resistance area that has been in place since May 2019 at ₿0.035.
Technical indicators are giving conflicting signals. While there is a bearish divergence in both the RSI and MACD, the volume has made a higher-high alongside the price. Therefore, while the move is overextended, there is no clear sign of weakness yet. In addition, there is no bearish candlestick on the daily time-frame over the past five days.
If the price continues to increase, the next resistance area would be found at ₿0.04.