


Ethereum (ETH) and Ethereum Classic (ETC) appear to have similar long-term outlooks. Does that mean they also have profitable trade set-ups?
In this article, we answer this question by comparing price trends and fluctuations alongside technical indicators. To conclude, we summarize our findings and rank both of the cryptocurrencies based on their future price potential.
You can read our previous analysis of ETH and ETC here.
Ethereum (ETH) vs Ethereum Classic (ETC): Price Outlook
ETH/USD reached a low of $119.22 on Feb 12. Over the next few weeks, Ethereum made significant gains, reaching a high of $170 on Feb 24.
Since then, Ethereum has been trading inside an ascending channel as seen in the graph below:
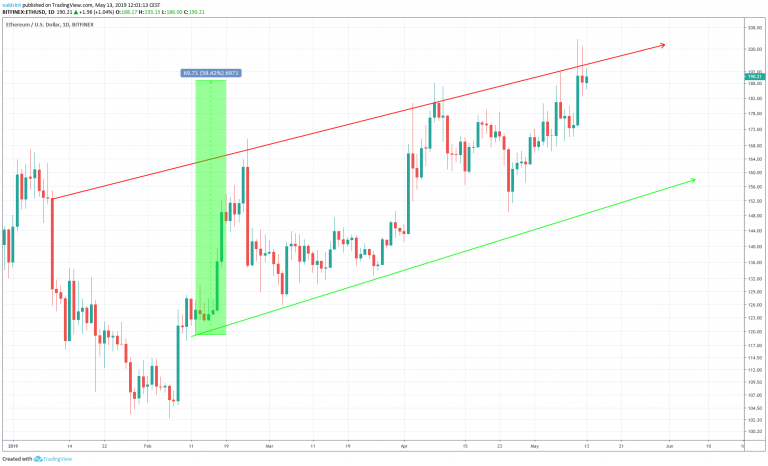
The resistance and support lines have been touched four and three times respectively.
In March, the support line was touched twice before an upward move took the price to the resistance line. Similarly, the resistance line has been touched twice during April and May.
Since the formation of the channel, the price has increased by 58% with a high of $203.6 reached on May 12.
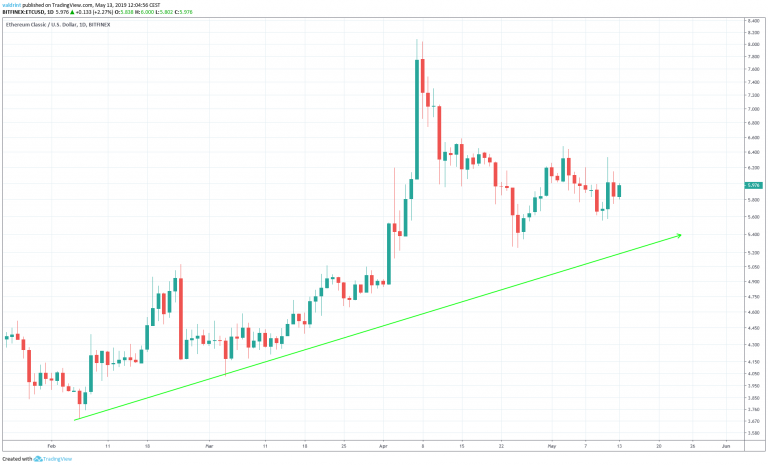
Ethereum Classic has also been trading along an ascending support line reaching highs above $8 on Apr 7. It has been decreasing since.
However, there is no visible resistance line. Thus, while Ethereum displays a clear trading pattern, Ethereum Classic does not.
Ethereum’s Broadening Ascending Wedge
To better assess possible short-term price fluctuations, Ethereum is analyzed in a shorter time frame alongside te.
On Apr 26, the price reached a low of $148.8 and a high of $168.8 respectively. A gradual increase began. The price has been trading inside an ascending broadening wedge since:
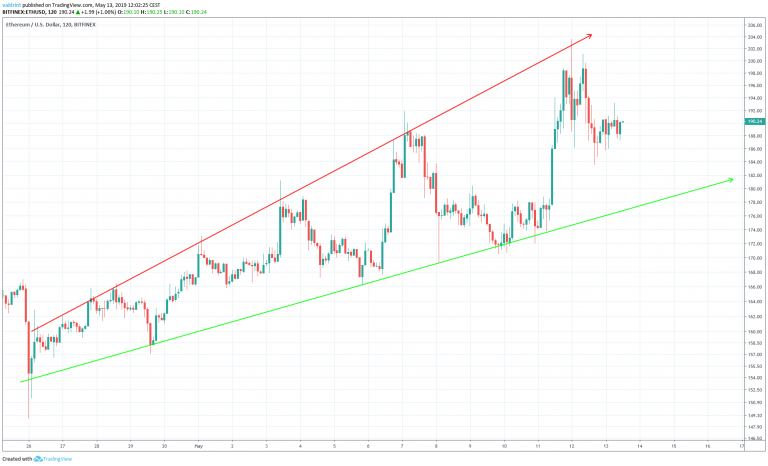
At the time of writing, it was trading in the middle of the wedge.
To determine whether or not Ethereum will bounce back toward the resistance line or break down, we have outlined the price alongside the RSI and the MACD in the graph below:
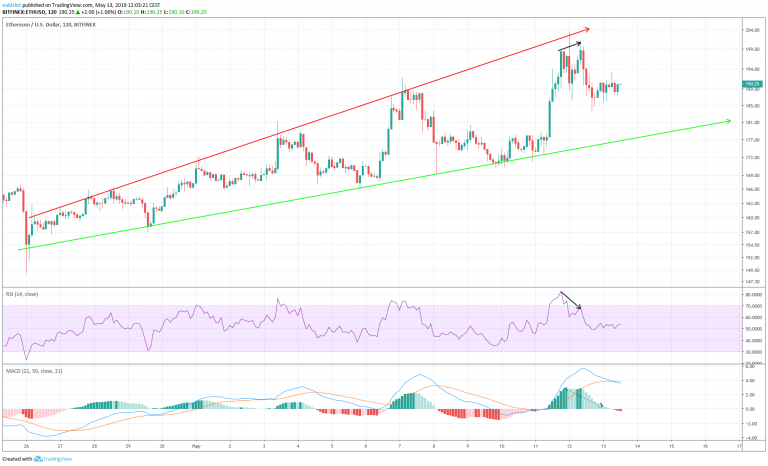
On May 11, the price reached a high of $198.75. It reached the same high again the next day.
Similarly, the RSI and the MACD reached a high on May 11. However, they have proceeded to generate lower values since.
This is known as bearish divergence and often precedes price decreases. The use of these indicators suggests that price may continue decreasing. It is possible that Ethereum will reach and validate the support line of the wedge.
However, a portion of that decrease appears to have already occurred. Thus, we believe that this drop is likely to continue until the support line of the wedge is reached. Volatility may be experienced during this period with subsequently lower highs and lows reached.
Due to the fact that the price is trading in the middle of the wedge, there is no profitable trading setup in place.
Our previous long trade was successful, and the price not only reached our initial target of 5%, but kept increasing further and reached the resistance line.
Now, let’s move on to ETC:
Ethereum Classic’s Symmetrical Triangle
On Apr 24, the price reached a low of $5.2. An increase began and on May 3, it reached a high of $6.48. A decrease ensued. The price has been trading inside a symmetrical triangle since:
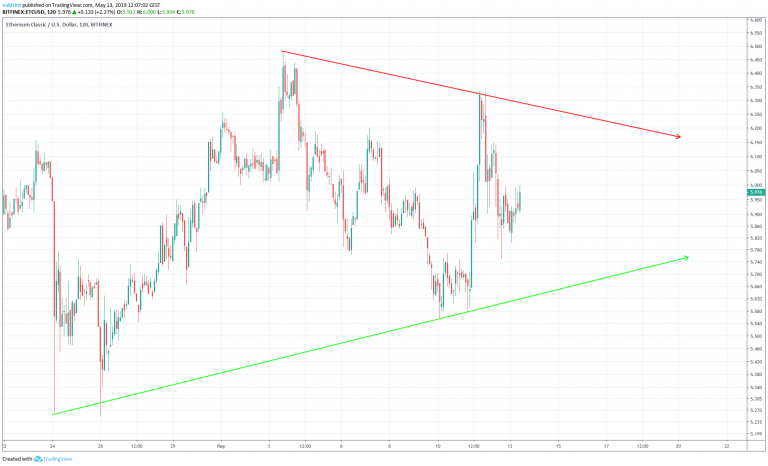
At the time of writing, the price was trading in the middle of the support channel.
In order to figure out where it will go next, we have outlined the price alongside the 50- 100- and 200-period moving averages (MA):
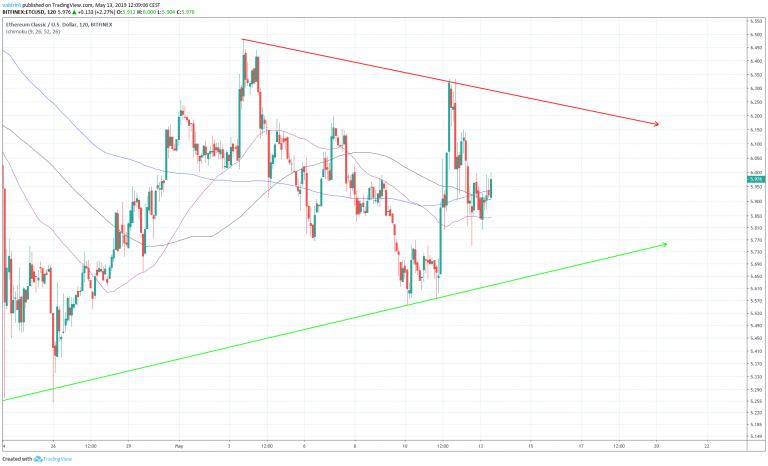
On May 12, the price moved above the 50-,100- and 200-period moving averages. This is a bullish sign that supports upward movement.
However, two bearish crosses occurred on May 10 and 11. This is a bearish sign that suggests further downward movement for Ethereum Classic.
Therefore, our indicators give conflicting opinions. Furthermore, the price is trading inside a neutral pattern.
Combining this with the fact that the price is not trading close to the resistance or support lines, we do not see any profitable trade setups.
Conclusion
To conclude, ETH is trading inside an ascending channel, while ETC is following an ascending support line. However, ETH is very close to the resistance line of the channel, while ETC has almost dropped to the support.
In the short-term, however, ETH is trading inside an ascending broadening wedge, which is a bearish pattern, while ETC is trading inside a symmetrical triangle, which is a neutral pattern. Furthermore, ETH has been developing bearish divergence.
Due to the position of the price inside their respective patterns, no profitable trade setups were identified for either.
In the long term, we believe that both Ethereum and Ethereum Classic will drop towards their support lines. Afterward, opportunities for very profitable long trade setups could arise.
However, ETH is currently very far from its support line, creating the opportunity for larger decreases for a significant period.
To conclude, we believe that ETC faces better short-term prospects than ETH at the current moment.
A summary is presented in the table below:
ETH
ETC
WINNER
Outlook
Following an ascending support line
Tie
Pattern & Indicators
Bearish divergence in the RSI and the MACD
Slightly above MAs
ETC
Do you think that Ethereum and Ethereum Classic are both poised for a decrease? Which do you think is the better investment?
Disclaimer: This article is not trading advice and should not be construed as such. Always consult a trained financial professional before investing in cryptocurrencies, as the market is particularly volatile.


