


The Ethereum (ETH) price is approaching an important resistance area both in the long and the short-term.
While Ethereum is expected to reach this resistance, we cannot yet determine if it will be successful in holding on above $600.
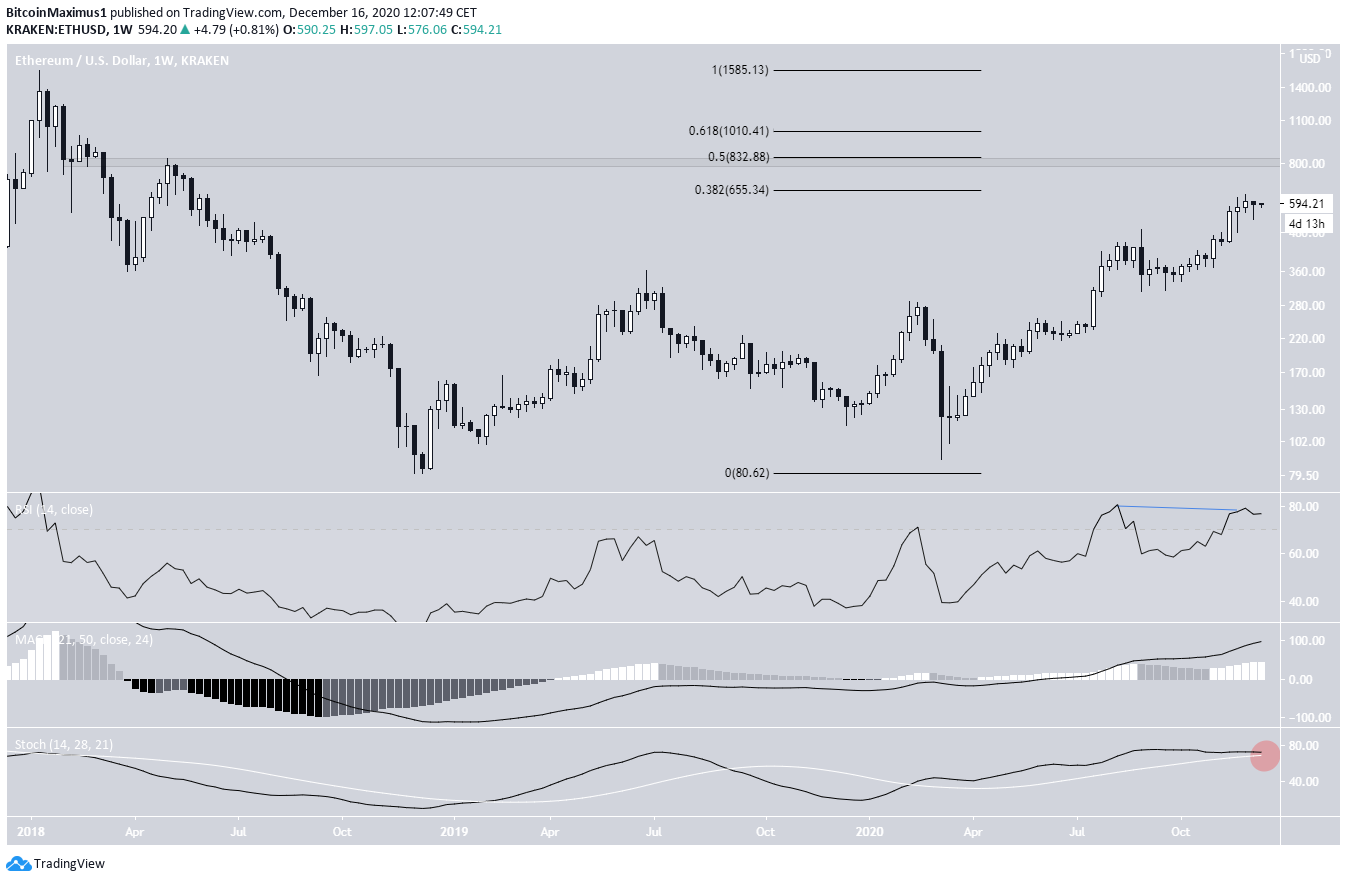
Ethereum Long-Term Levels
The ETH price has been increasing since the beginning of March. At the time of press, it was approaching the 0.382 Fib retracement level of $655. The 0.5 Fib retracement level at $832 is also a major horizontal resistance and will likely be a pivotal level to keep an eye on.
Technical indicators provide ambiguous signals. While the RSI has generated a bearish divergence, the MACD is still increasing. The Stochastic oscillator is close to making a bearish cross but has yet to do so (shown with the red circle below), further fueling the indecision.
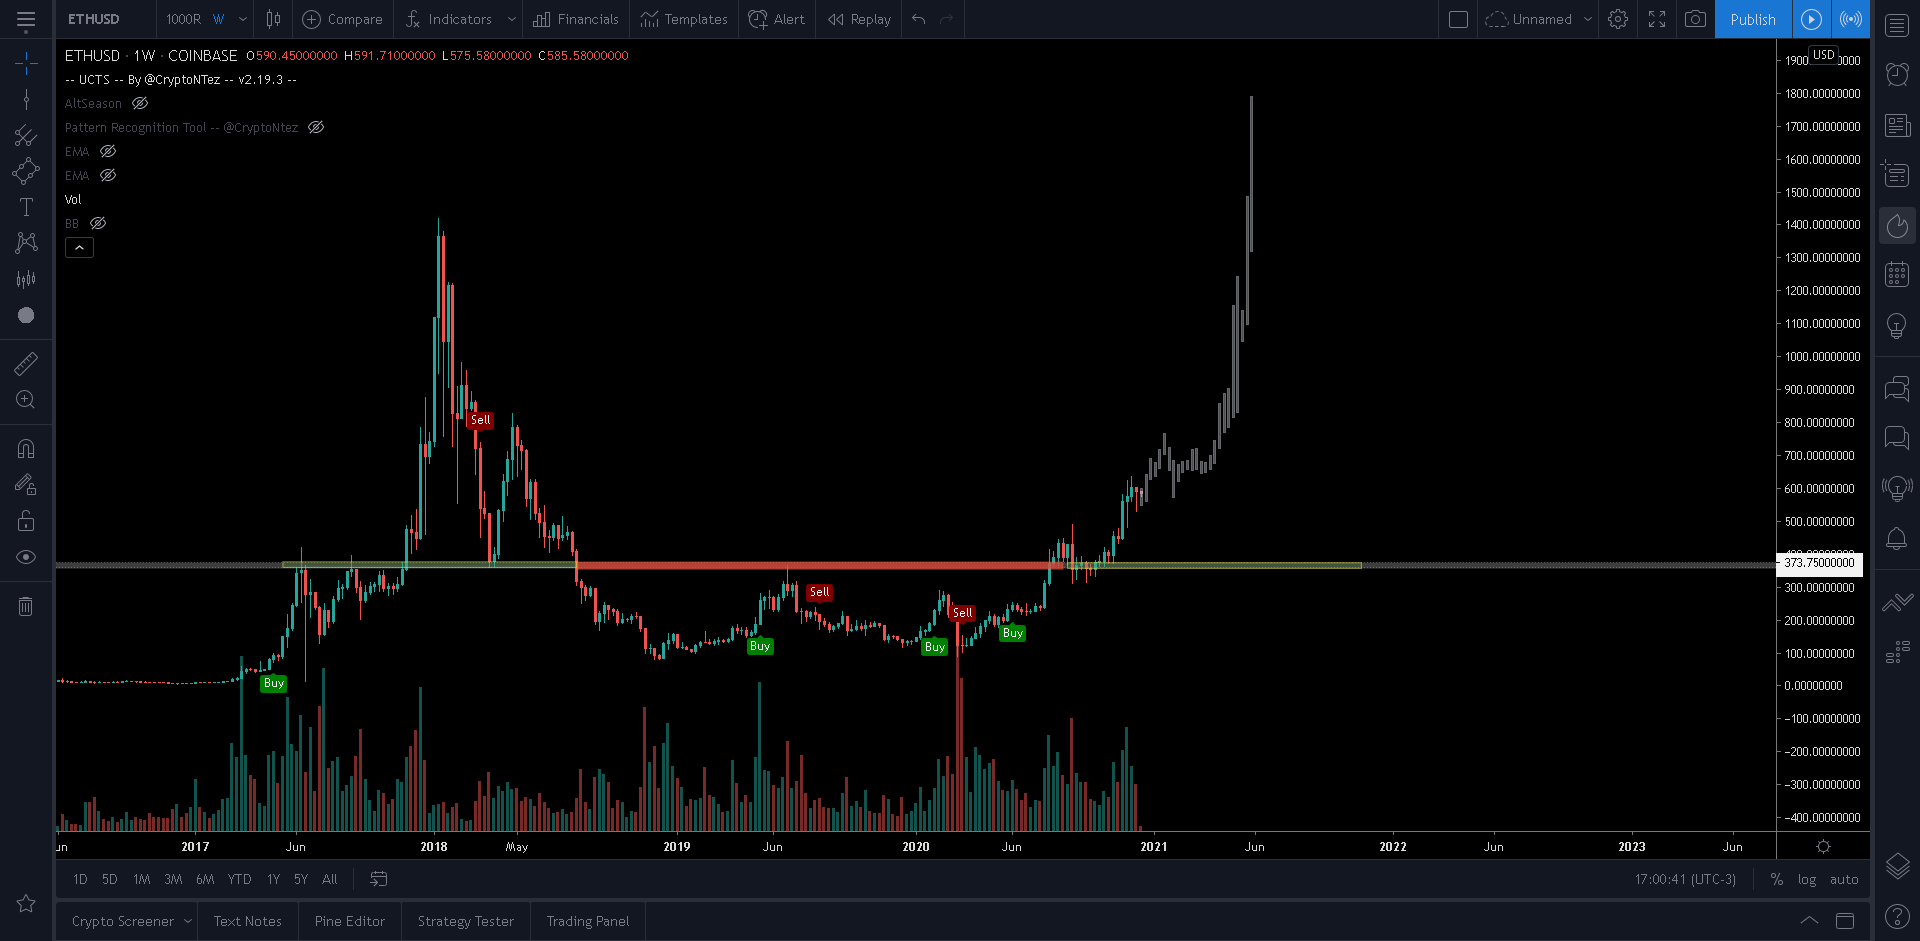
Cryptocurrency trader @CryptoNTez outlined an ETH Chart which shows a nearly parabolic upward movement that could take it to a new all-time high.
While this scenario is possible, there are numerous resistances left to clear and technical indicators do not support it.
Future Movement
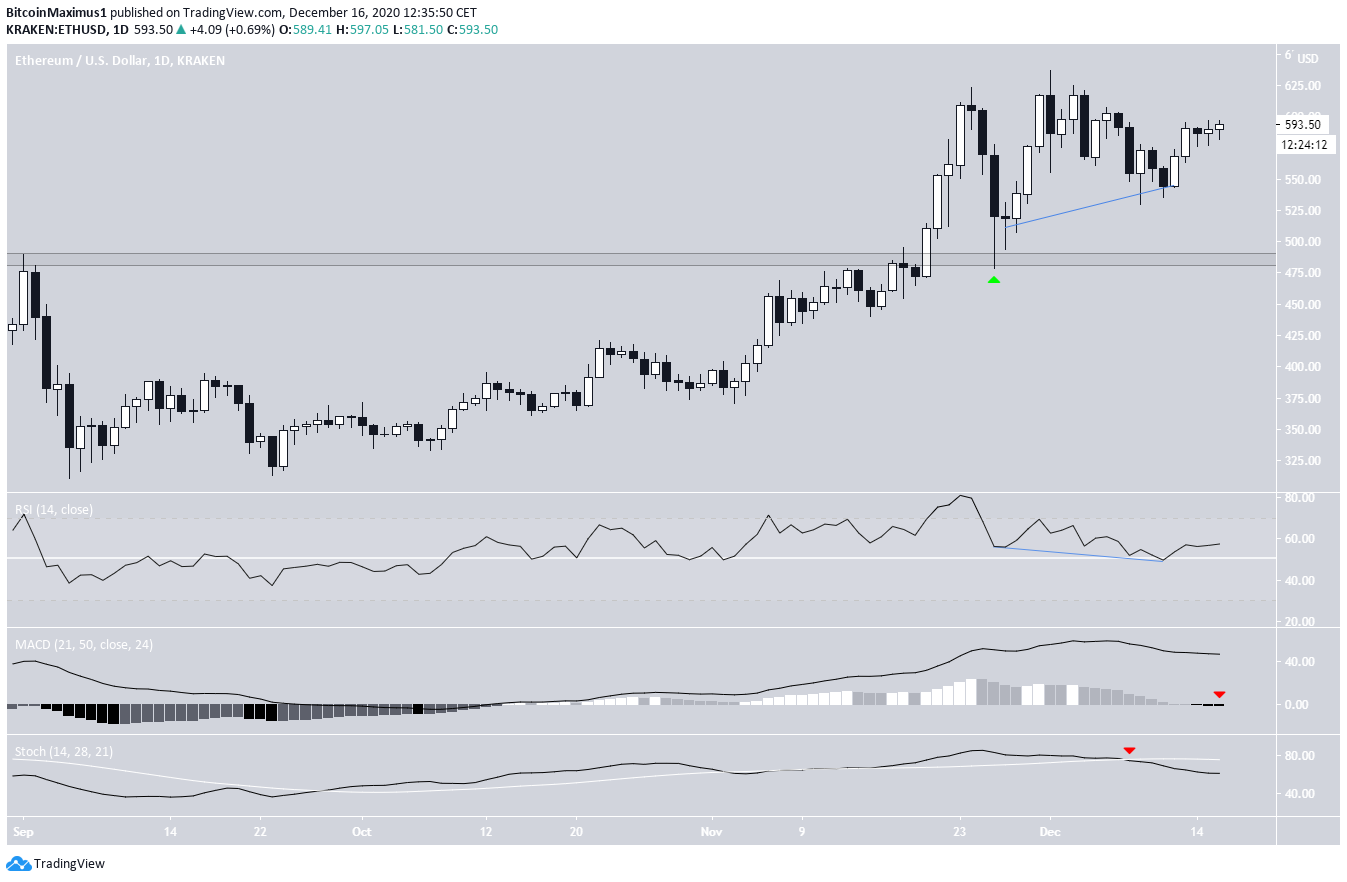
The daily chart gives us our first support area at $480, which has been validated once in the form of a long lower wick on Nov. 26. Since then, ETH has been moving upwards.
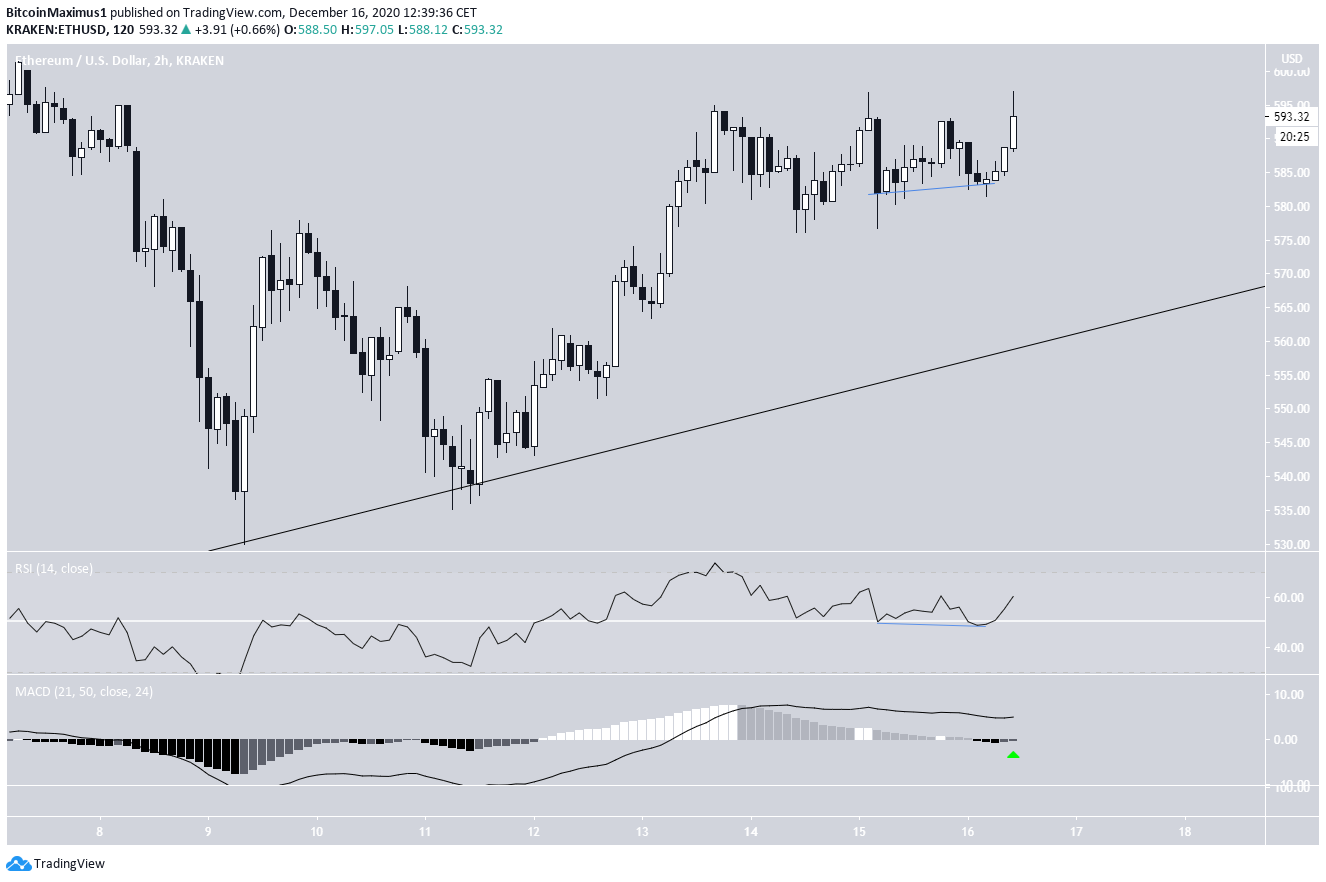
Technical indicators continue with conflicting signs. The RSI has generated a considerable hidden bullish divergence and is above 50. However, both the MACD and Stochastic oscillator are decreasing and the latter has just made a bearish cross.
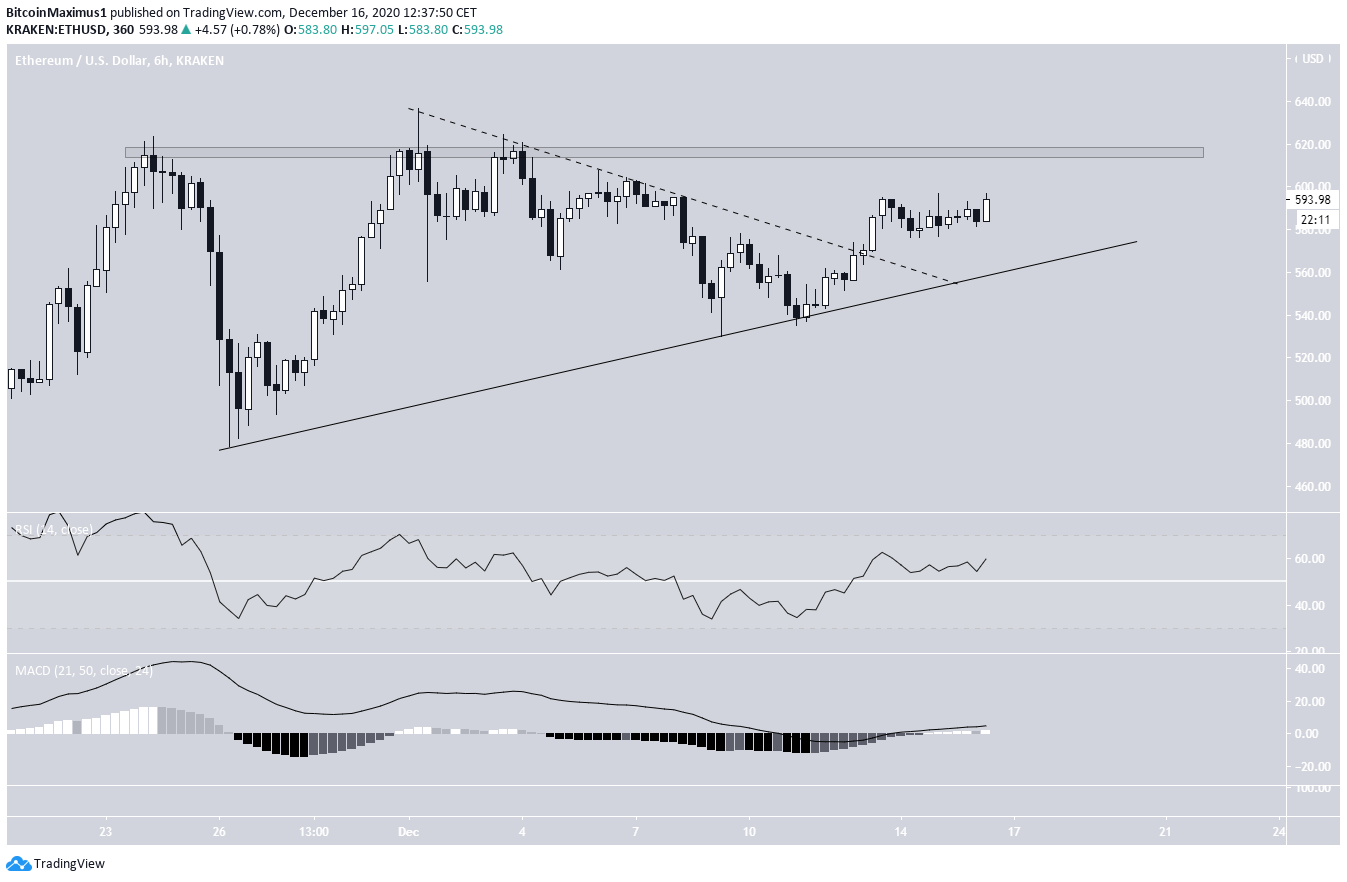
The six-hour chart shows that ETH has been following an ascending support line since the aforementioned low on Nov. 26. It has also broken out from a descending resistance line after (dashed).
The first minor resistance area is found at $620, and technical indicators support the possibility that ETH will reach it.
The two-hour chart further solidifies this belief, showing a growing hidden bullish divergence in the RSI.
Therefore, while ETH is expected to reach $620, we cannot yet determine if it will break out.
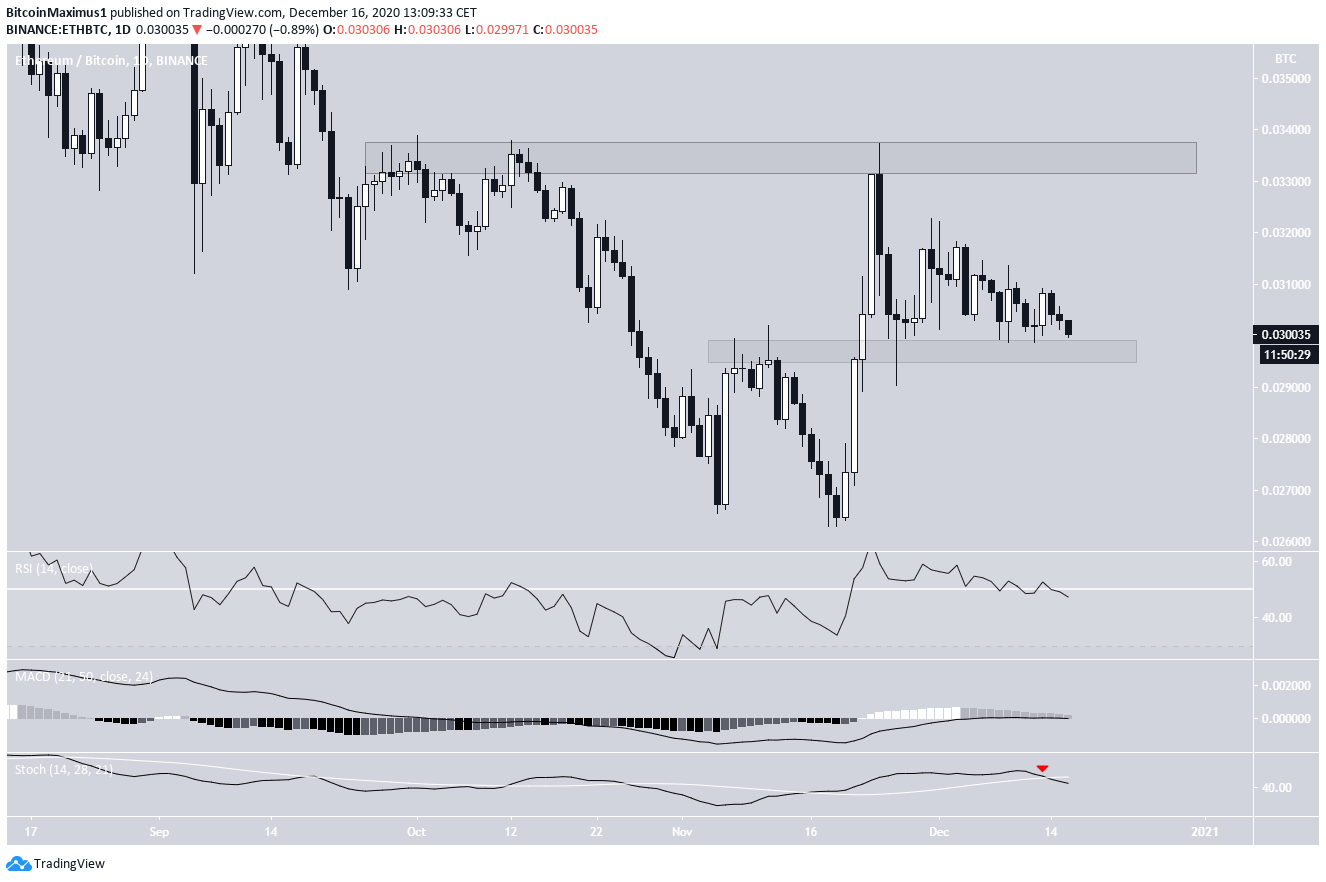
ETH/BTC
The ETH/BTC pair initiated a significant upward movement on Nov. 18 and reached a high of ₿0.033 just a few days later. However, ETH has been decreasing since and is currently trading just above the support area at ₿0.0297.
Technical indicators do not give a clear direction for the trend but are leaning slightly bearish.
However, since the price action suggests that this is a resistance turned to support, ETH is expected to increase as long as it does not reach a daily close below ₿0.0297.
Conclusion
The ETH/USD pair is expected to continue increasing towards $620, but the probability of a breakout cannot be determined at the current time.
Similarly, while the ETH/BTC pair is considered bullish as long as it is trading above ₿0.0297, the direction of the long-term trend cannot be determined.
For BeInCrypto’s latest Bitcoin (BTC) analysis, click here!
Disclaimer: Cryptocurrency trading carries a high level of risk and may not be suitable for all investors. The views expressed in this article do not reflect those of BeInCrypto.


