The Ethereum Classic (ETC) price is currently making its third attempt at breaking out above a minor resistance level.
Long-term indicators are bullish, suggesting that the price will eventually be successful in breaking out. However, a short-term retracement is likely needed before any further upward movement can continue.
Long-Term Support And Resistance
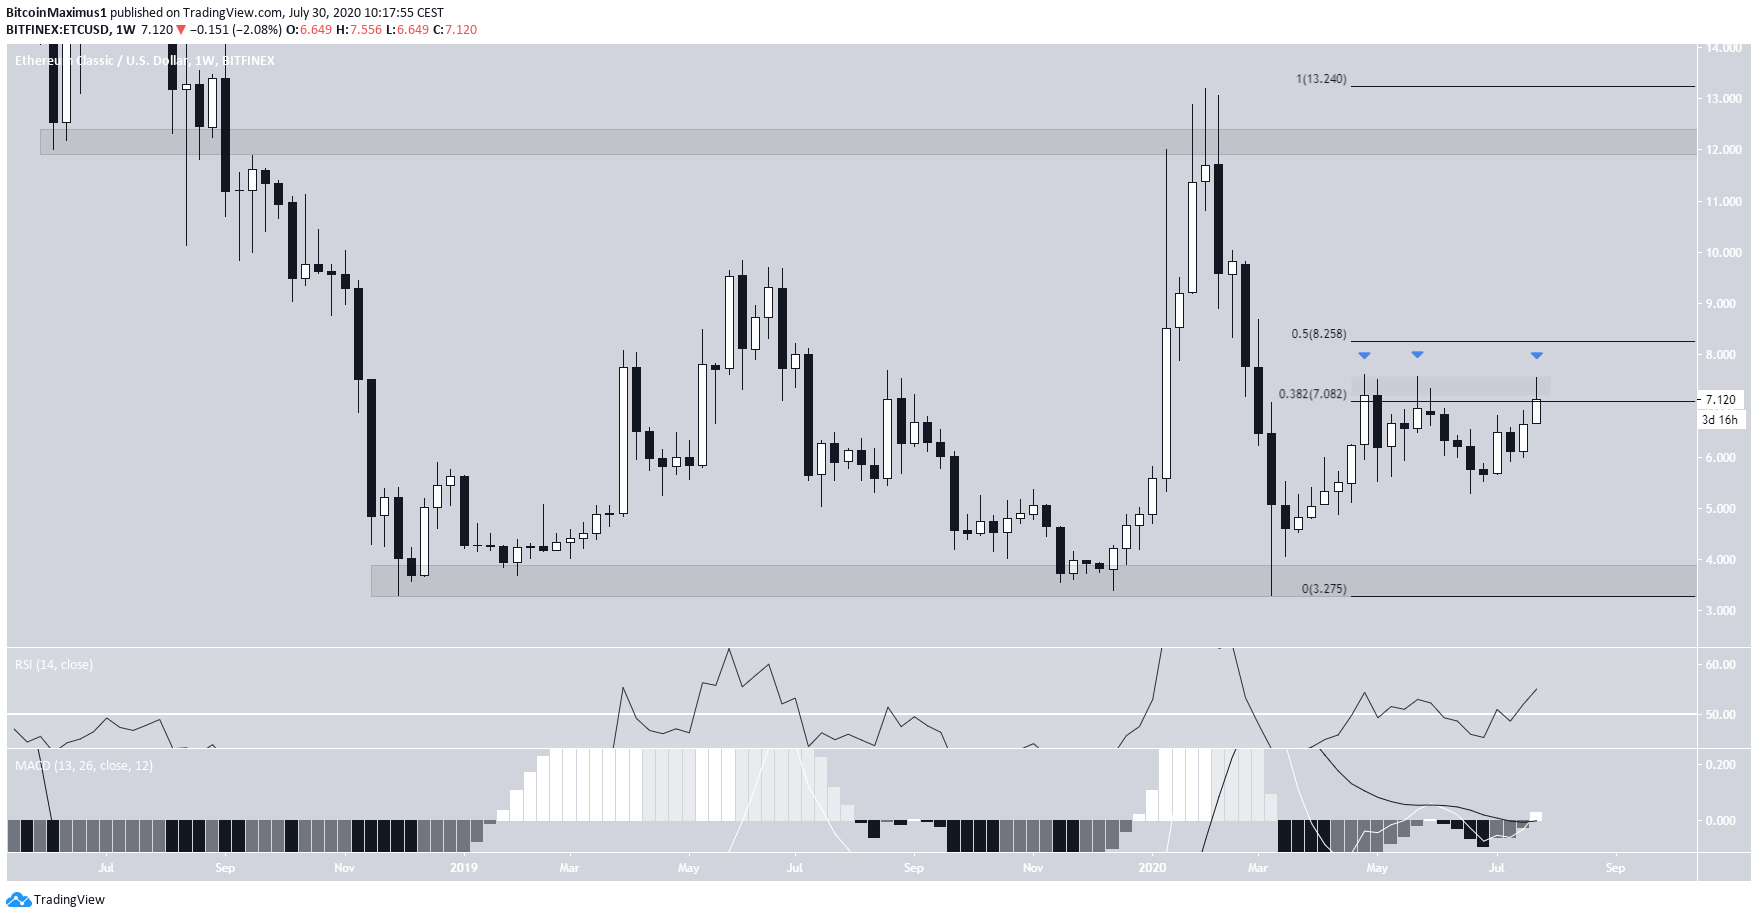
The weekly chart for ETC shows a trading range between $3.30 and $12, inside of which the price has been trading since October 2018.
The price reached the resistance area of this range in February 2020, and began a rapid downward move, culminating in a low of $3.30 the next month. ETC has been mostly increasing since.
Currently, the price is making a third attempt at breaking out above the 0.382 Fib level of the entire decrease.
The previous two attempts were unsuccessful, leaving long upper-wicks in their wake. If successful in breaking out, the next resistance area would be found at $8.25, the 0.5 Fib level of the entire decrease.
Technical indicators suggest that an increase is likely. The weekly RSI has crossed above 50 and is moving upwards. The weekly MACD is also increasing, having made a bullish cross.
Therefore, the long-term trend is bullish.
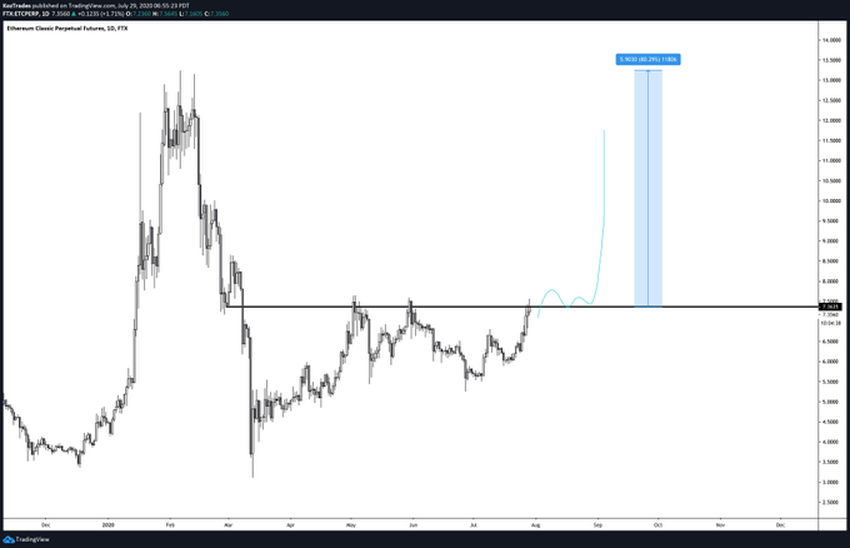
Cryptocurrency trader @TraderKoz stated that we should pay attention to Ethereum Classic since it is in the process of breaking out. Indeed, the aforementioned resistance area is the 0.382 Fib level outlined in the previous section, while the target is the range high at $12.
Doji Warns Of Potential Downside
The daily chart for ETC shows that once the price reached the aforementioned resistance area, it created a Doji candlestick, which is considered a bearish sign when coming after an upward move.
In addition, the Doji coincided with the resistance line of a parallel channel drawn connecting the most recent lows and highs. The decreasing momentum in the daily MACD also warns of a forthcoming decrease.
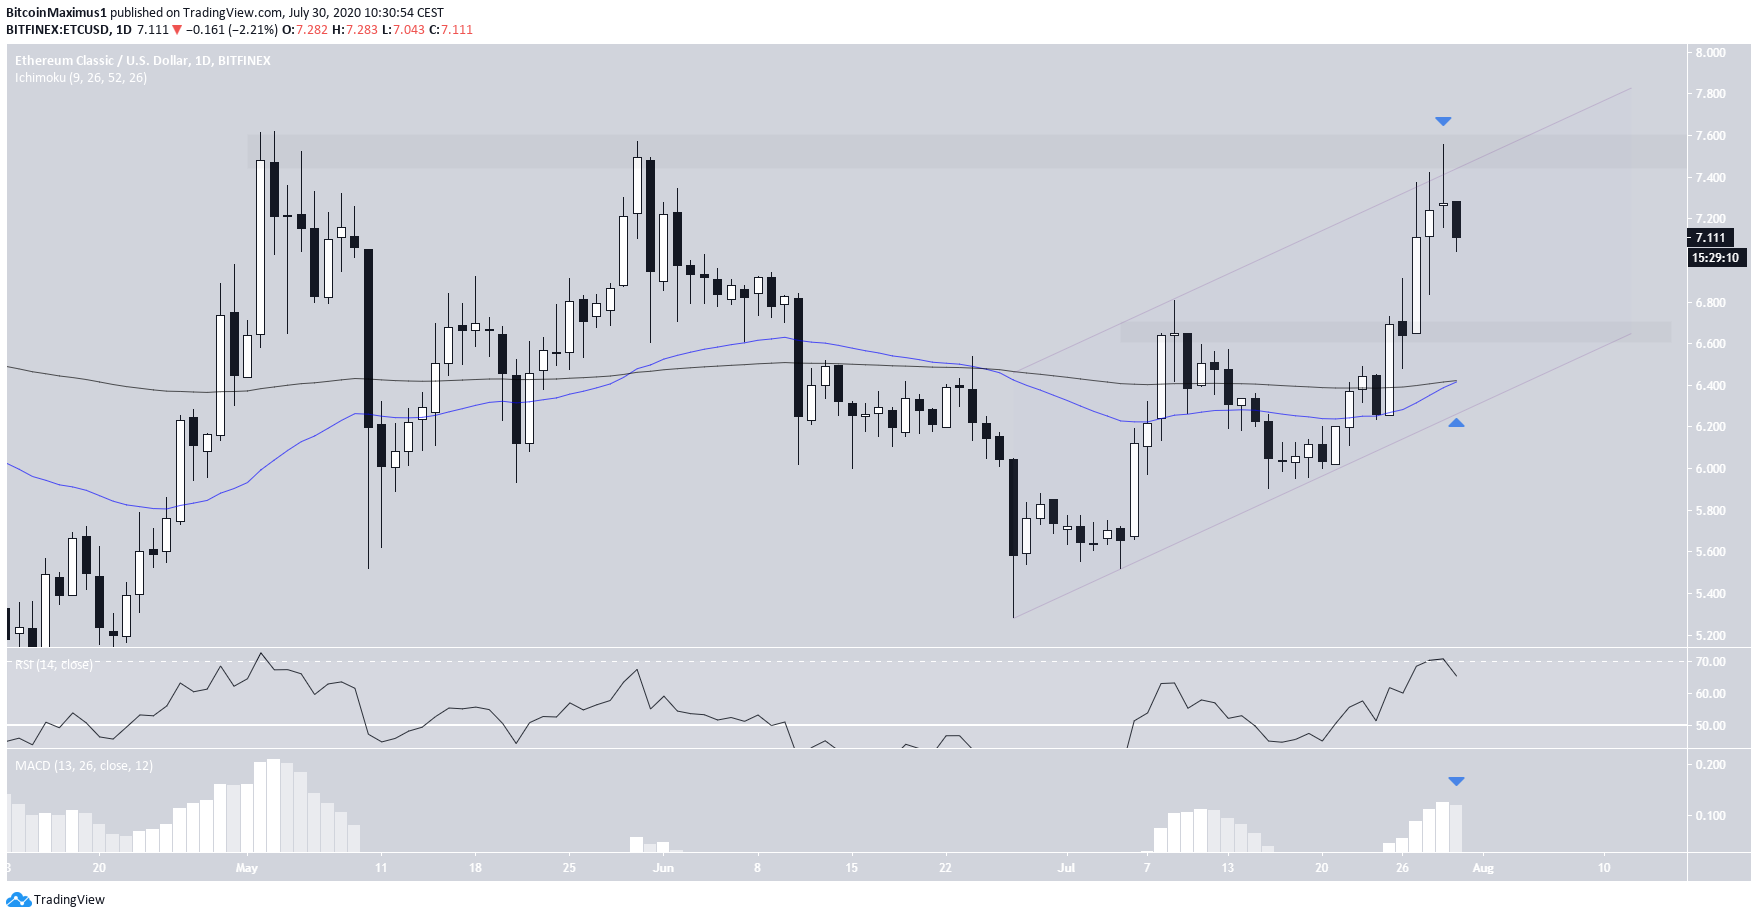
The closest minor support level is found near $6.65, coinciding with an impending bullish cross between the 50 and 200-day moving averages (MA) and ascending support line of the channel.
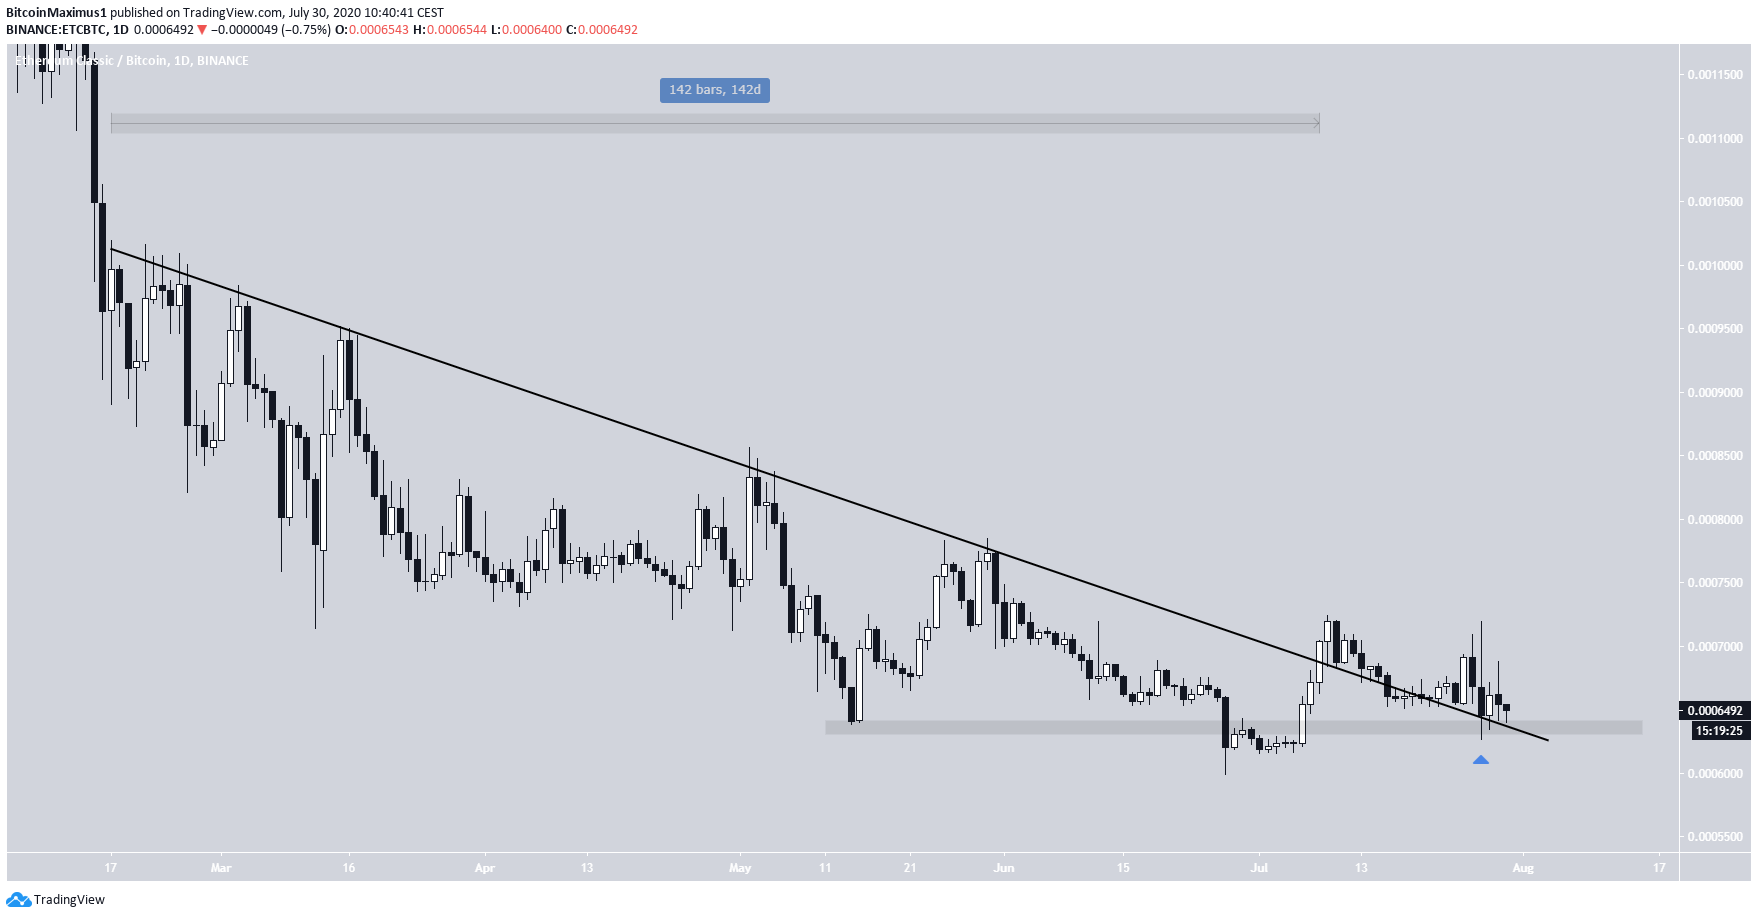
ETC/BTC
On July 9, the ETC/BTC price broke out from a descending resistance line that had been in place for 148 days and has currently validated it as support. This is a sign that a long corrective period has ended and ETC could continue moving higher.
In addition, the price has fallen back to the 63,500 satoshi support area, validating it once more.
If the price continues increasing, the closest resistance area would be found at 75,000 satoshis.