


Between May 20 an 25, both Ethereum (ETH) and Google’s parent company Alphabet, Inc. (GOOGL) suffered weekly losses. In this article, we examine the price fluctuations of both during this period. We then compare the two assets to determine which is this week’s biggest loser.
Much of the information presented on GOOGL is the same as that presented in our earlier Bitcoin (BTC) vs. GOOGL analysis. Furthermore, much of the information about Ethereum’s current trading pattern is discussed in our May 25 ETH vs. gold and ETH vs. silver analyses. Thus, to broaden our original analysis, we focus more heavily on the similarities and differences between ETH and GOOGL here. BTC is mentioned as relevant.
Alphabet, Inc.
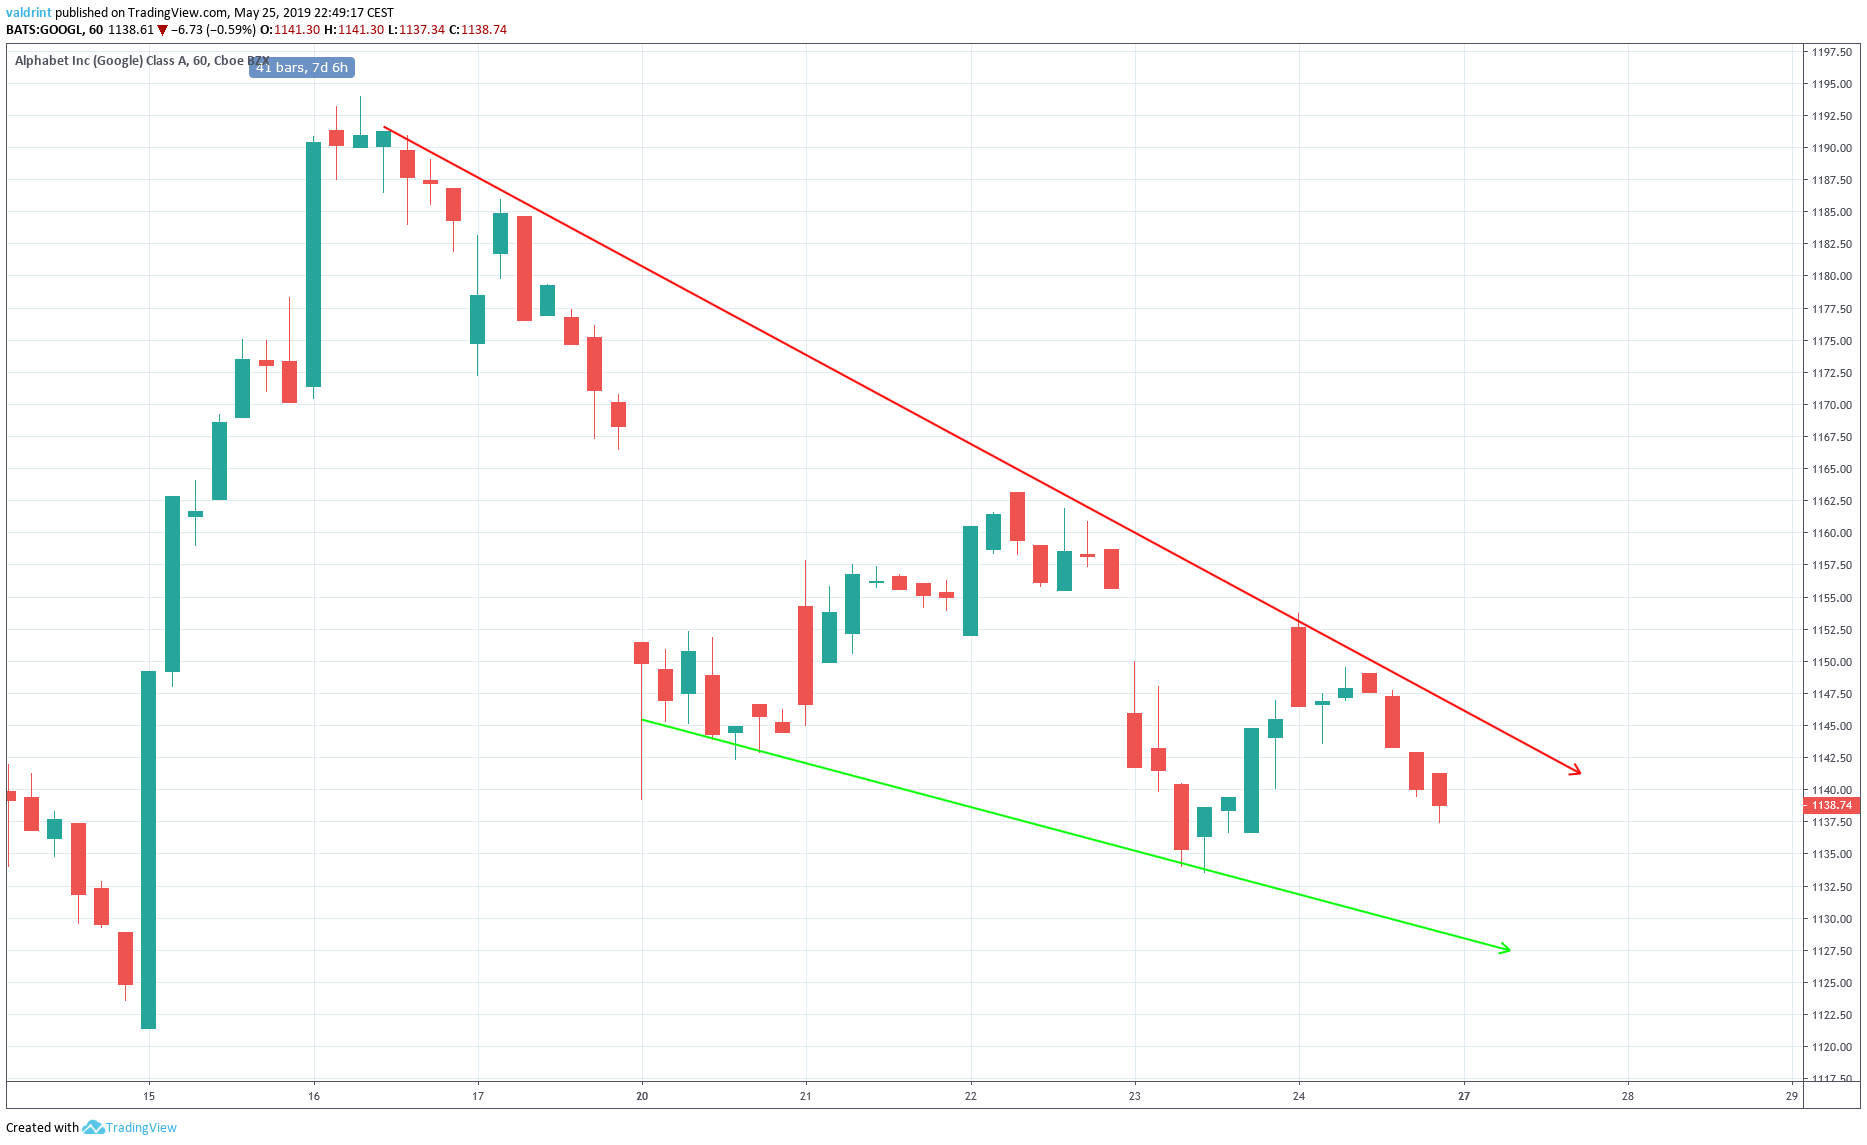
Since May 20, Alphabet Inc (GOOGL) has been trading within a descending wedge. However, it initiated a downward trend four days prior after a high of $1193.98 was reached.
Since that time, the price has been trading beneath a descending resistance line. It has been validated several times on May 16, 17, 23, and 24. The descending support line which completes the wedge formed on May 20 when low of $1139.16 was reached.
Ethereum In a Channel
While GOOGL’s trading current trading pattern fully emerged on May 20, Ethereum has been trading within a horizontal channel since May 17. On that day, an hourly high of $261.77 on May 17 generated a horizontal resistance line a support line was generated by an hourly low of $227.20.
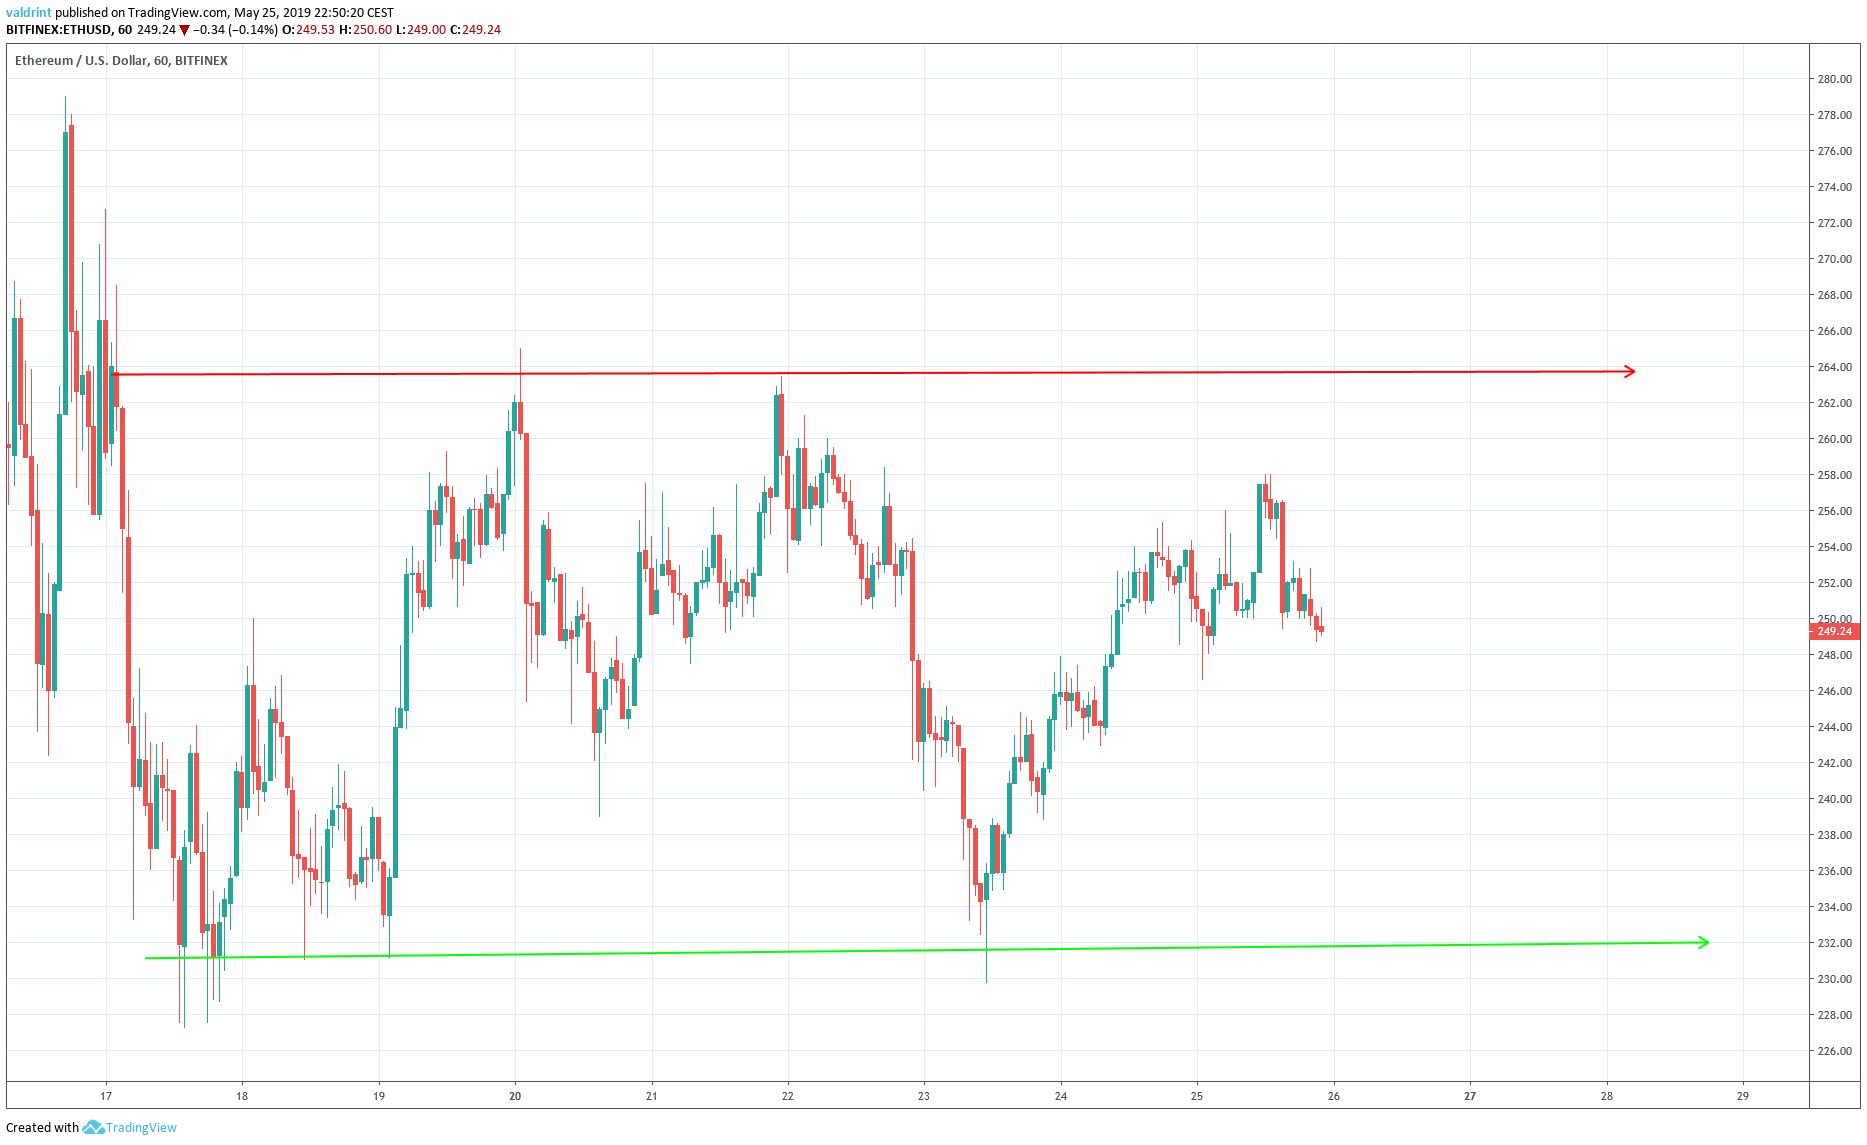
After ETH first fell from the resistance line on May 17, it traded near the support line for several day. It was not until May 19 that price pushed upward to reach the resistance line. After it was reached on May 20, the price dropped ot the middle of the channel.
It rebounded and reached the resistance line again on May 21. This generated a double top pattern which preceded a drop back to the support line on May 23.
The price has subsequently risen. However, at the time of writing on May 26, ETH had yet to reach the resistance line. On the contrary, slight hourly drops had been observed.
Ethereum vs. Google
The price of Ethereum (candlesticks) and the price of GOOGL (orange line) are compared at one-hour intervals from May 20 to May 25 in the graph below. Percentile changes are shown on the right.
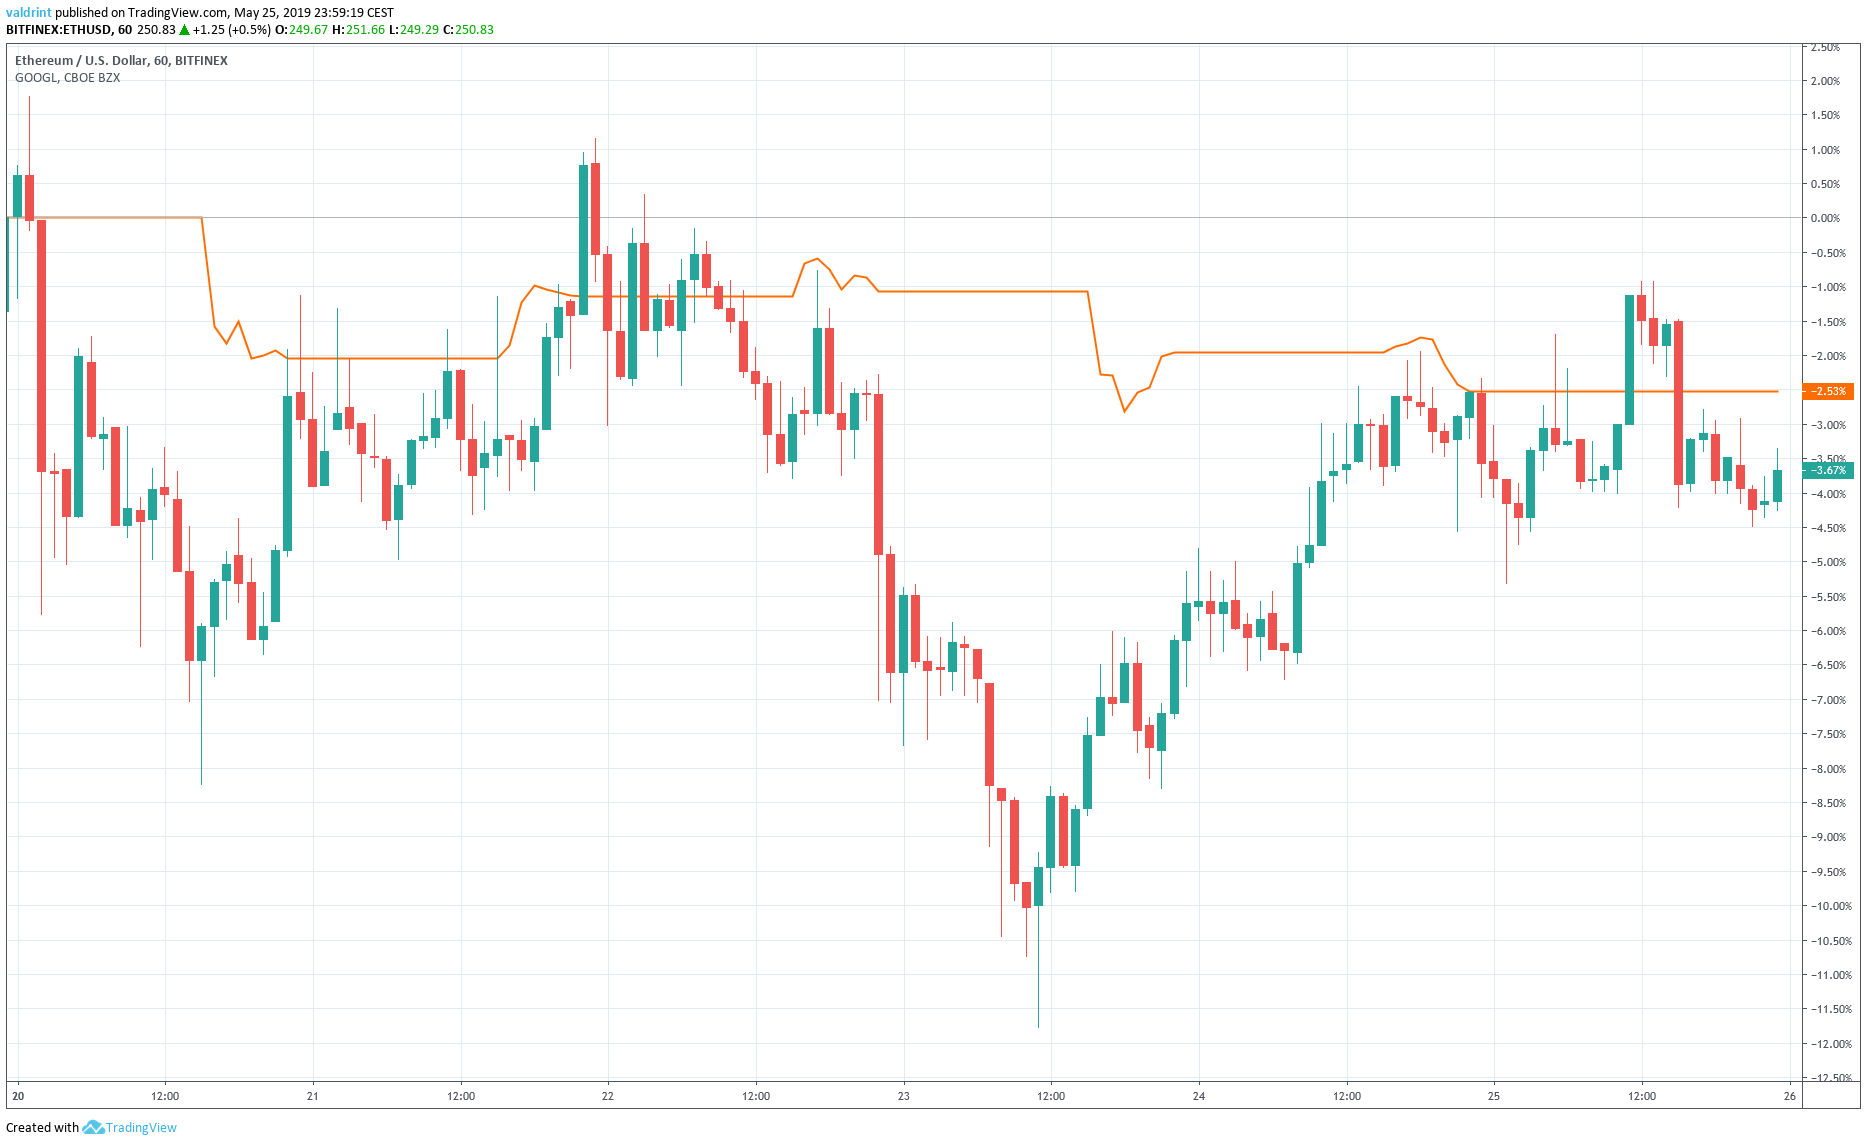
Between May 20 and 25, ETH experienced much greater volatility than GOOGLE. This is to be expected. Cryptocurrencies tend to be a more volatile asset class than traditional stocks.
Overall, ETH experienced loss of 3.67% during the last week. It worth noting that Bitcoin also saw losses, but they were much less significant (around 0.6%).
GOOGL also suffered losses, but they were less significant. Overall, GOOGL saw losses of 2.53% between May 20 and 25. These losses, were, however greater than Bitcoin’s.
In short, for the week of May 20-25, both Ethereum and GOOGL dropped in price. Ethereum’s losses were overall more significant than ETH. Both performed more poorly than BTC.
Which of the two assets do you believe will increase the most during next week? Let us know in the comments below:
Disclaimer: This article is not trading advice and should not be construed as such. Always consult a trained financial professional before investing in cryptocurrencies, as the market is particularly volatile.
[Image credits: Trading view, Shutterstock]


