


Ethereum is at an important phase for its future development, as it is preparing for the release of Ethereum 2.0, a proposed hard fork. However, the overwhelming majority of its users disagree with the idea of implementing a hard fork after the hack with the goal of reverting chain activity.
Nevertheless, the Ethereum price has been steadily increasing throughout October and November. Similarly, the price of Bitcoin enjoyed a rapid increase on October 25, creating a breakaway gap in the CME futures chart. Tuesday, the gap was filled, possibly suggesting that another upward move is in store.
Cryptocurrency trader @cryptopicasso stated that there are several similarities between the current ETH and the 2011-2013 BTC price movement.
The more I look at $ETH
I see early $BTC structure 🤔#cryptocurrency pic.twitter.com/WBQpIpATX0— Picasso (@cryptopicasso) November 5, 2019
If the BTC pattern continues to be a valid predictor of the ETH price, we will soon see a new all-time high in the price of the latter.
Let’s take a closer look at both prices and analyze the similarities.
Wave Similarities
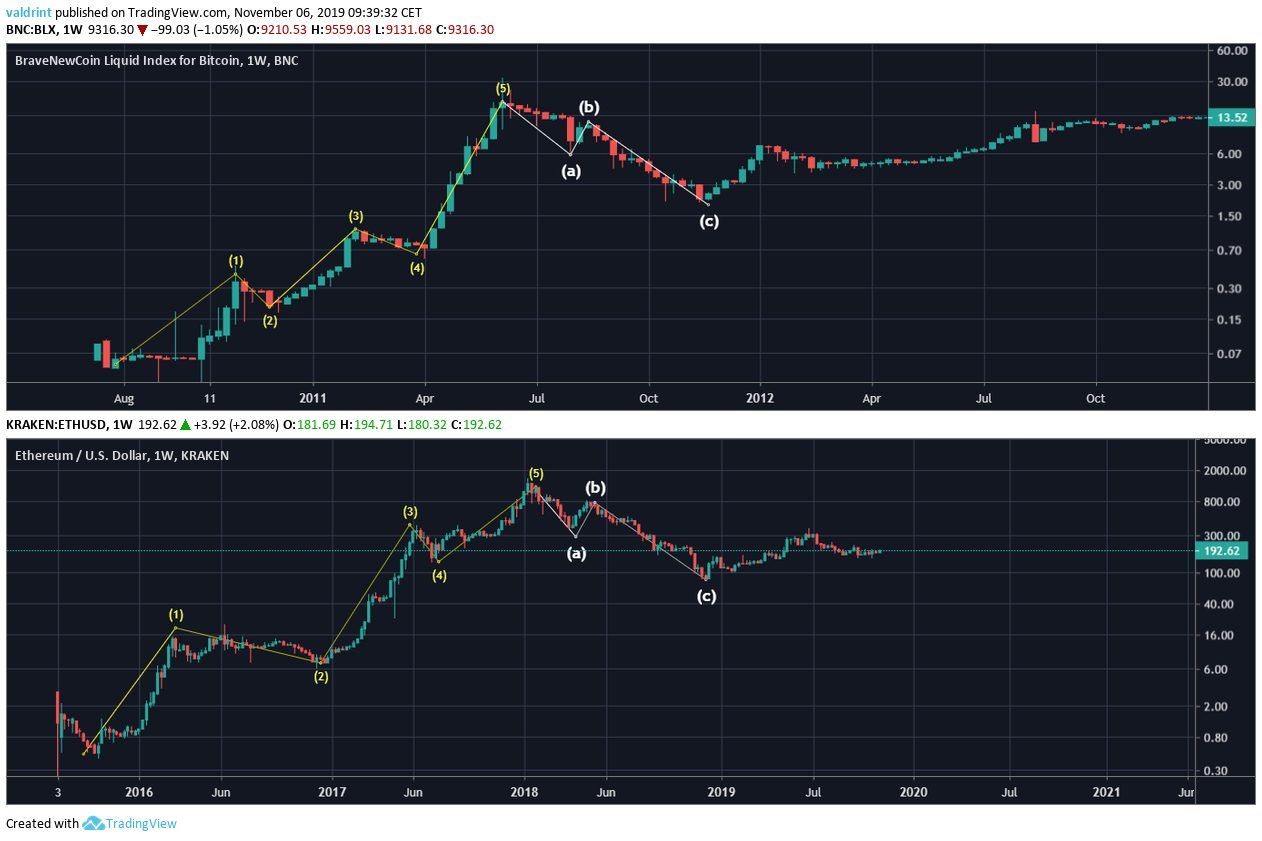
The biggest similarity comes from the almost identical wave count.
Beginning in 2010, the Bitcoin price began an upward trend that ended with a high of $31 in June 2011.
Afterward, it finished an A-B-C correction with a low of $2.01 in November 2011.
On the other hand, Ethereum began an upward move in 2015 which ended with a high of $1594 in January 2018.
Afterward, it finished an A-B-C correction with a low of $80 in December 2018.
Technical Indicators
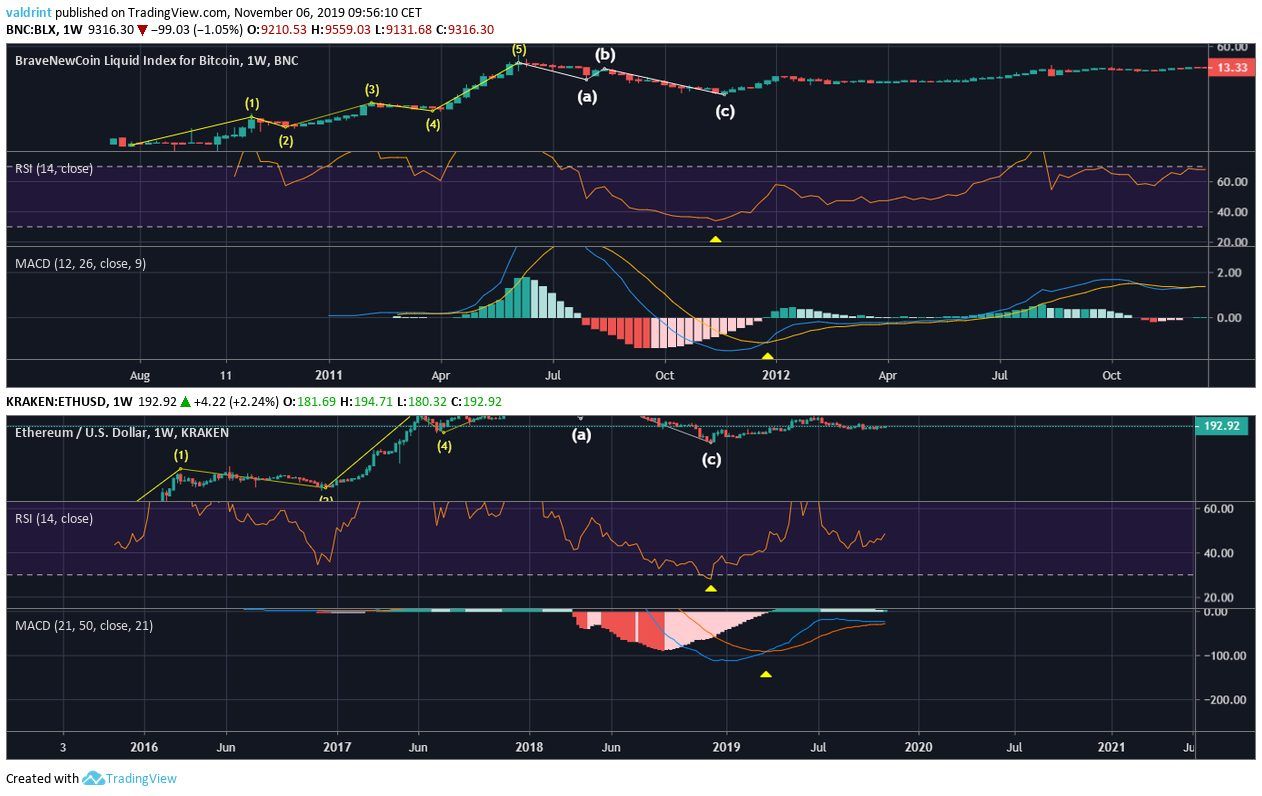
Another similarity comes from the RSI and the MACD.
In both cases, the end of the C wave was combined with an oversold value in the RSI. Afterward, a bullish cross in the weekly MACD transpired.
This suggests that both coins were at similar points in their cycle during their respective lows.
Future Movement
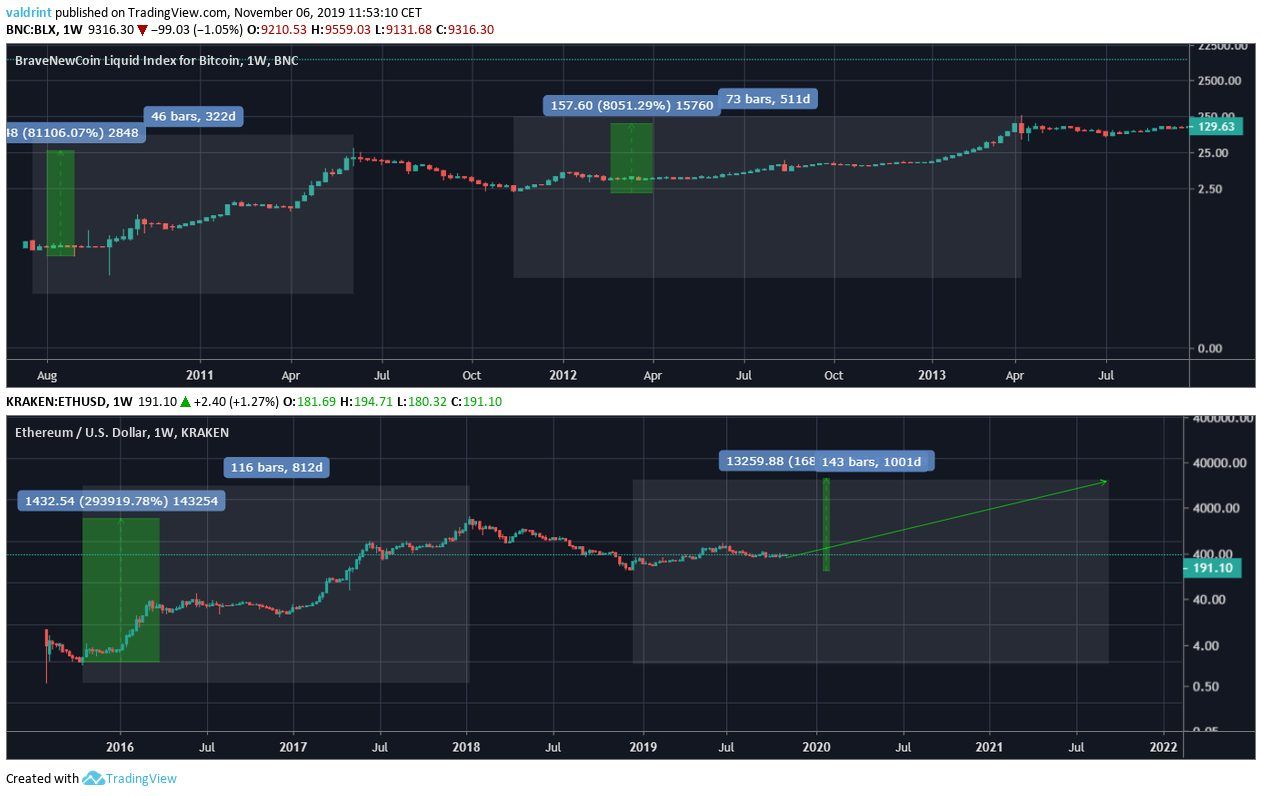
Looking at both movements, we can see that they had different magnitudes and spanned along different time-periods.
BTC increased by roughly 80,000% in 322 days. On the other hand, ETH increased by 300,000% in 812 days.
However, the corrections had the exact same rate of decrease, at 94%.
Making the assumption that ETH moves at twice the magnitude but takes twice longer to develop than BTC, we arrive at a price of $16,000 in September 2021.
However, this is conditional on Ethereum following the pattern laid out by Bitcoin.
Disclaimer: This article is not trading advice and should not be construed as such. Always consult a trained financial professional before investing in cryptocurrencies, as the market is particularly volatile.
Did you know you can trade sign-up to trade Bitcoin and many leading altcoins with a multiplier of up to 100x on a safe and secure exchange with the lowest fees — with only an email address? Well, now you do! Click here to get started on StormGain!


