
Leading altcoin Ethereum is showing signs of underperformance against Bitcoin (BTC) as its relative strength with the leading digital asset has weakened over the past few sessions.
Despite BTC reaching new all-time highs yesterday, ETH’s price has struggled to follow, trading sideways over the last four days. Technical indicators point to muted buying interest, raising concerns that the coin could see further downside if momentum fails to pick up.
Ethereum Weakens Against Bitcoin
ETH’s ratio against BTC (ETH/BTC) has been trending lower over the past few days, highlighting that Ethereum is losing ground to Bitcoin in relative performance. At press time, this currently stands at 0.036.
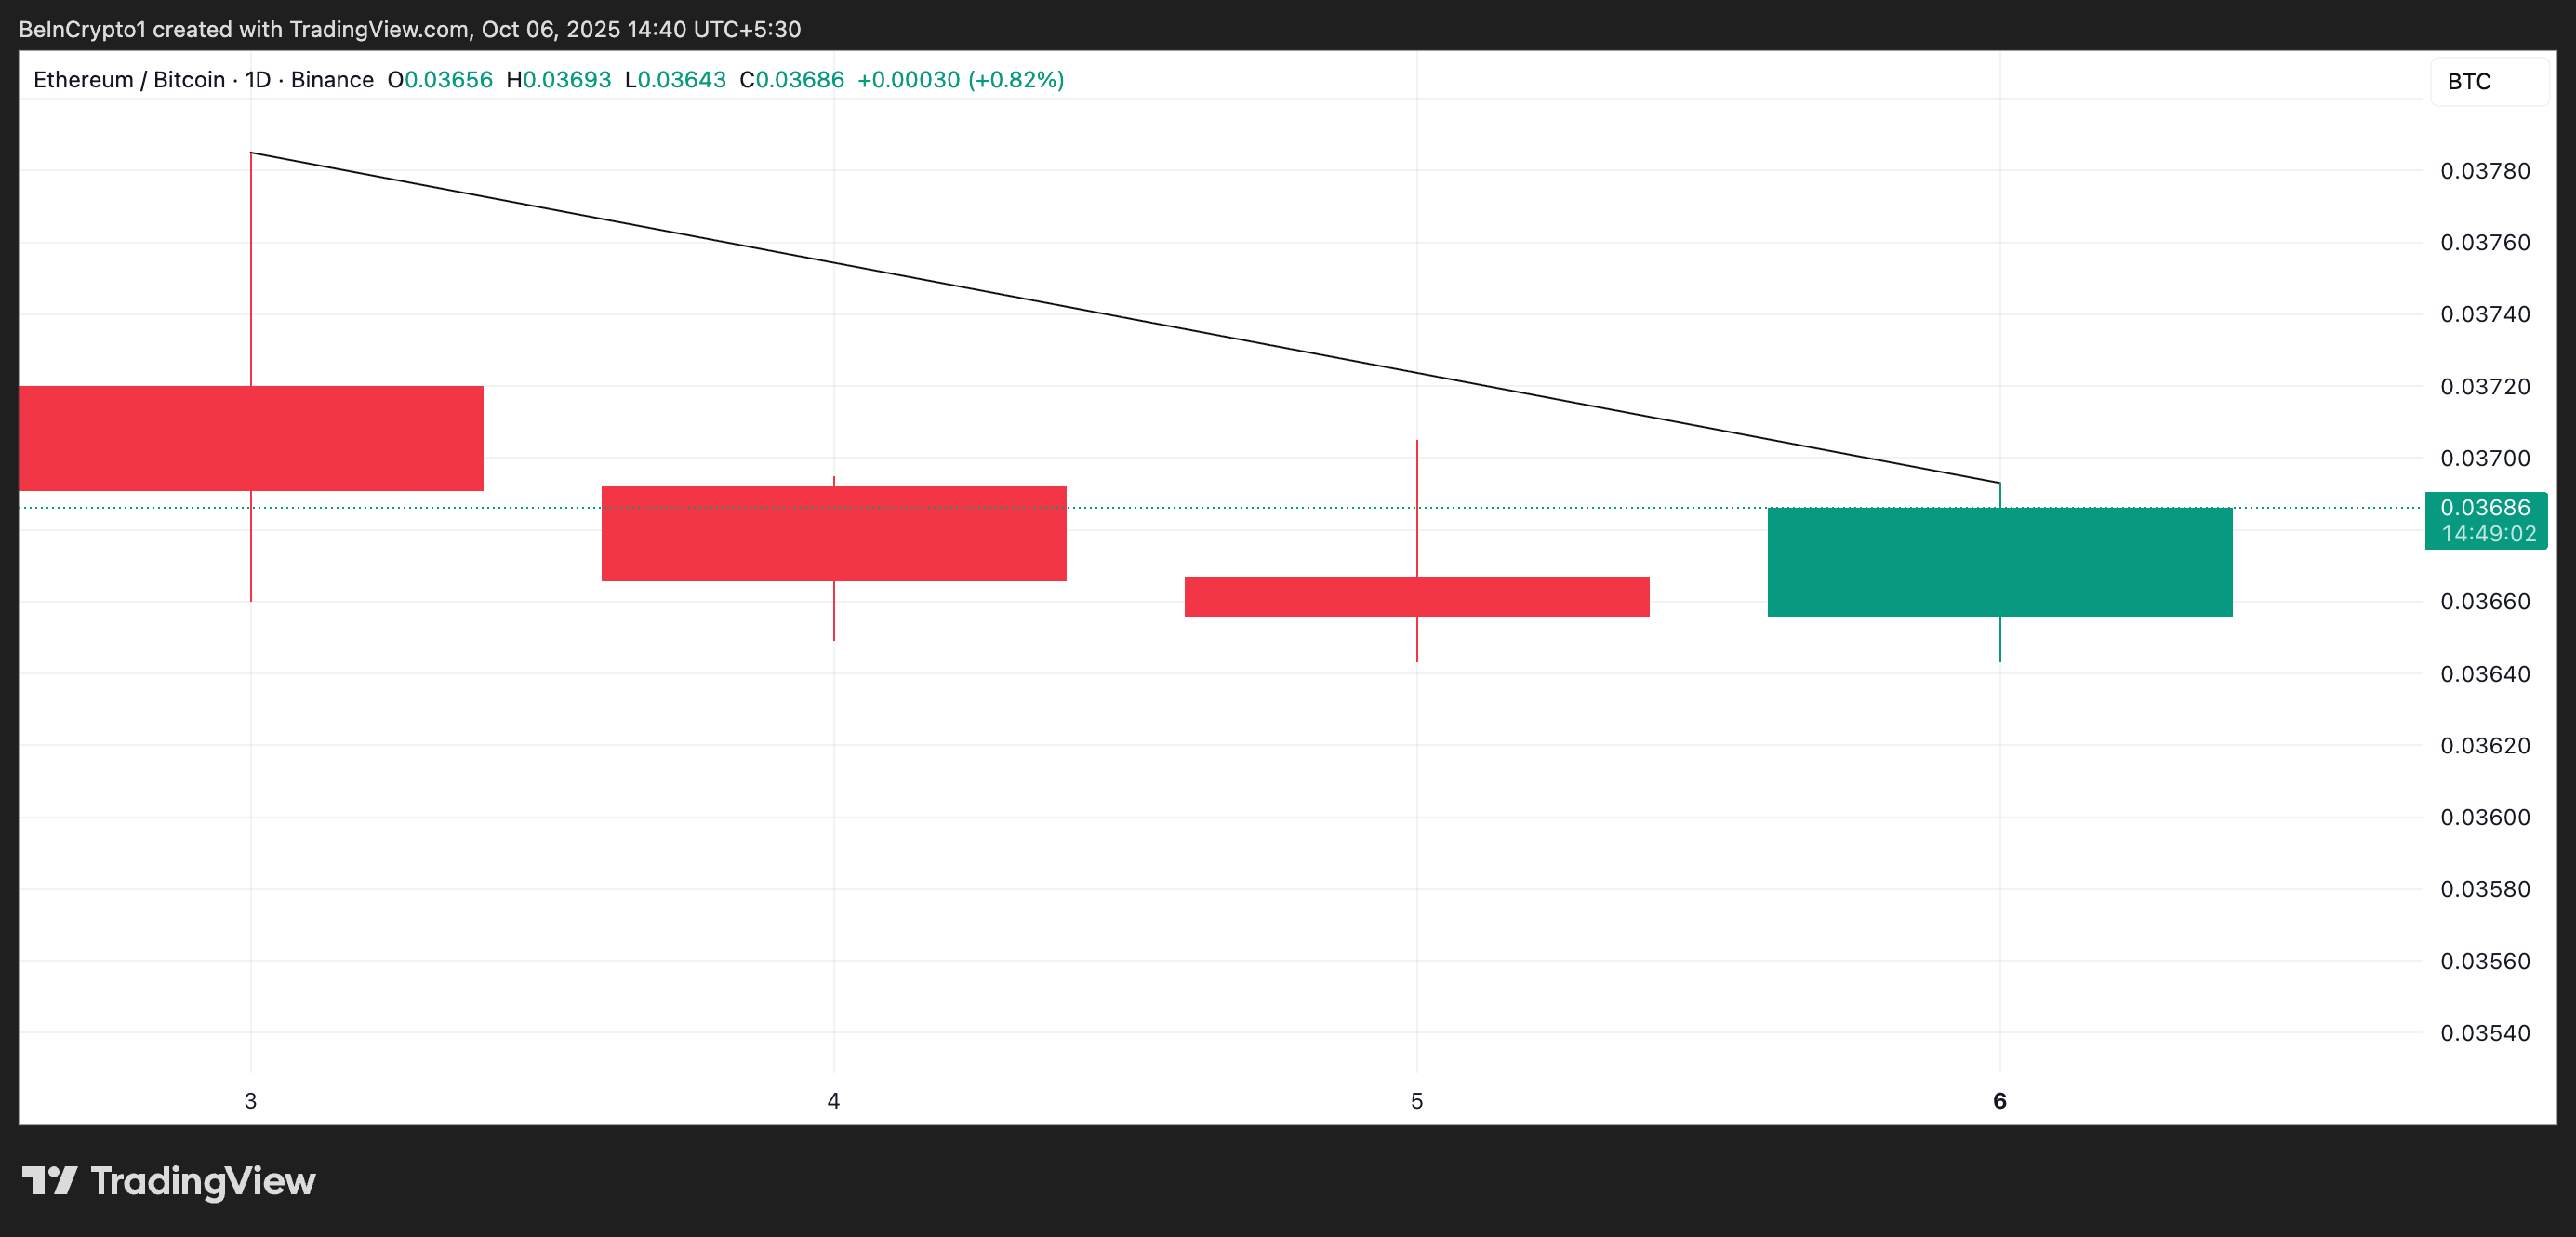
The ETH/BTC ratio measures the relative strength of ETH compared to BTC, showing how much the former is worth in terms of the latter and indicating which asset outperforms the other.
When it falls like this, it signals that ETH is underperforming Bitcoin. As a result, BTC’s recent rally to new all-time highs may not be enough to lift ETH. This leaves the altcoin’s price more vulnerable to sideways or downward pressure over the next few trading sessions.
Moreover, ETH’s Chaikin Money Flow (CMF) on the daily chart has flattened over the past few sessions and has begun trending downward. This signals that capital inflows into ETH have slowed, further delaying the likelihood of a surge toward $5000.
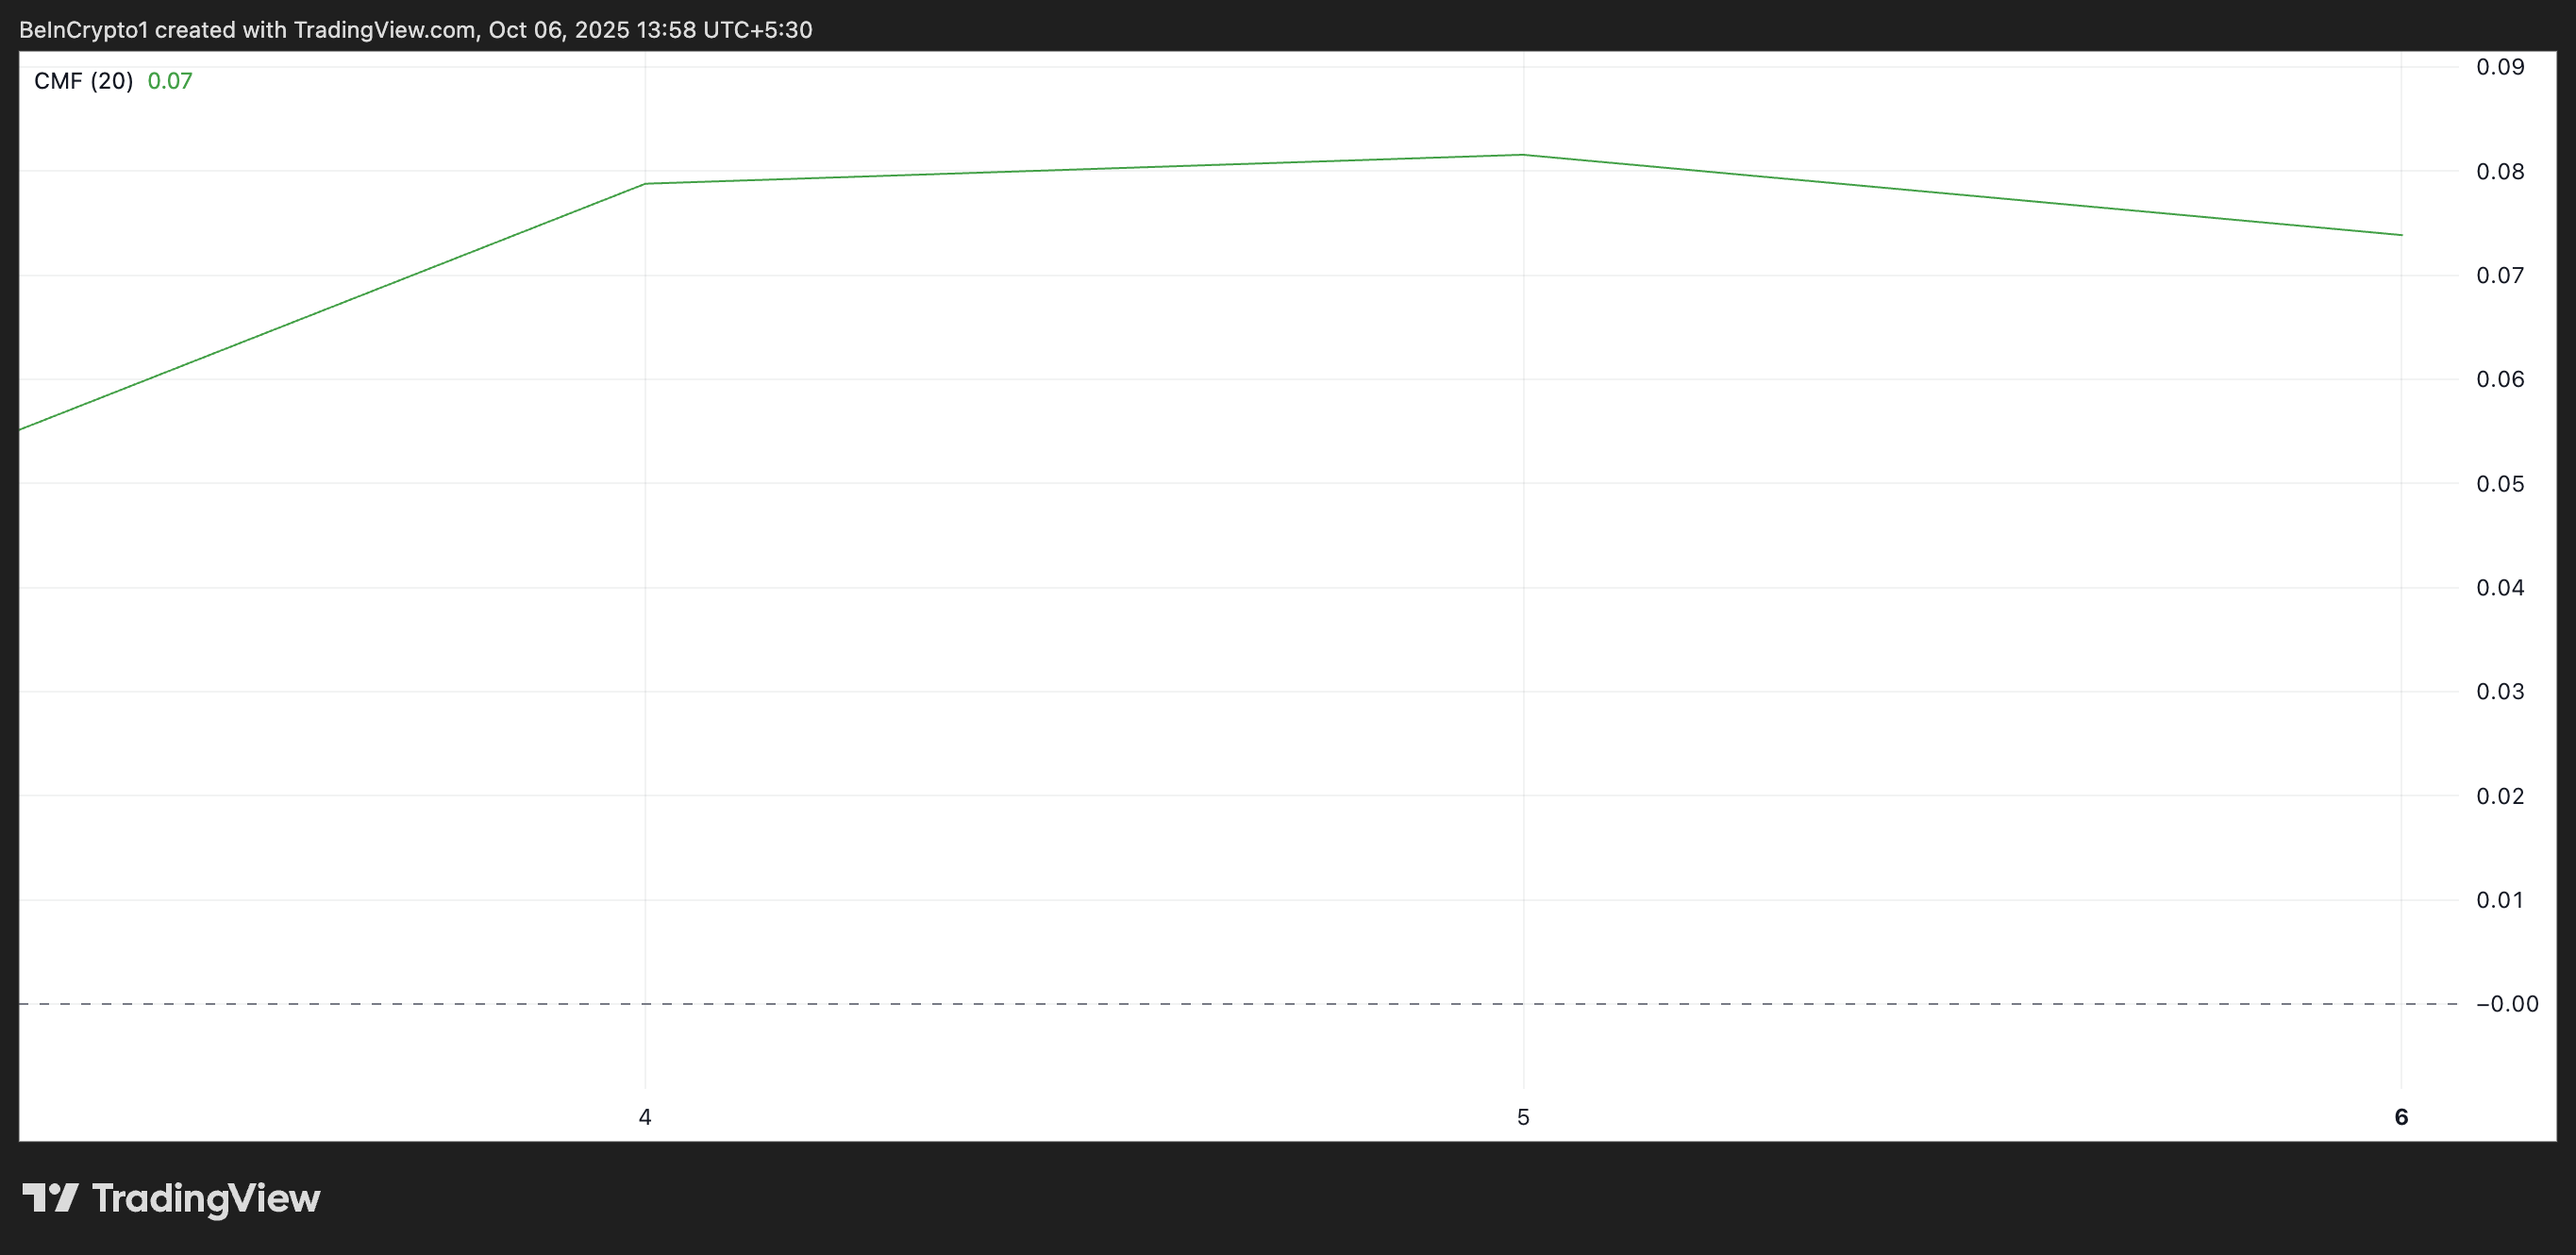
The CMF indicator measures how money flows into and out of an asset. When it flattens, then falls, it signals weakening buying pressure and potential selling momentum. This further confirms that ETH may struggle to gain upward traction even as BTC rallies.
Ethereum Stalls Amid Market Uncertainty: $4,211 or $4,957 Next?
A sideways trend accompanied by a flattening momentum indicator reflects indecision among traders, with neither buyers nor sellers fully in control. If downward pressure strengthens, this could set the stage for a larger correction.
In this scenario, the coin’s price could plummet toward $4,211.
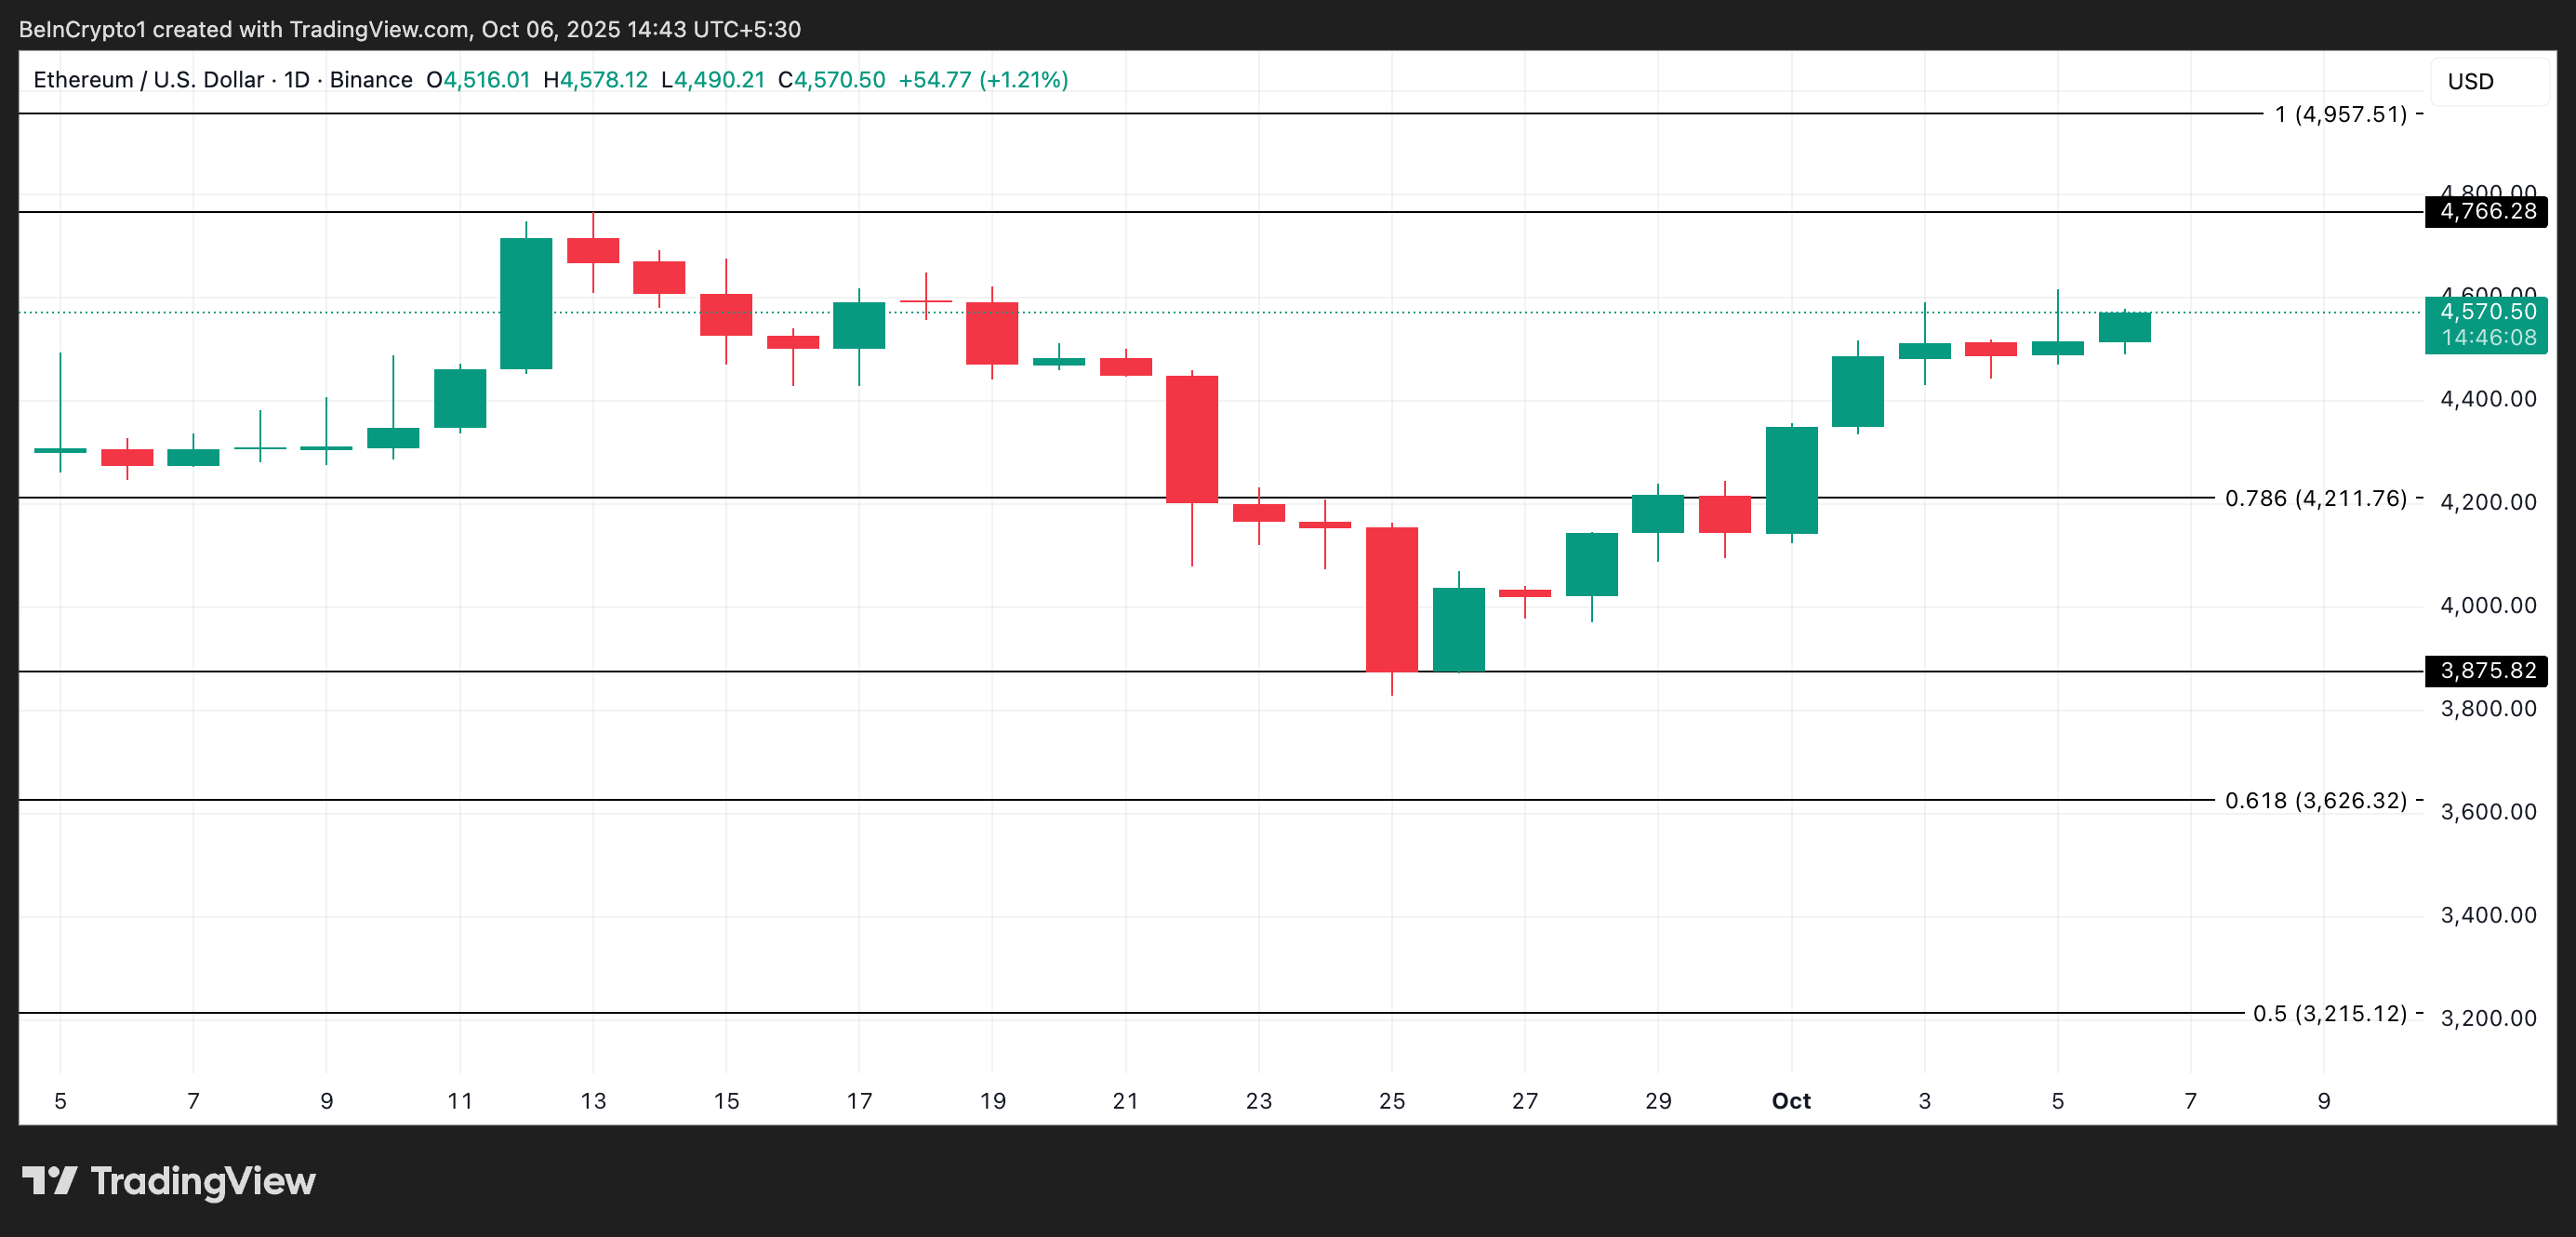
On the other hand, if the bull-side power grows, ETH could attempt a rally toward its all-time high of $4,957, last reached on August 24. But for this to happen, ETH’s price must first breach the immediate resistance at $4,766.
