


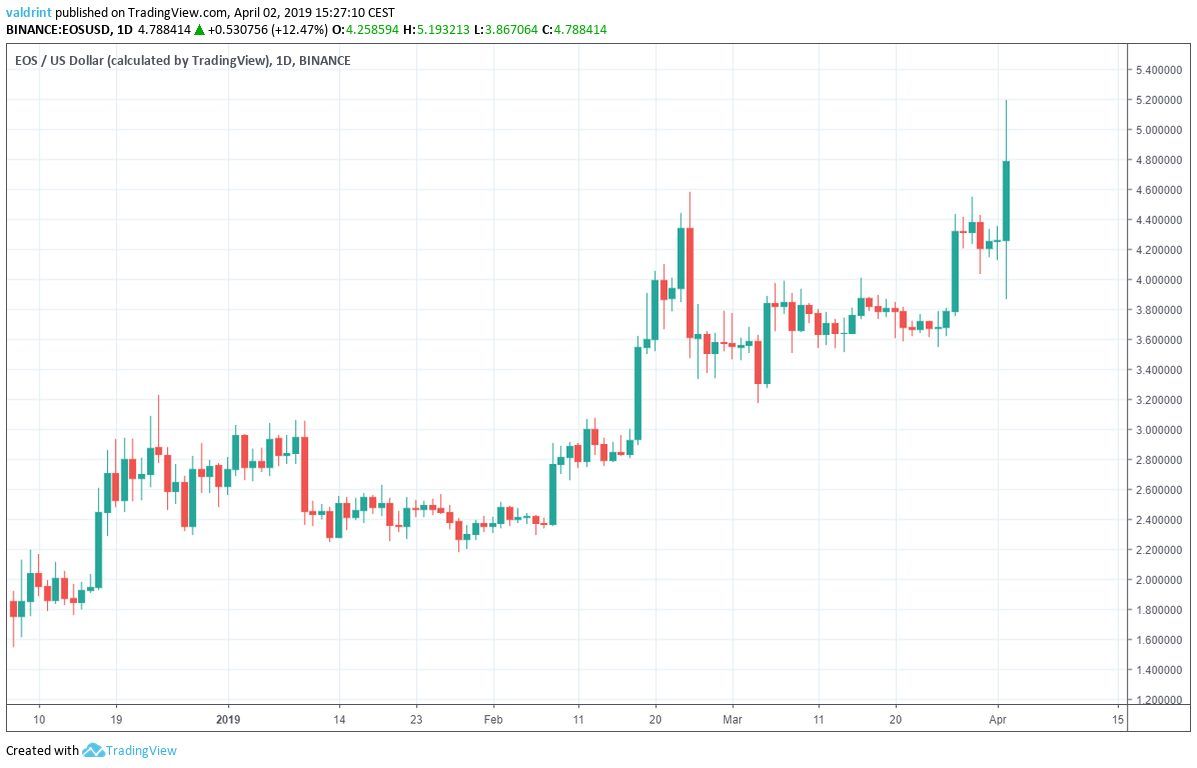
On Dec 7, 2018, the price of EOS (EOS) made a low of $1.54. It has been on a gradual uptrend since. Price increases accelerated on Feb 28, 2019.
They accelerated again on Apr 2. At the time of writing, the highest price recorded for the day was $5.19.
Bitcoin (BTC) also experienced a rapid spike during this period. On Apr 2, it reached highs past $5000.
Many other cryptocurrencies also spiked including Litecoin (LTC), Ethereum (ETH), XRP (XRP), Dogecoin (DOGE), and Stellar lumens (XLM).
(EOS) EOS: Key Trends And Highlights
- The price of EOS/USD began an uptrend on Dec 7.
- EOS has been trading inside an ascending channel since Dec 24
- The rate of increase intensified on Feb 18.
- It is trading above the daily moving averages
- There is significant resistance near $5.
Ascending Channel
On Dec 7, 2018 EOS reached a low of $1.54. A gradual increase ensued.
Tracing the highs gives us an ascending support line—which is represented by green, dashed line in the graph below:
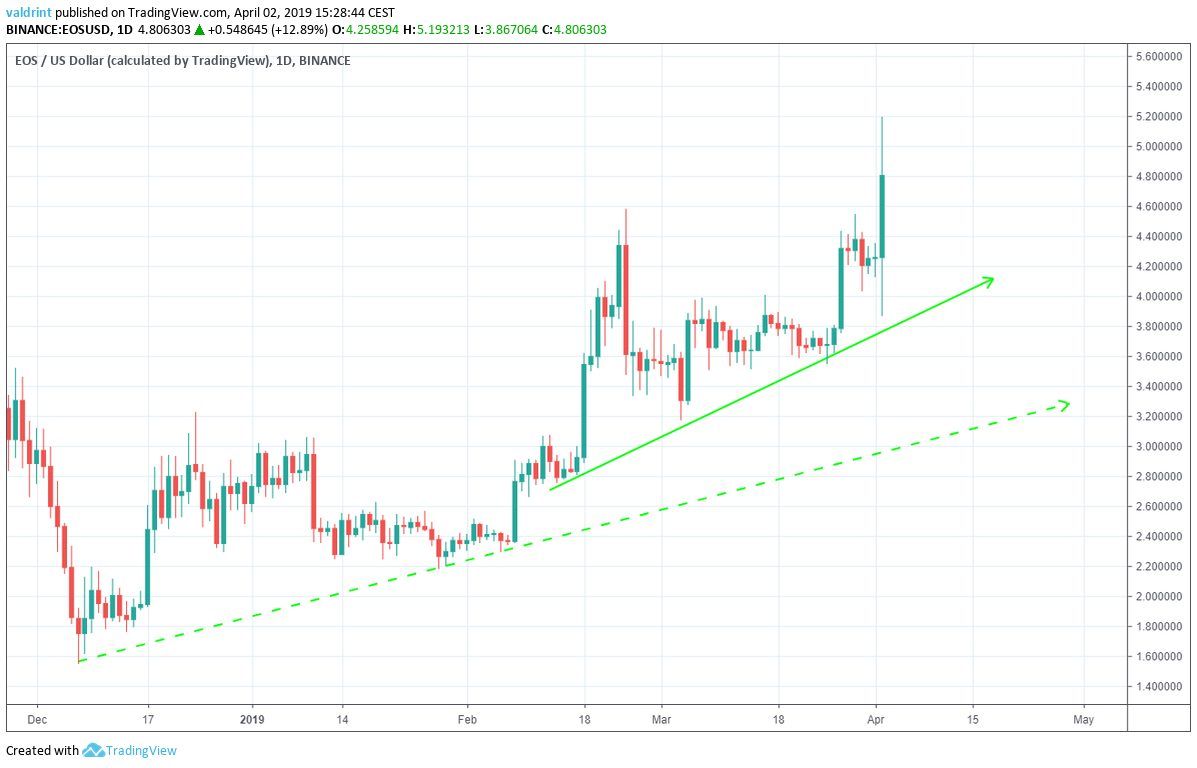
The solid green low represents the current support line. This formed on since Feb 14 after EOS faced a significant price spike. On this date, a low of $2.75 was reached—much higher than previous lows.
Though EOS has experienced more significant spikes since the price has grown at the rate projected by the new support. until It has been making higher lows since. Tracing these lows gives us an ascending support line.
Combined with an ascending resistance line that formed in mid-December 2018, EOS has been trading within an ascending channel:
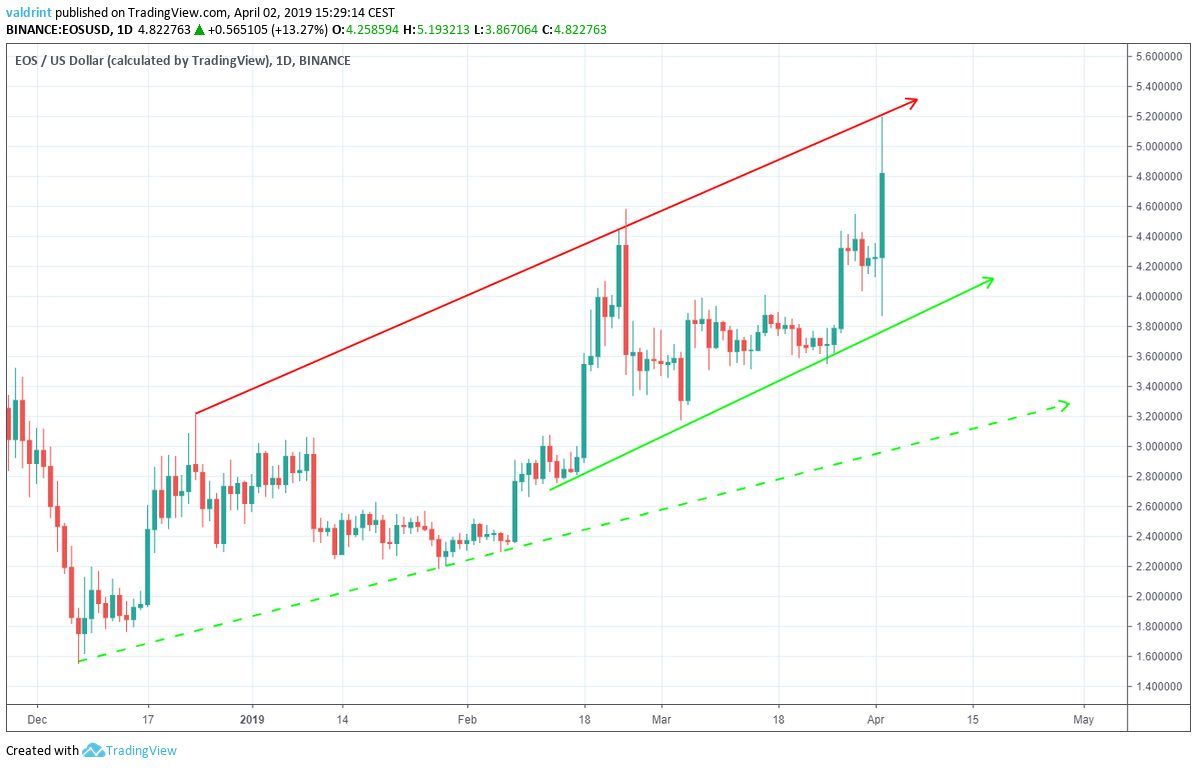
Despite volatility, price has increased within this channel since late 2018. New highs and lows have grown successively larger in the meanwhile.
It currently appears as EOS will continue increasing within this channel throughout April. making price breakouts and breakdowns equally likely.
However, the channel is upward facing, therefore it is likely that the price will keep increasing at the rate predicted by this channel.
Moving Averages and More
To better assess possible future price movements, we incorporate technical indicators into the analysis. These include:
In the graphs below, 50-, 100-, and 200-period MAs and a resistance area are traced alongside the current trading pattern of EOS:
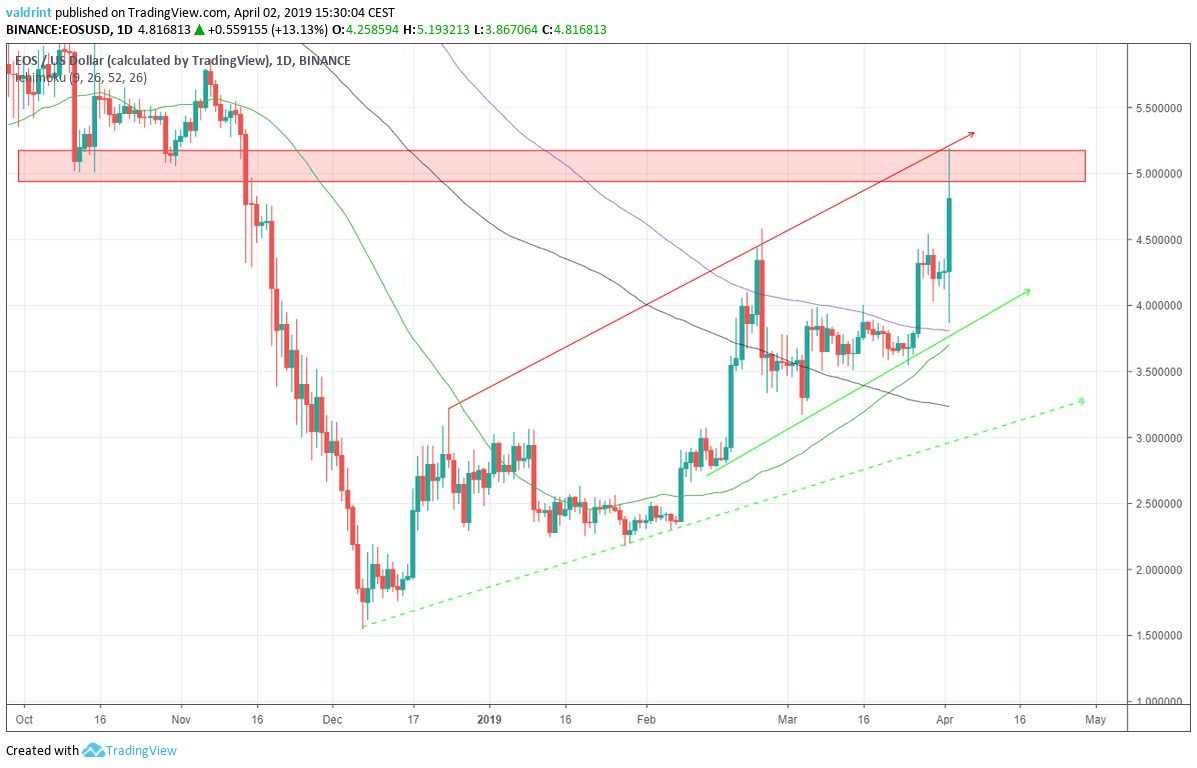
Therefore, there is no resistance left provided by the moving averages.
However, there is a significant resistance area near $5. This is created by the lows of Oct 2018—which coincides with the resistance line of the channel.
Possible Divergence
In this section, we incorporate other technical indicators into the analysis to better predict possible future price fluctuations. These are:
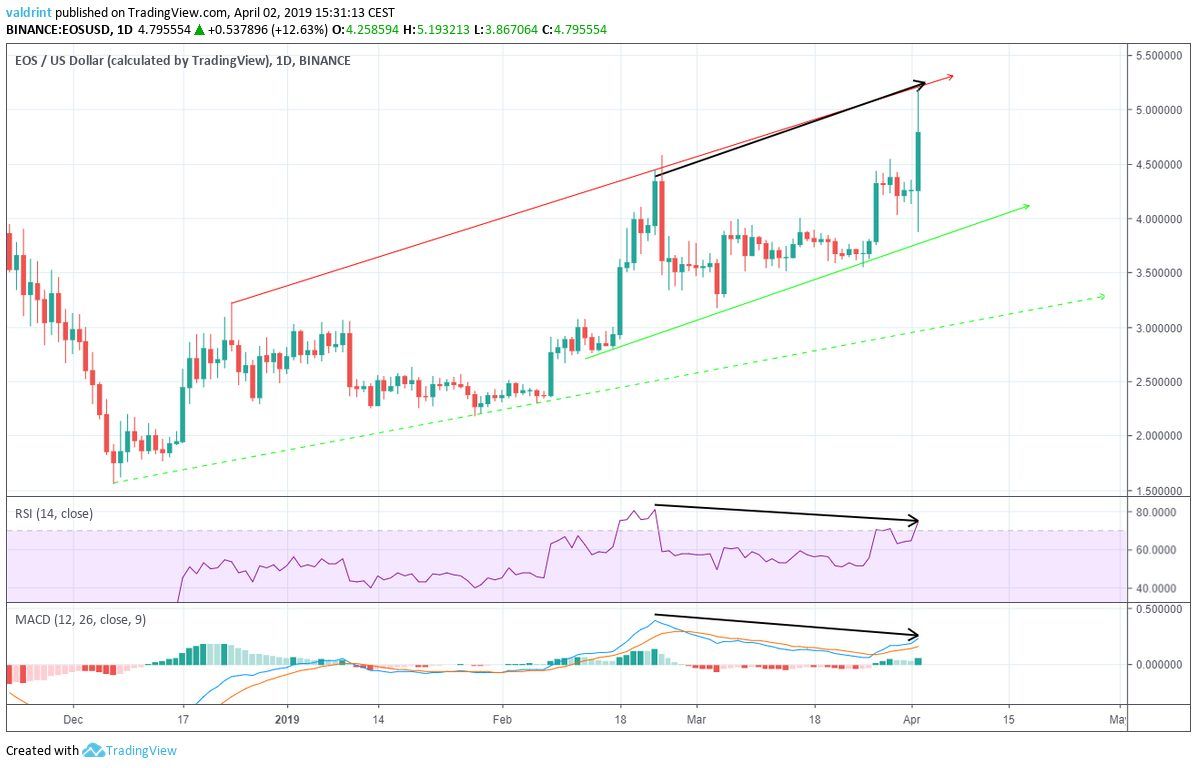
On Feb 24, the price reached a high of $4.58. Since then, it has continued to increase.
Similarly, the RSI and the MACD reached the first high on Feb 24. However, they have proceeded to generate lower values since.
This is known as bearish divergence and often precedes price decreases.
Based on these indicators, we do not believe EOS has enough strength left to break out from the ascending channel or the resistance at $5. Despite a high above $5 on Apr 2, the price is likely to drop back into the channel.
If price continues increasing at this rate, EOS will reach $5 at a later date. However, if price breaks down, EOS could crash far below this level.
April Price Prediction And Summary
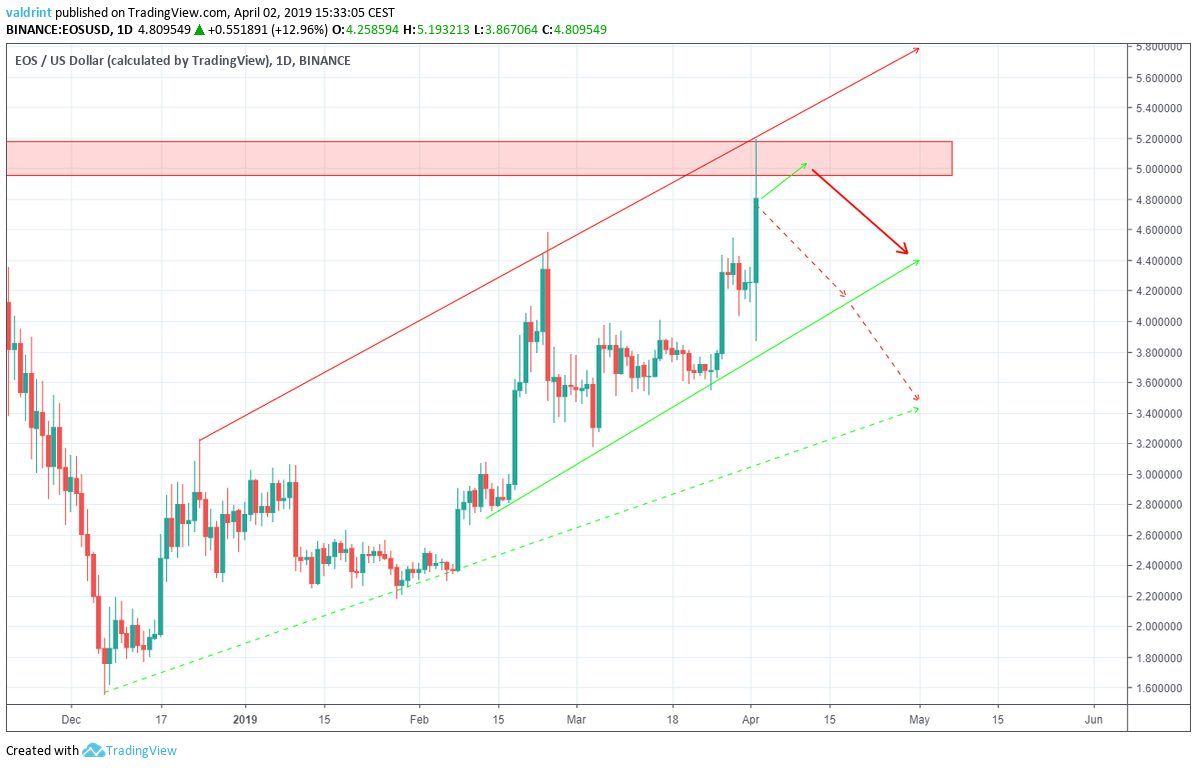
Continuing from the conclusion in our previous section, we believe that the price of EOS will increase at the rate predicted by the channel and possibly break down.
For April, our first scenario has the price moving inside the resistance area and then dropping down to the support line of the channel. At the end of the month, it should be trading between $4.4 and $5.4. Out of the two scenarios, we believe this to be the most likely.
Our second scenario has EOS rapidly dropping to the support line of the channel, and then continuing the breakdown to the second support line (dashed). At the end of the month, it should be trading between $3.4 and $4. Out of the two scenarios, we believe this to be the least likely.
Do you think the price of EOS will continue increasing or will it eventually breakdown? Let us know your thoughts in the comments below!
Disclaimer: This article is not trading advice and should not be construed as such. Always consult a trained financial professional before investing in cryptocurrencies, as the market is particularly volatile.


