


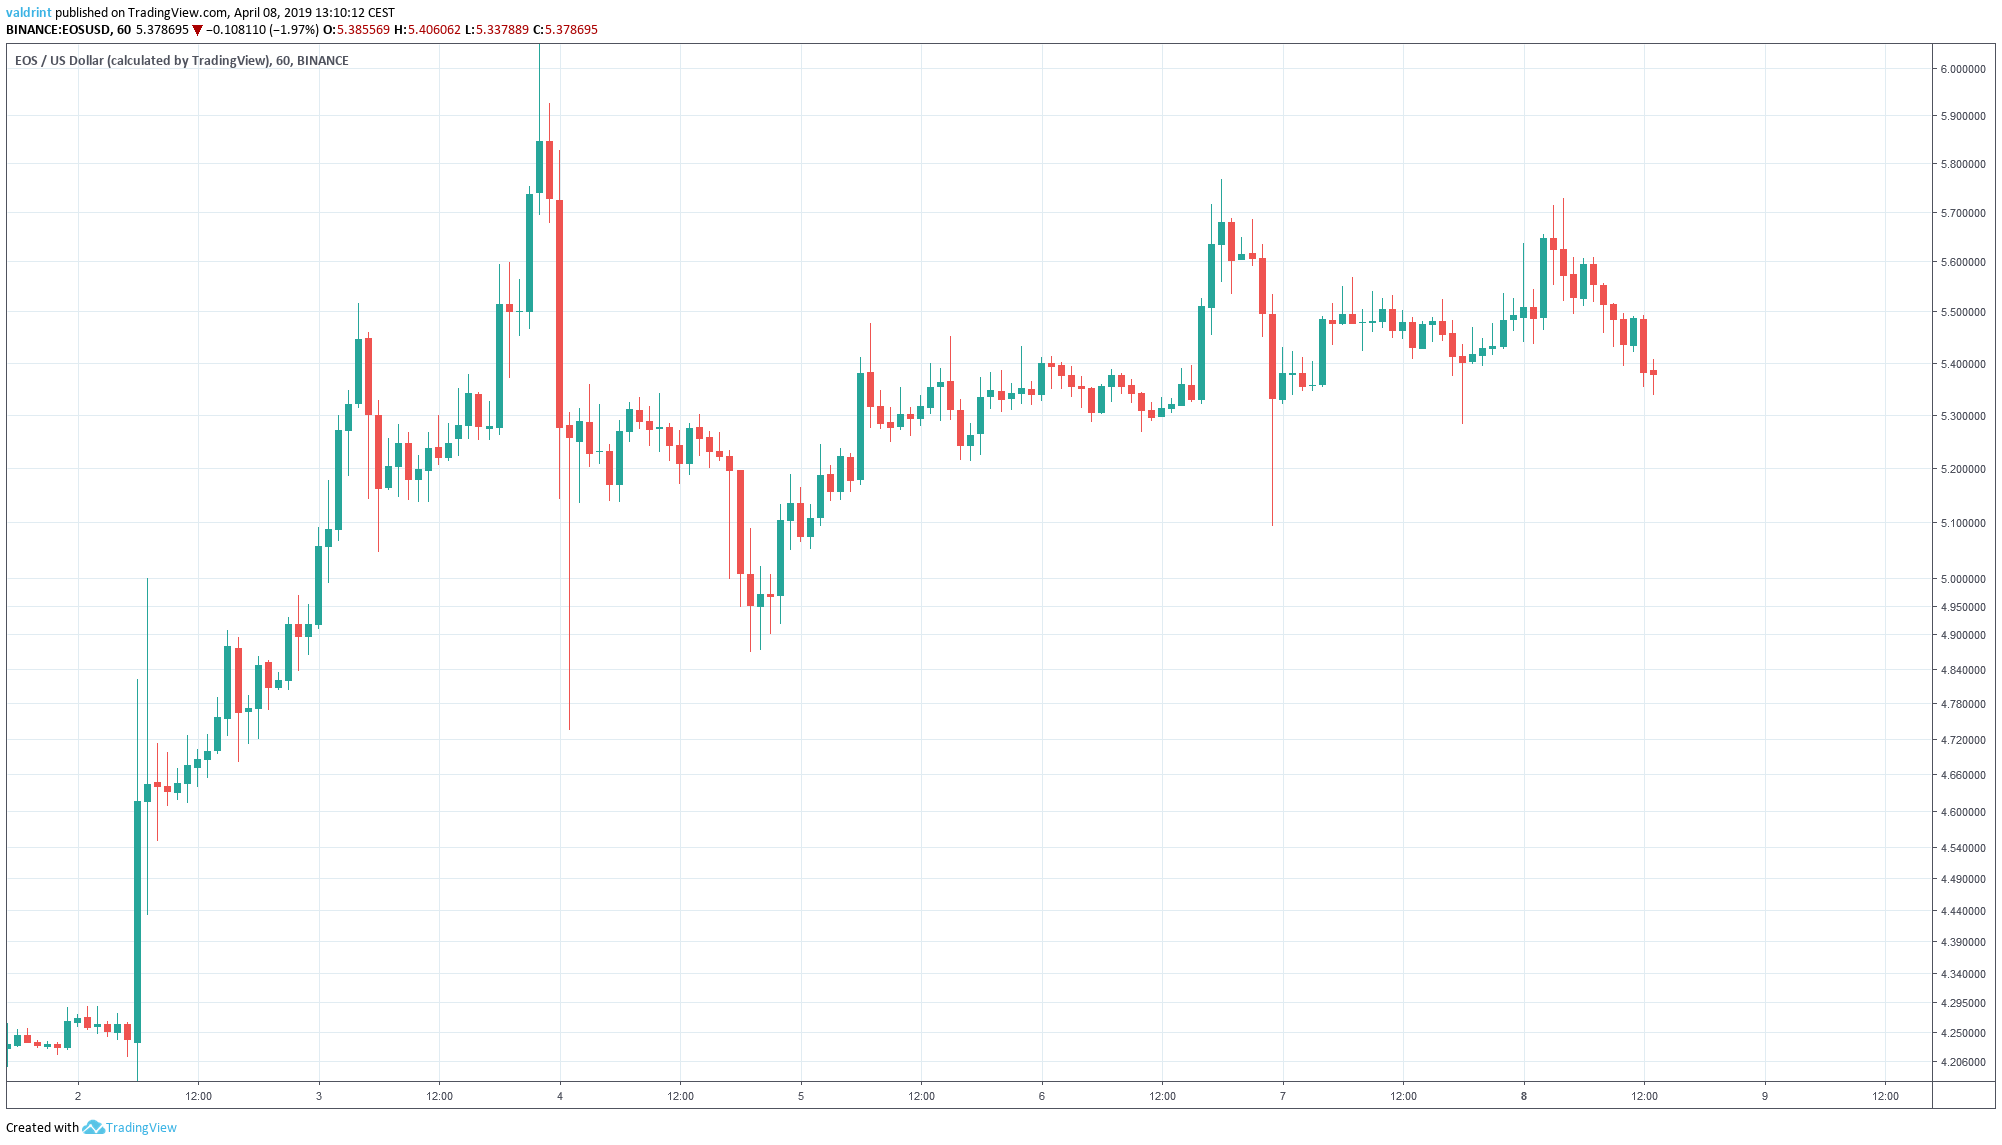
On Apr 2, the price of EOS initiated a rapid upward movement. A high of $6 was reached on Apr 3.
A rapid decrease was followed by a gradual increase.
The price has not been able to reach the same high since.
Will EOS be able to reclaim highs over $6 in the near future?
Let’s find out:
EOS (EOS): Trends And Highlights For April 8, 2019
- The price of EOS reached a high of $6.09 on Apr 3.
- EOS is trading inside a symmetrical triangle.
- Bearish divergence developing in the RSI.
- There is resistance near $6 and support near $5.
Tracing the Current Trading Pattern
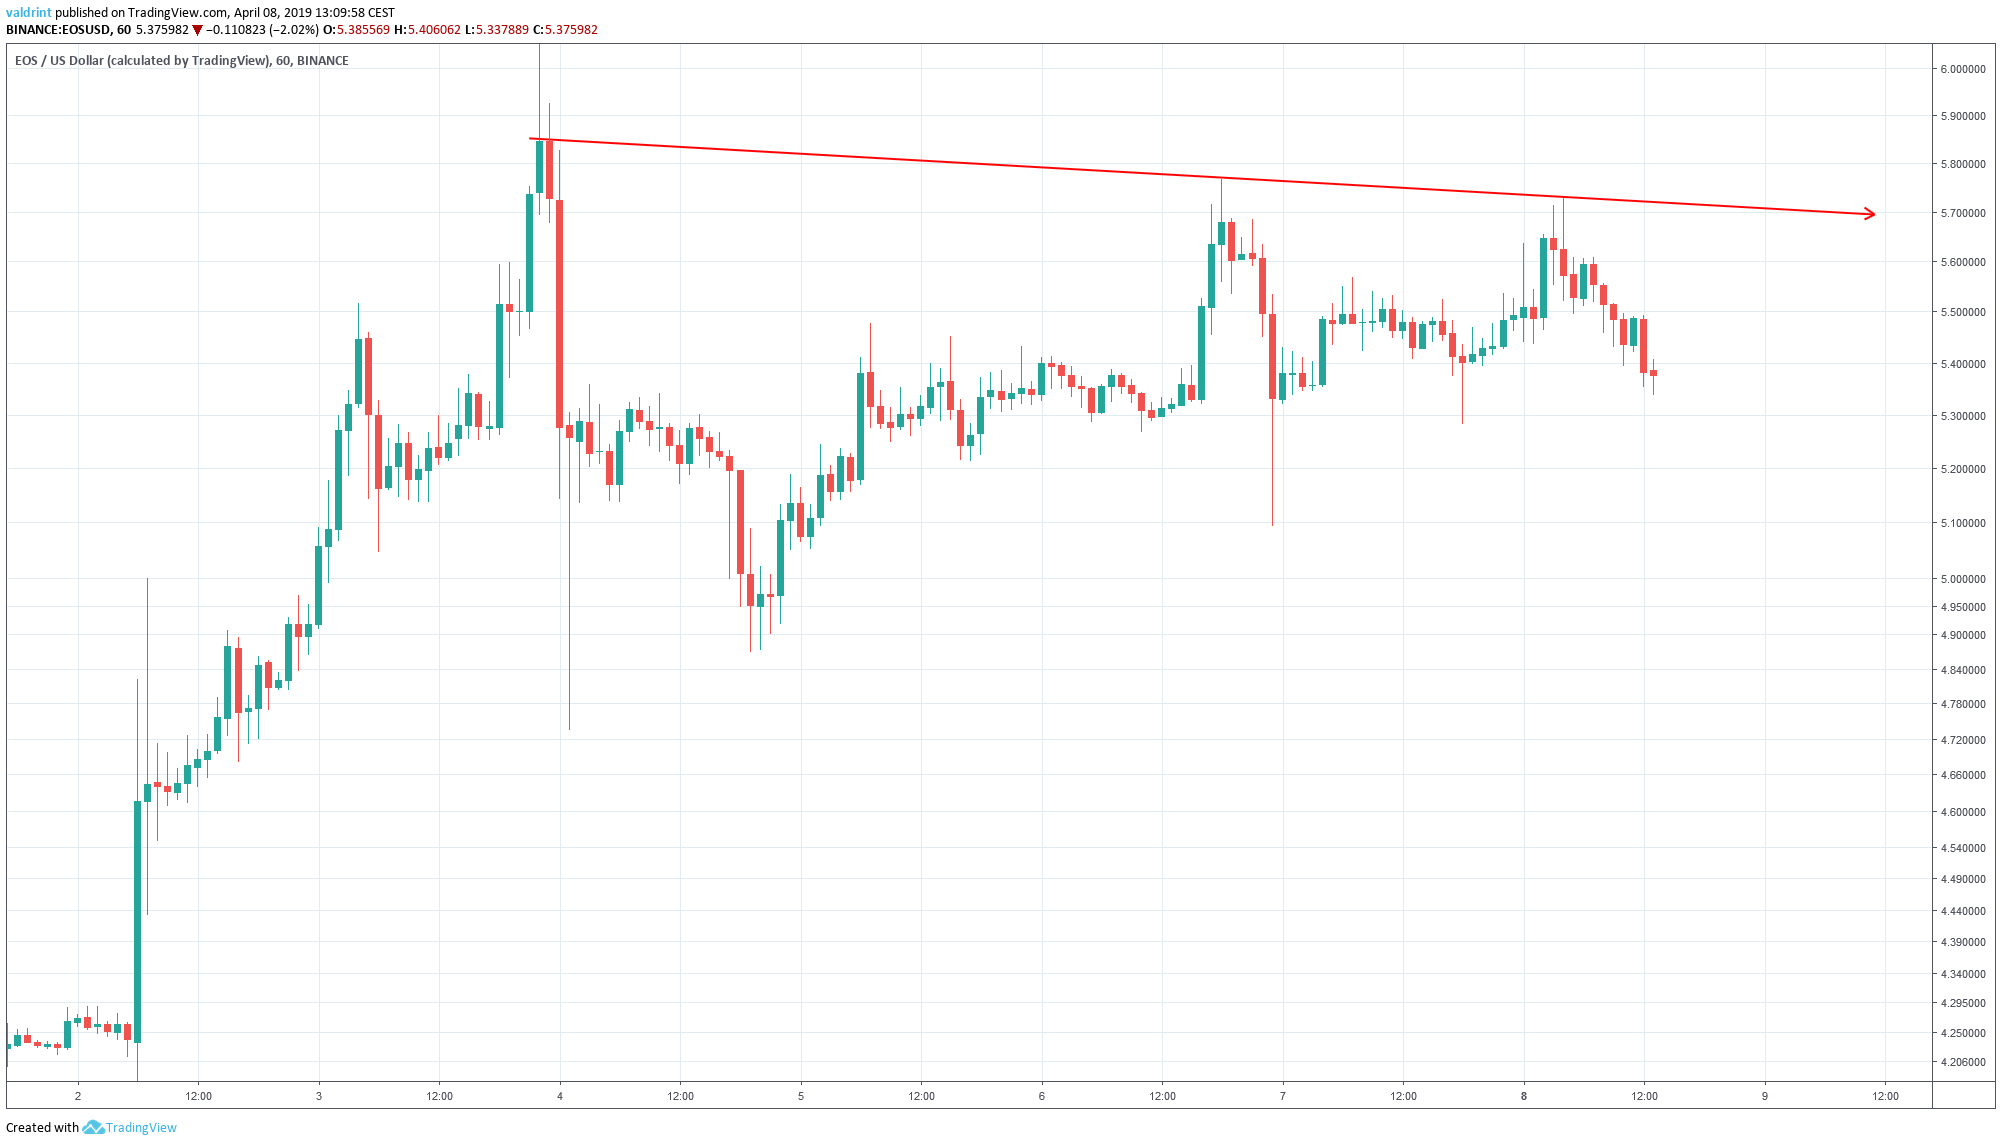
On Apr 3, the price made a high of $6.09. A sharp downward move was followed by a gradual increase. The price has made several lower highs.
Tracing these highs gives us a descending resistance line:
Tracing these lows gives us an ascending support line.
The resistance and support lines combine to create a symmetrical triangle:
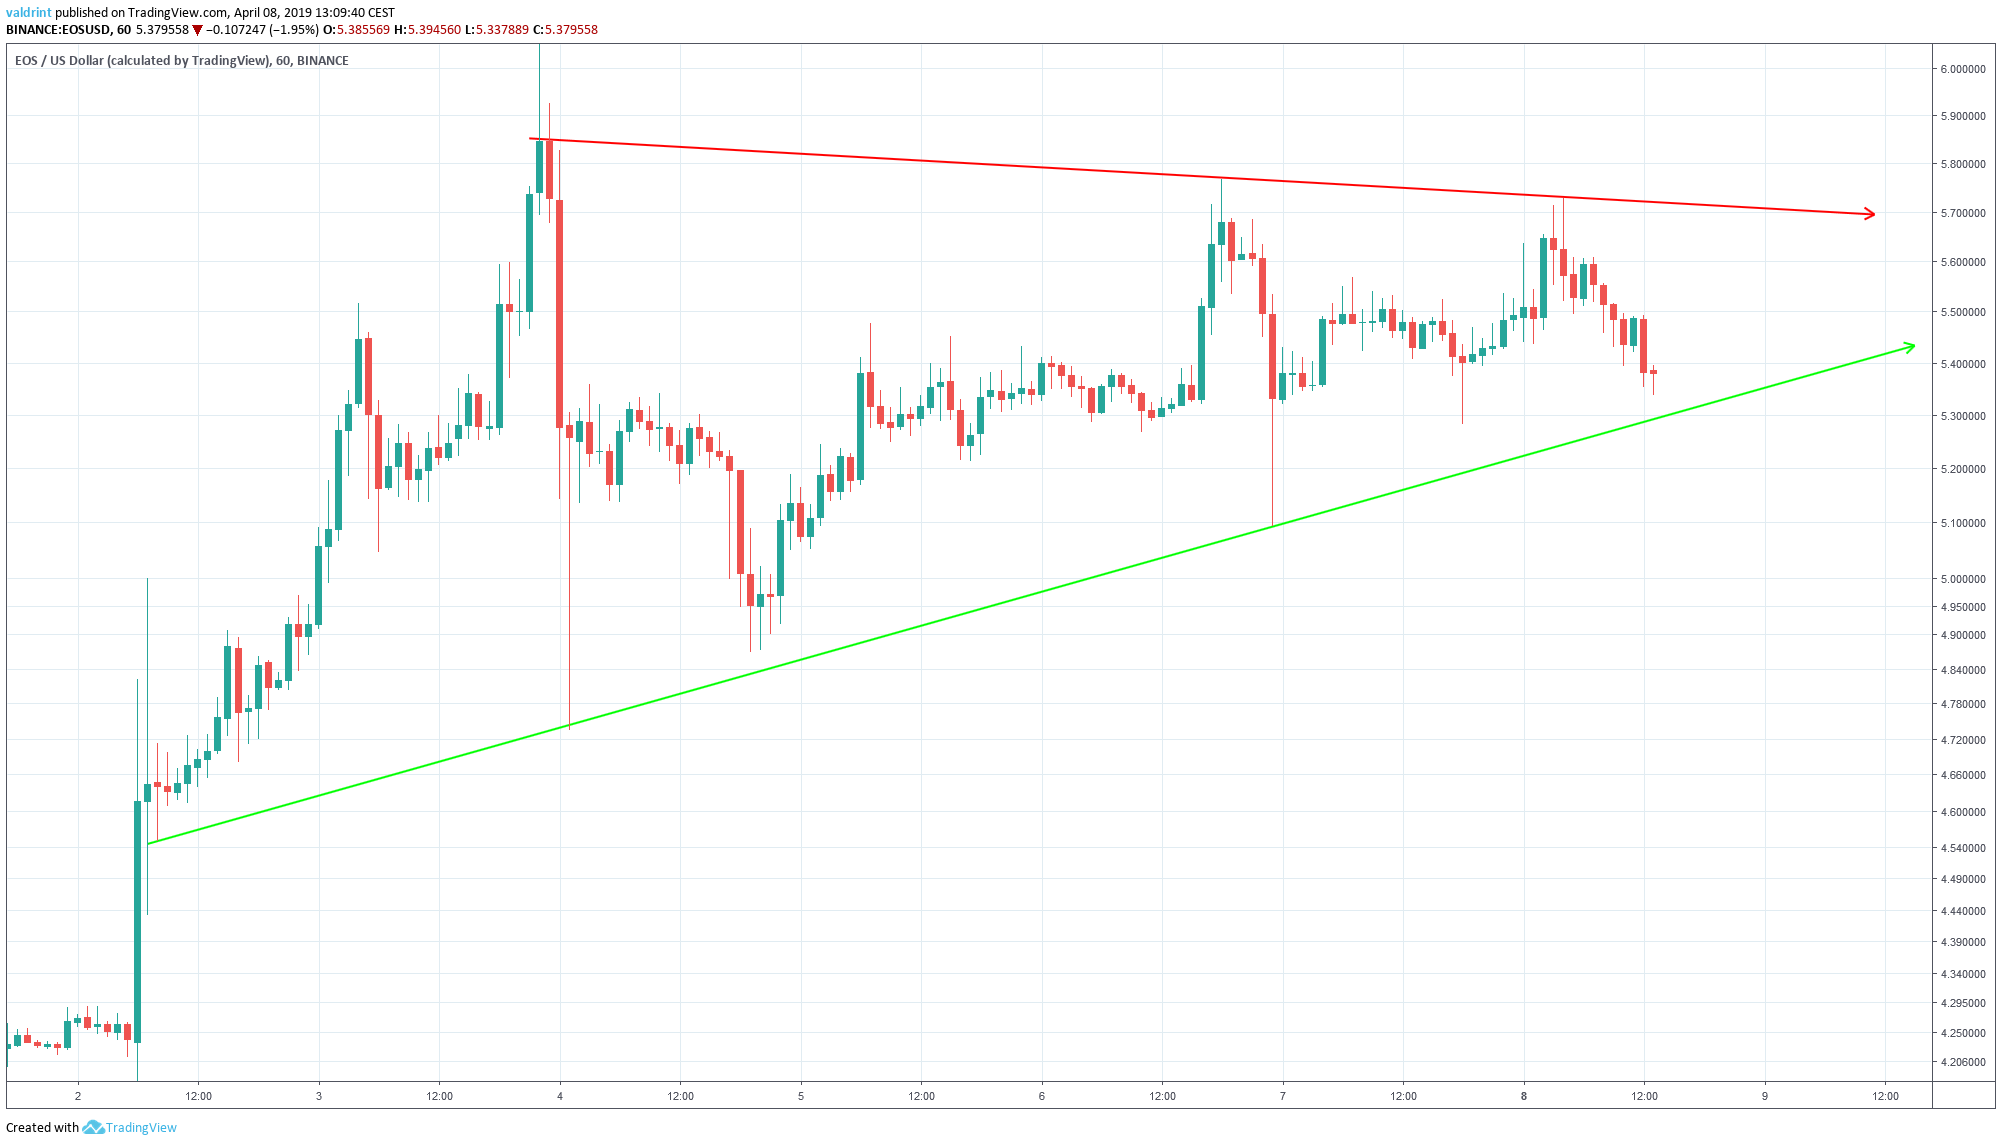
It is likely that the price will keep trading inside the confines of this triangle until a decisive move occurs. In order to figure out the direction of the move, we need to look at technical indicators.
RSI Divergence
The price of EOS on Binance was analyzed at one-day intervals from Oct 2018 to Apr 2019 alongside the relative strength index to determine possible future price movements.
RSI is traced alongside price in the chart below:
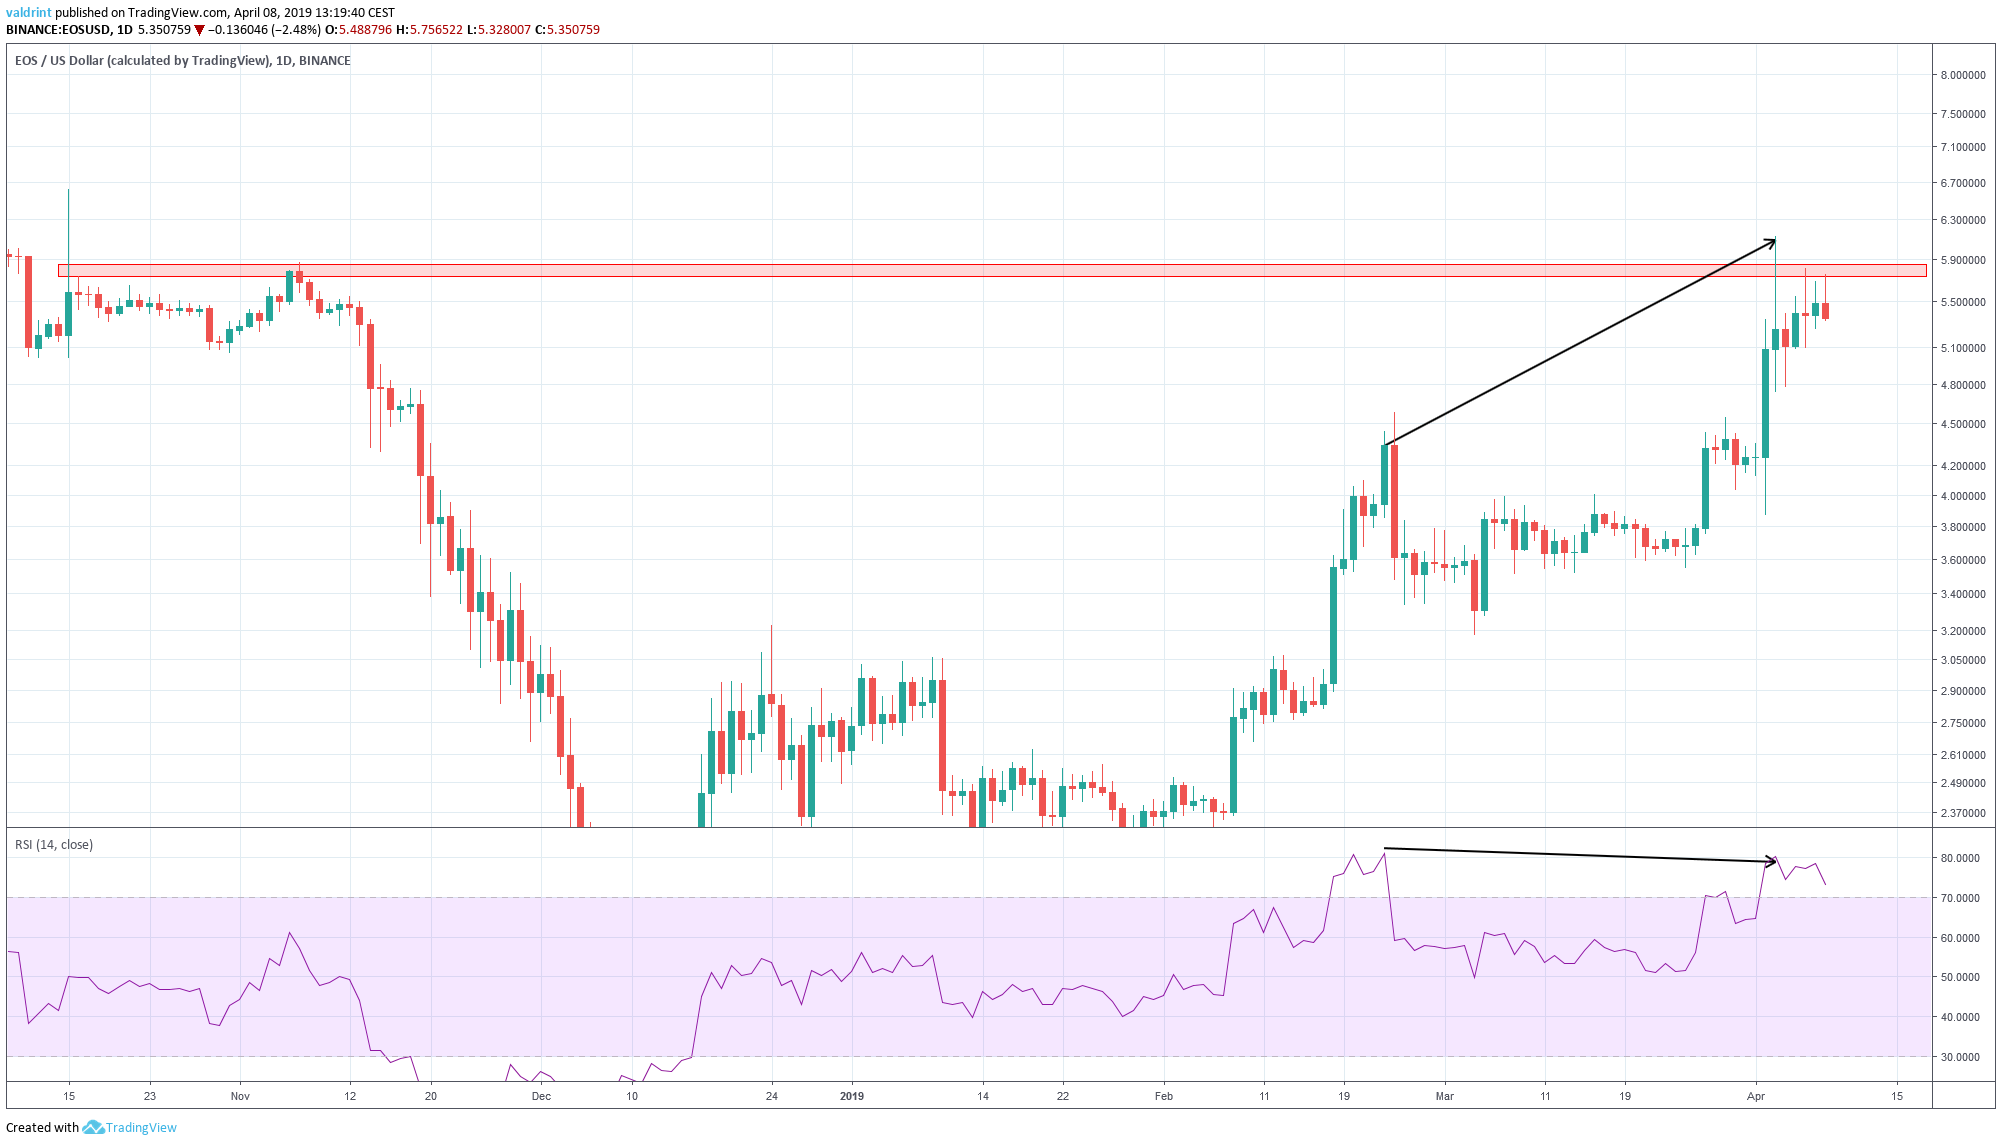
On Feb 25, the price reached a high of $4.58. It reached a higher high of $6.13 on Apr 3.
Similarly, the RSI made the first high on Feb 25. However, it has continued to generate lower values since.
This is known as bearish divergence and often precedes price decreases.
In the case of EOS it is occurring in a long-term time frame and close to a significant resistance area.
Based on this indicator, we believe that price decreases are forthcoming for EOS.
Future Movement
In this section, we incorporate support and resistance areas into the analysis to determine possible future price levels.
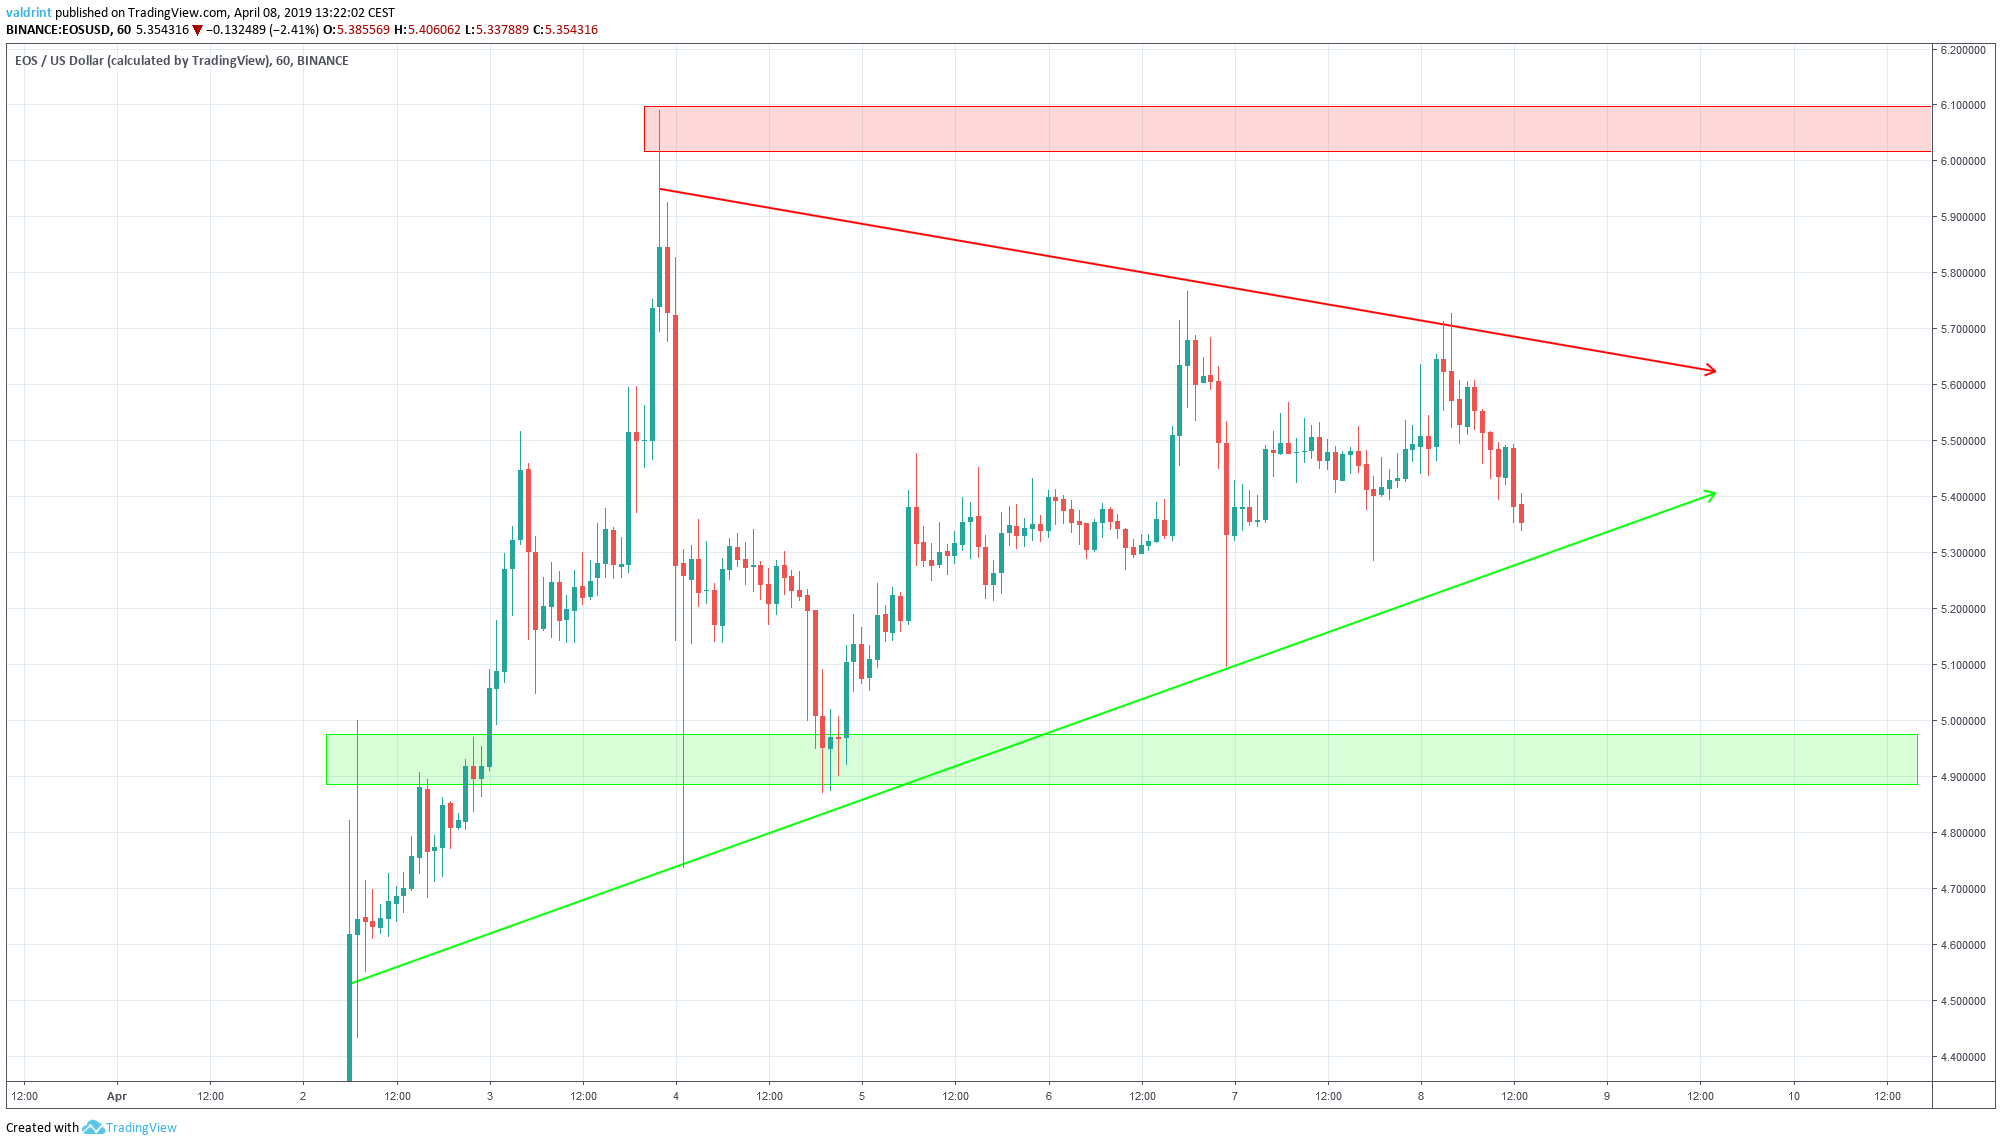
The closest resistance area is found near $6. If a breakout were to occur, it would provide a likely reversal area.
The closest support area is found near $5. If a breakdown were to occur, it would provide a likely reversal area.
Summary of Analysis
Based on our analysis, it is likely that the price of EOS breaks will keep trading inside the symmetrical triangle. We cannot confidently predict a breakout or a breakdown, but we believe a breakdown to be more likely. Even if a breakdown does not occur, the price may continue dropping toward the support line.
However, after nearing or touching the support, EOS may make a reversal and return to the resistance line. Given the proximity of the price to the support at the moment, the price drops indicated by the RSI may have already commenced.
In such a case, a reversal may happen sooner rather than later. We cannot confirm when or if such a reversal will happen.
Where do you think the price of EOS will go? Let us know your thoughts in the comments below!
Disclaimer: This article is not trading advice and should not be construed as such. Always consult a trained financial professional before investing in cryptocurrencies, as the market is particularly volatile.


