


The EOS price has been decreasing since Aug 2, after failing to break out from a long-term resistance level and was rejected instead.
It is likely that the price is still correcting and has yet to reach a bottom.
EOS Hits Long-Term Resistance Wall
The EOS price has been moving upwards since it reached a bottom on March 13. On Apr 29, it reached the $3.10 resistance area, was rejected, and began to move downwards until the beginning of July.
After this dip concluded, EOS began another upward move that culminated with a high of $3.48, reached on Aug 2. The high coincides with the 0.5 Fib level of the entire previous downward move which started in February.
The price was rejected on Aug 2, creating a bearish engulfing candlestick with massive volume. It is currently trying to hold on to the $2.96 support area, created by the 0.382 Fib level of the same decrease.
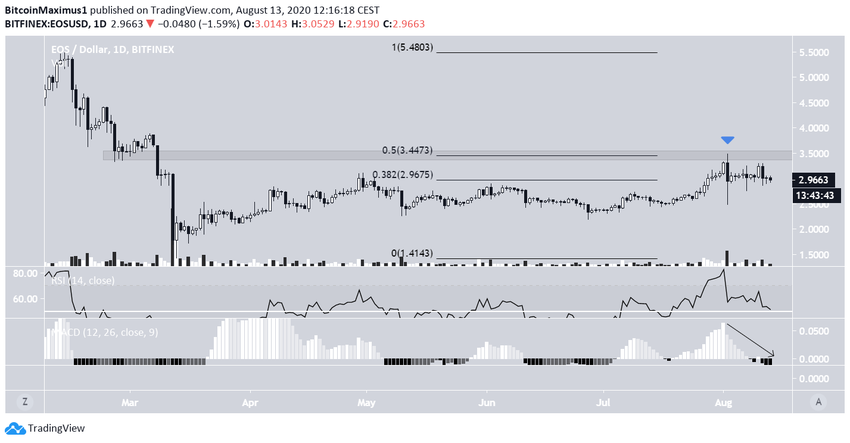
In addition, the second-highest volume was present in the bearish engulfing candlestick of Aug 11, which had a lower close than its bullish counterpart from a day earlier—another bearish sign.
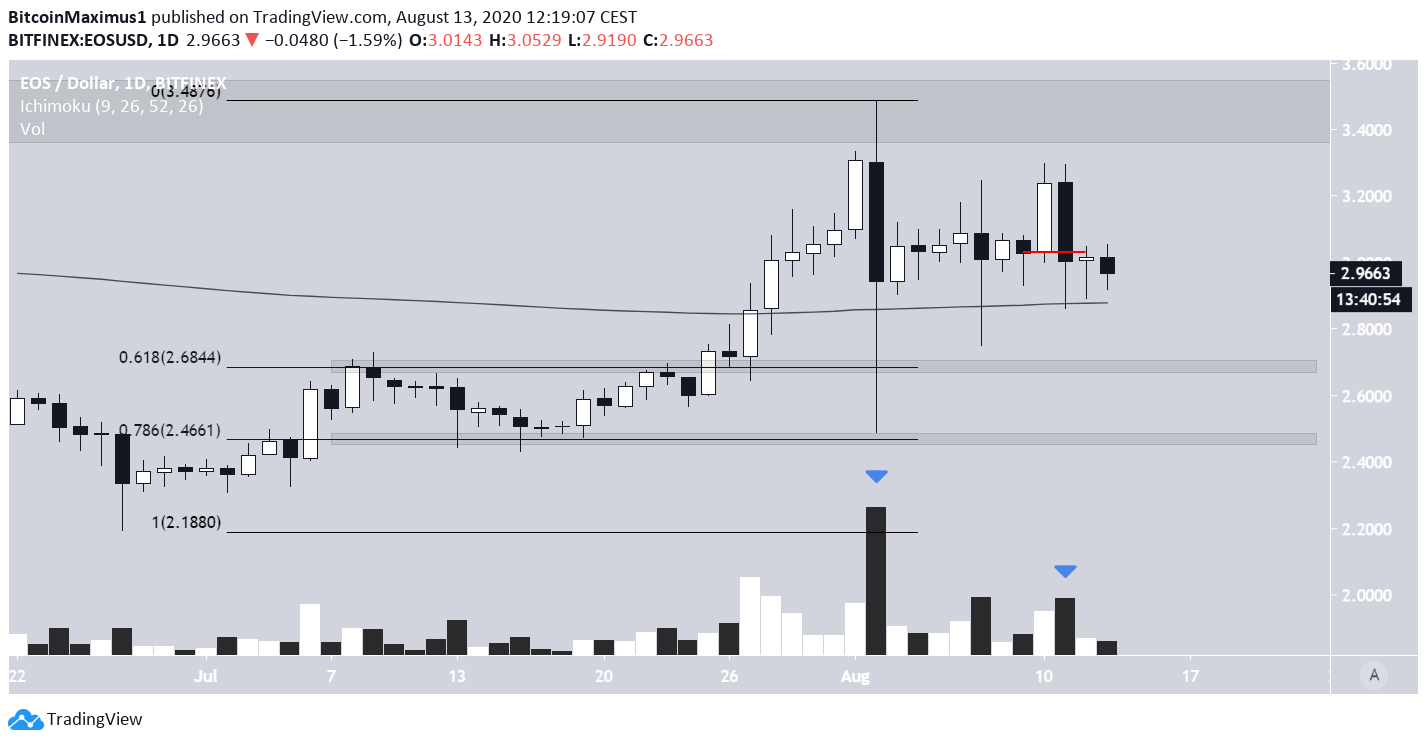
Currently, the price is trying to hold on above the support offered by the 200-day moving average (MA). If the price breaks down, the next support levels would be found at $2.68 and $2.46, the 0.618 and 0.786 Fib levels of the upward move.
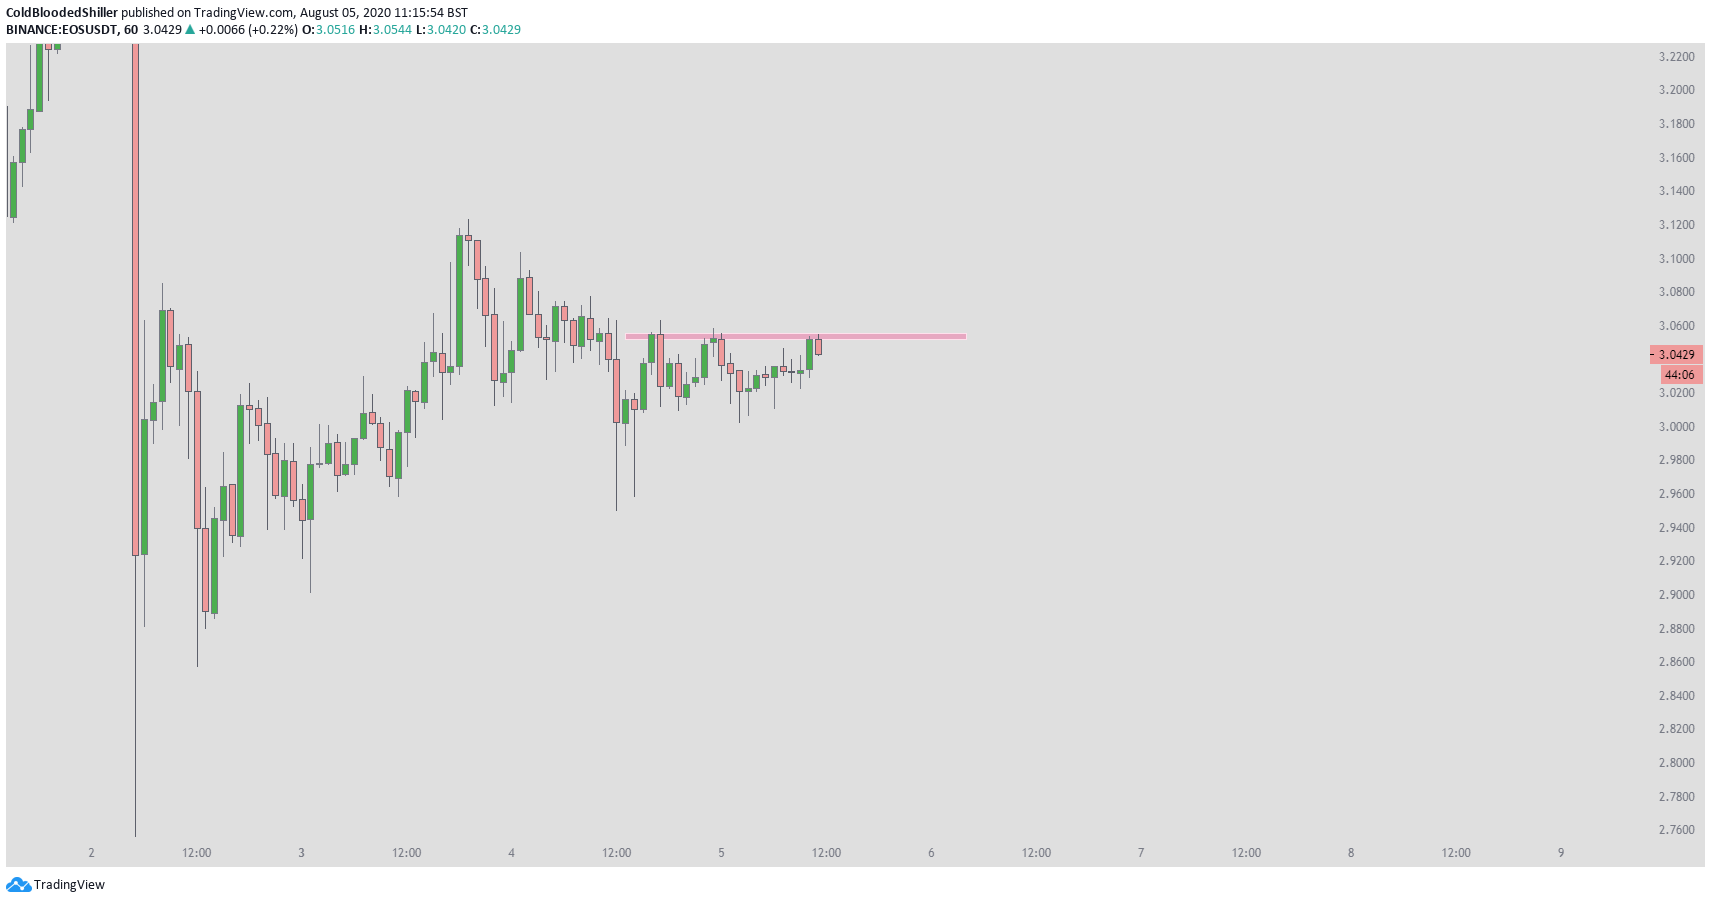
Cryptocurrency trader @Coldbloodshill tweeted an EOS chart with a resistance line at $3.04. While the chart is from a few days ago, the resistance has not been broken yet and has rejected the price as discussed above.
Wave Count
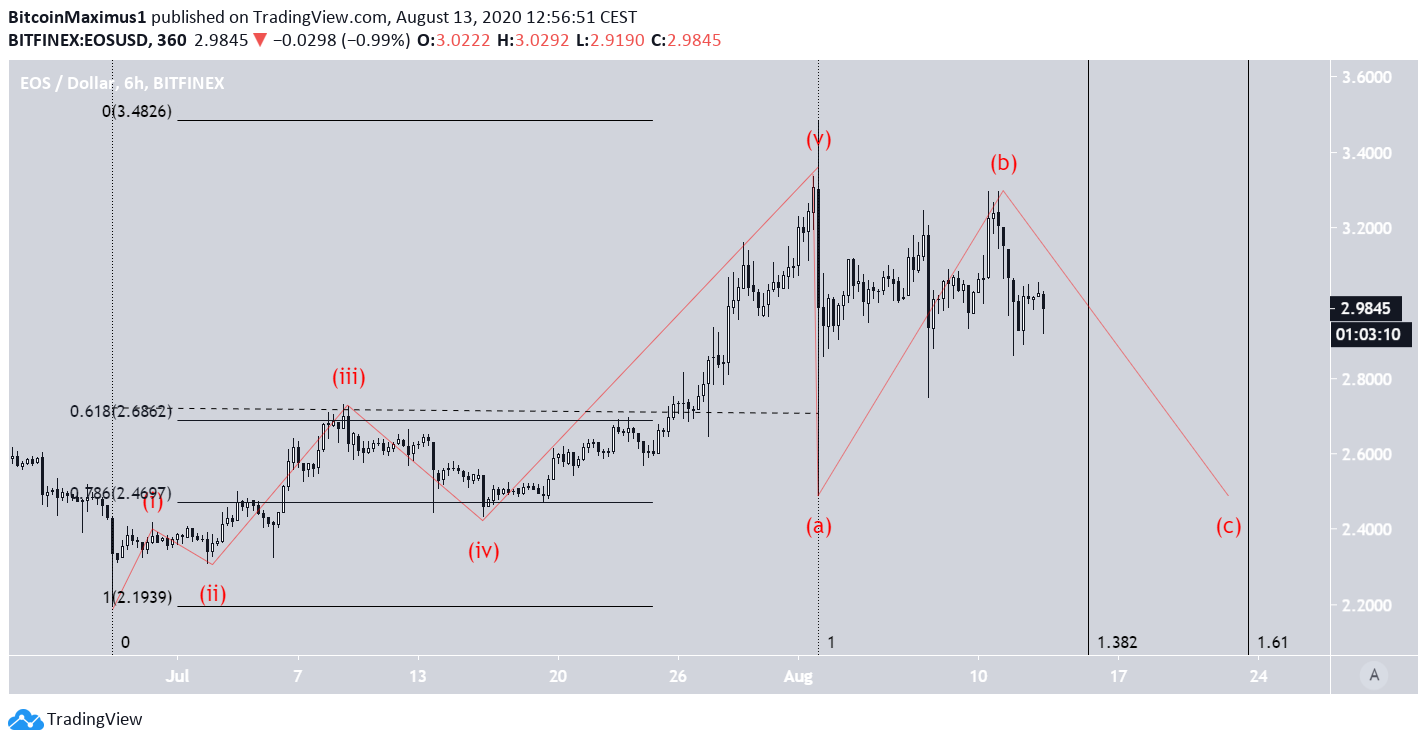
As for the wave count, the most likely scenario is that EOS began a five-wave impulsive formation on June 30, which continued until the aforementioned Aug 2 high. The movement since resembles an A-B-C correction.
The most likely price for the correction to end would be between the 0.618 ($2.69) and 0.786 ($2.47) Fib levels. Considering the A wave’s bottom was near the latter, the C wave bottom could be slightly lower.
The 1.382 and 1.618 Fib time retracements fall on Aug 16 and Aug 23, respectively. Therefore, this broad range is where the correction is expected to be completed.
To conclude, the EOS price is likely to resume its corrective movement towards the support levels outlined above.


