Even though the EOS price broke out from a long-term descending resistance line, the price has fallen back below it since. Despite this drop, EOS’ bullish formation remains intact.
Long-Term Deviation
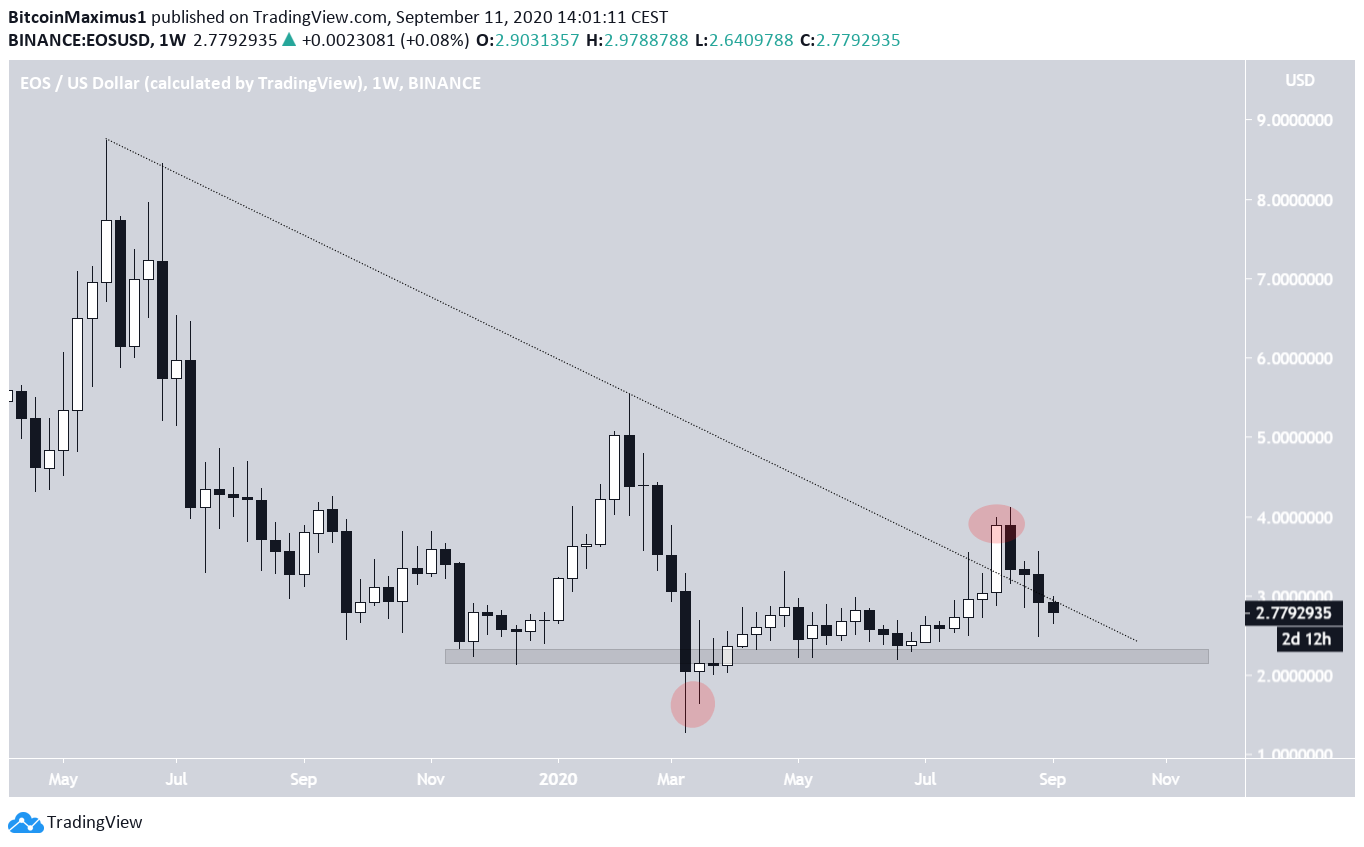
The EOS price had been following a descending resistance line since May 2019. The price broke out from this line in July 2020 and reached a high of $3.65 on August 16. However, the price has fallen back below the breakout line since, indicating a failed breakout.
Interestingly, prior to this, the price made a similar fake-out below the $2.30 support area before initiating an upward move. Currently, it looks as if the price is retracing in order to confirm this area as support once more.
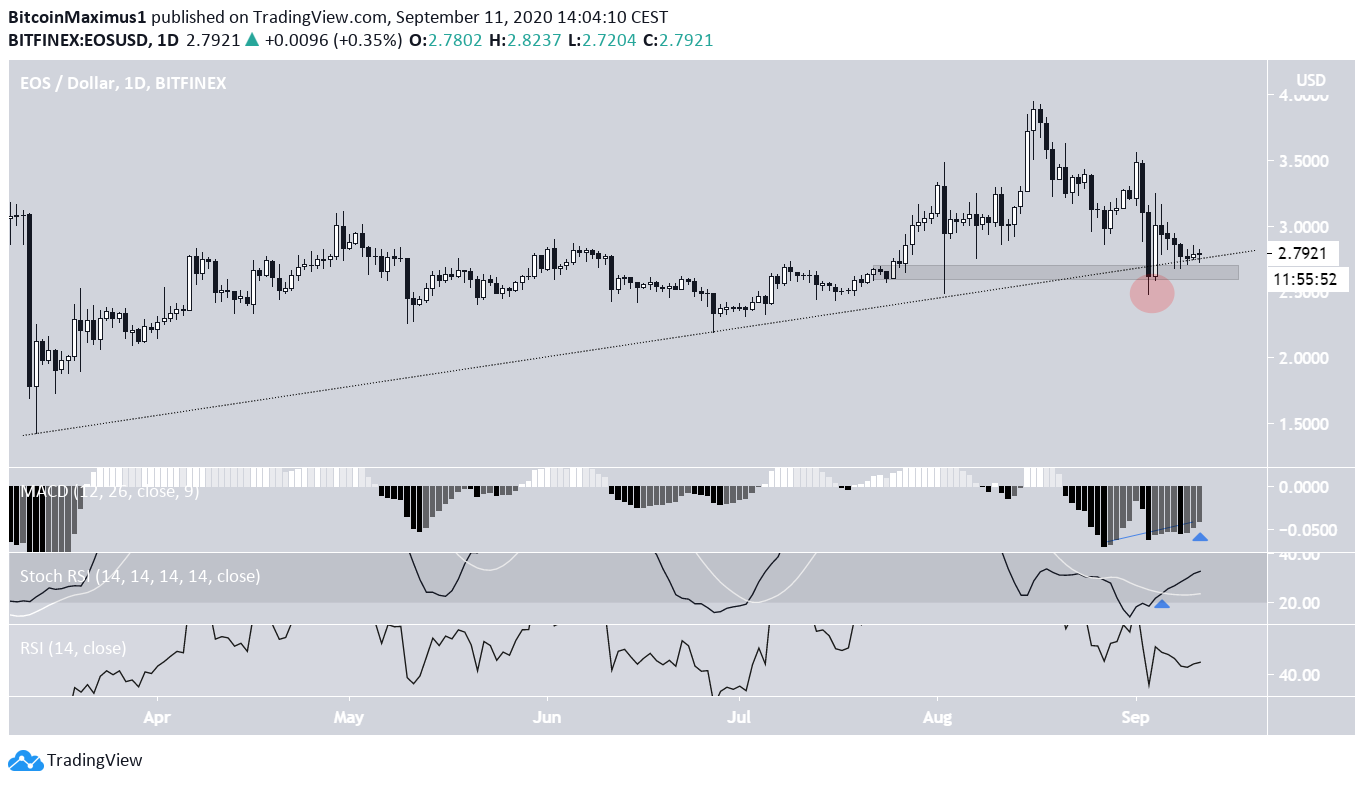
The daily chart shows another deviation on the bullish side. The price had been following an ascending support line since its March 13 low and reportedly broke down from it on September 2. However, the price has reclaimed the support line since.
Furthermore, there is a minor support area at $2.7, above which the price is also trading. As long as EOS is trading above this rising support line, the trend can be considered bullish.
Technical indicators on the daily time-frame are also bullish:
- The MACD is increasing and has formed bullish divergence
- The Stochastic RSI has made a bullish cross.
However, the RSI has not given any bullish reversal signs.
Wave Count
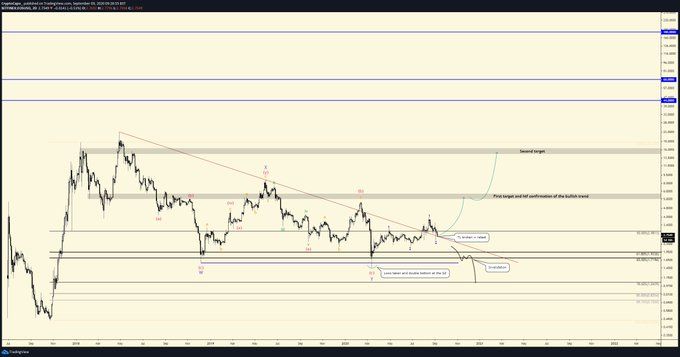
Cryptocurrency trader @Cryptocapo_ outlined an EOS chart, in which the price has begun a bullish trend and will continue increasing toward $5.80 and eventually $16.
The short-term wave count since March 13 is identical to the one presented in BeInCrypto’s September 3 analysis. Therefore, we will focus on the longer-term count below.
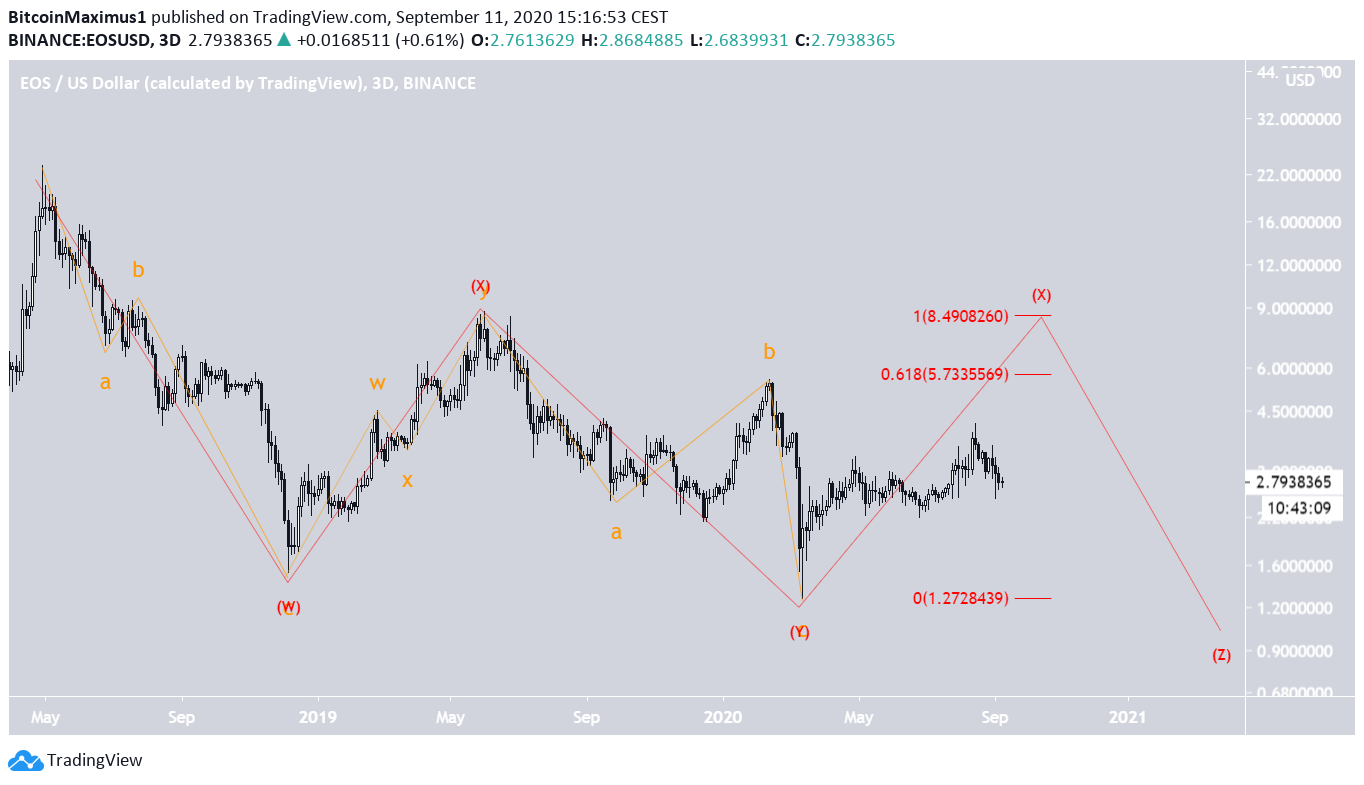
The wave count suggests that in the period from April 2018 – March 2020, the price has completed a complex, W-X-Y correction (in red below). The beginning of the correction also marked an all-time high price of $23.27.
If the count is correct, the price has begun a bullish impulsive formation on March 13 and is currently in the third wave, which is extended. The count would be invalidated with a fall below the June 26 low at $2.18
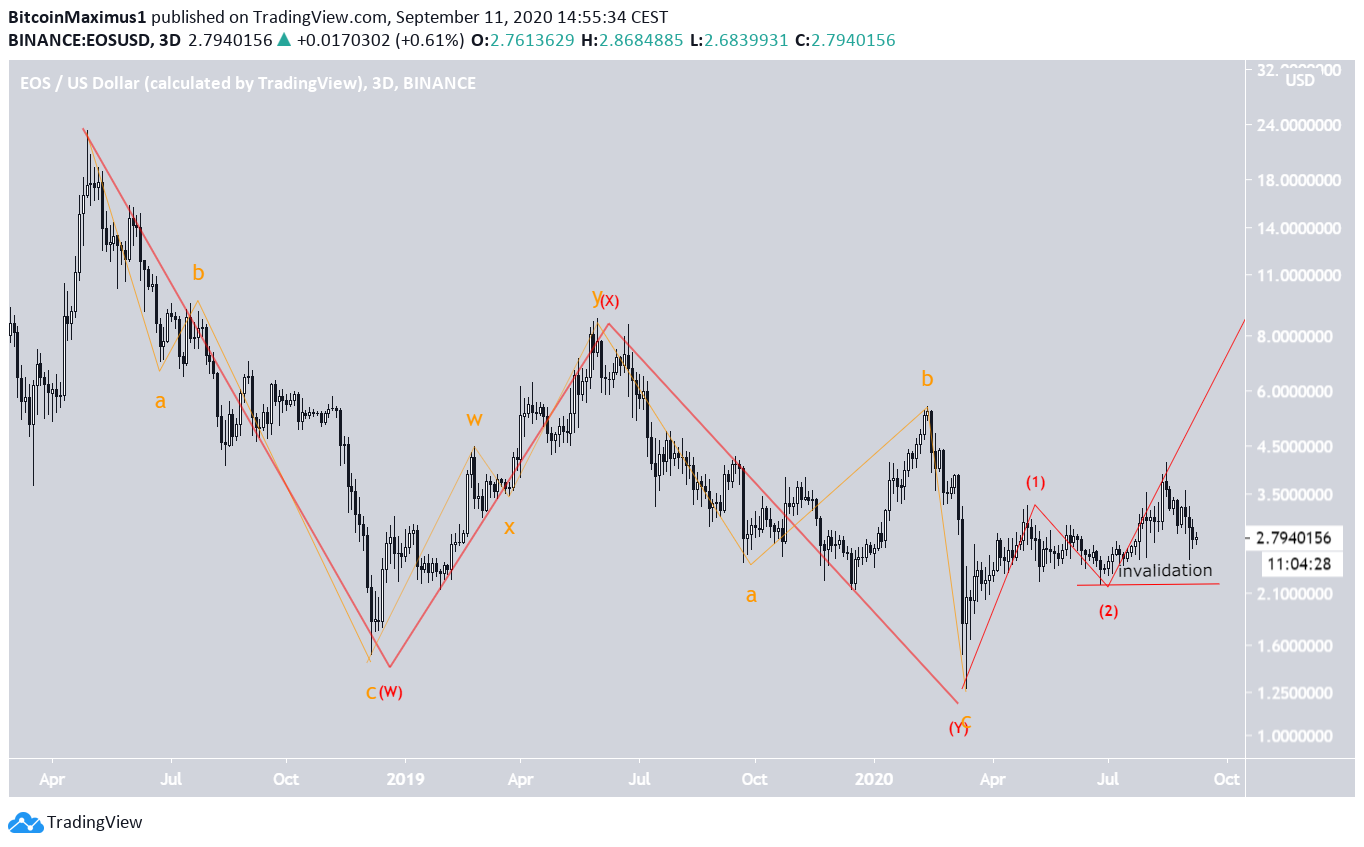
However, due to the length of the previous X wave, even if the count is incorrect, meaning that the price is still correcting, a rally towards at least $5.73 would still be expected.
Therefore, while we cannot yet determine if the $16 target will be reached, it seems that the price will eventually reach the $5.80 target.