


The EOS (EOS) price has broken out from a descending resistance line that had been in place since April 2018.
Along with the bullish outlook given by long-term indicators, it is likely that EOS has already begun a bullish trend and will continue increasing.
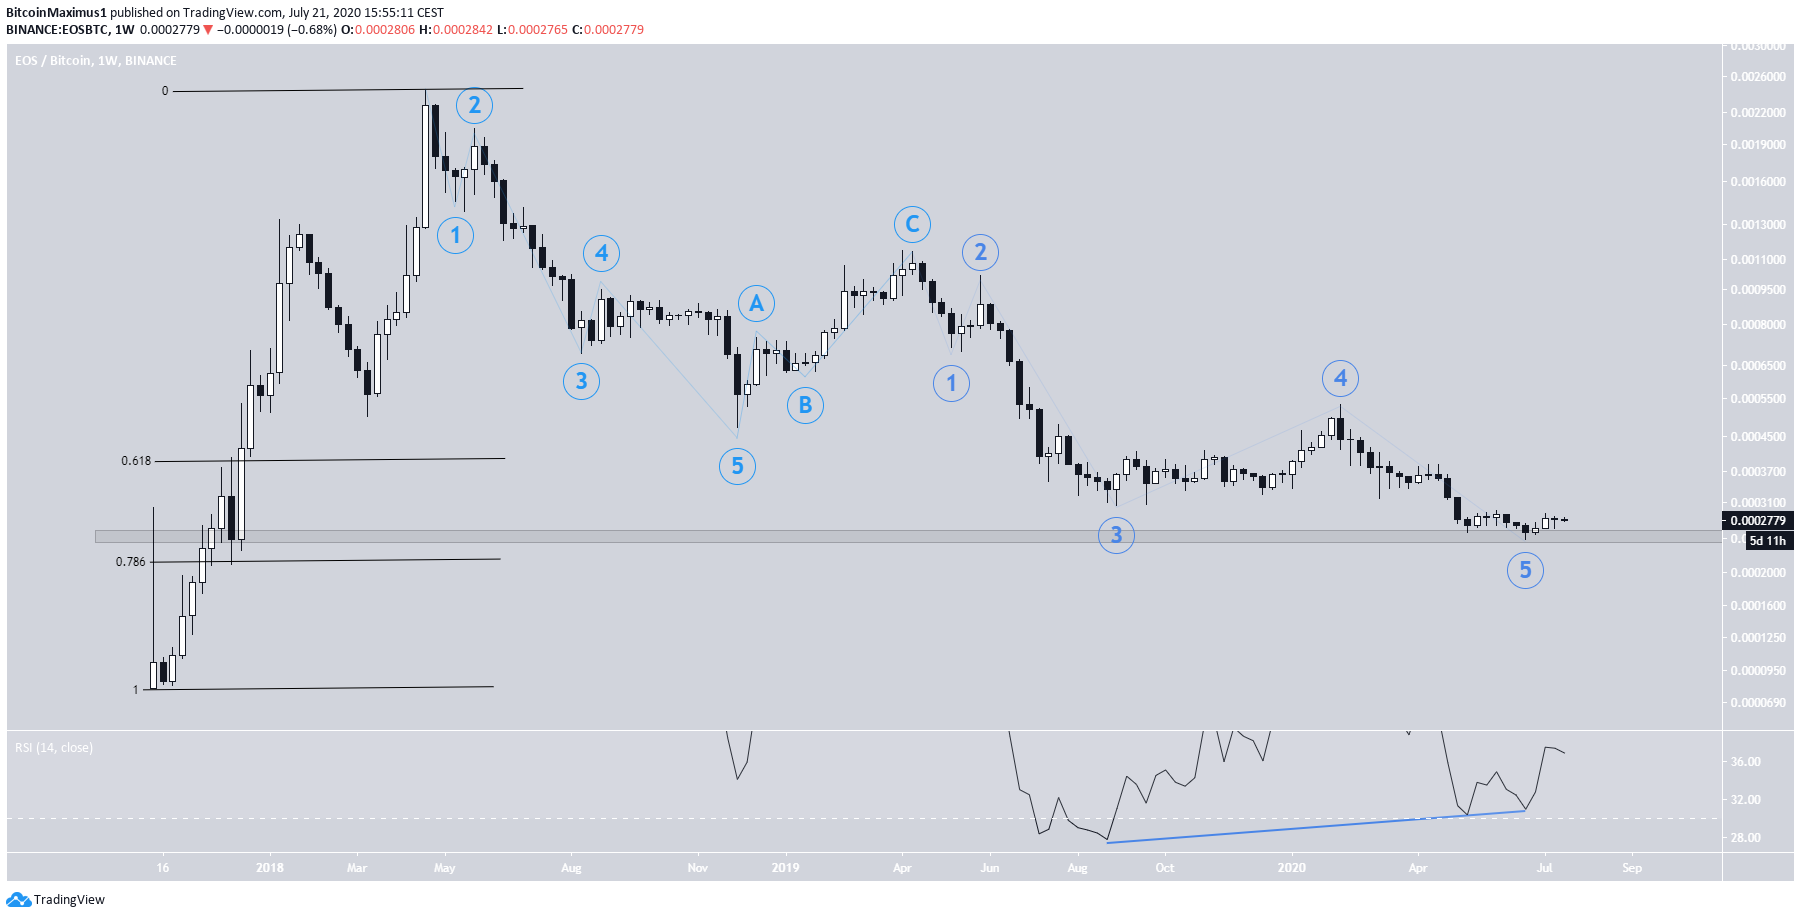
EOS Long-Term Correction
The EOS price has been decreasing since April 2018, when it reached a high of 240,000 satoshis. The movement since then resembles a completed correction with a 5-3-5 wave count. The June 27 low of 24,790 satoshis dipped just below the 25,000 satoshi horizontal support area, which is also the 0.786 Fib level of the entire downward move.
In addition, the weekly RSI has been generating bullish divergence since July 2019, a sign that the price is likely to move upwards and reverse its bearish trend.
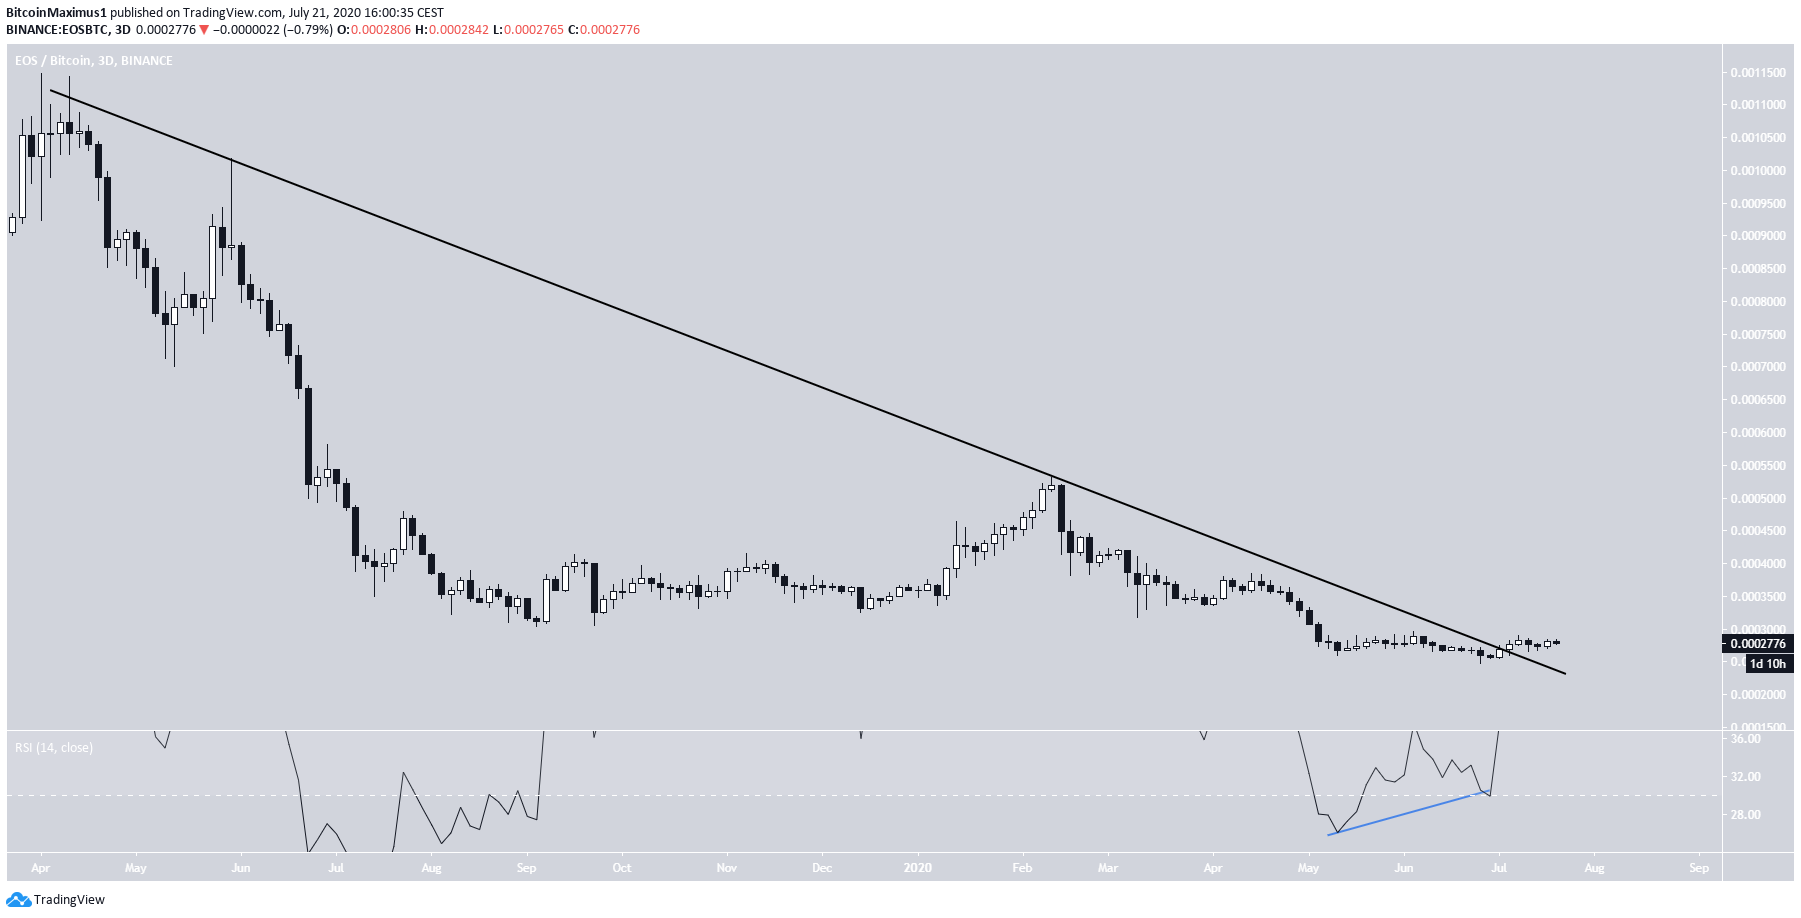
The three-day chart shows that EOS has also broken out from a descending resistance line that had been in place since April 2019, and has paired with some ongoing shorter-term bullish divergence.
These bullish signs in different time-frames indicate that the price has likely begun a bullish trend and should move upwards.
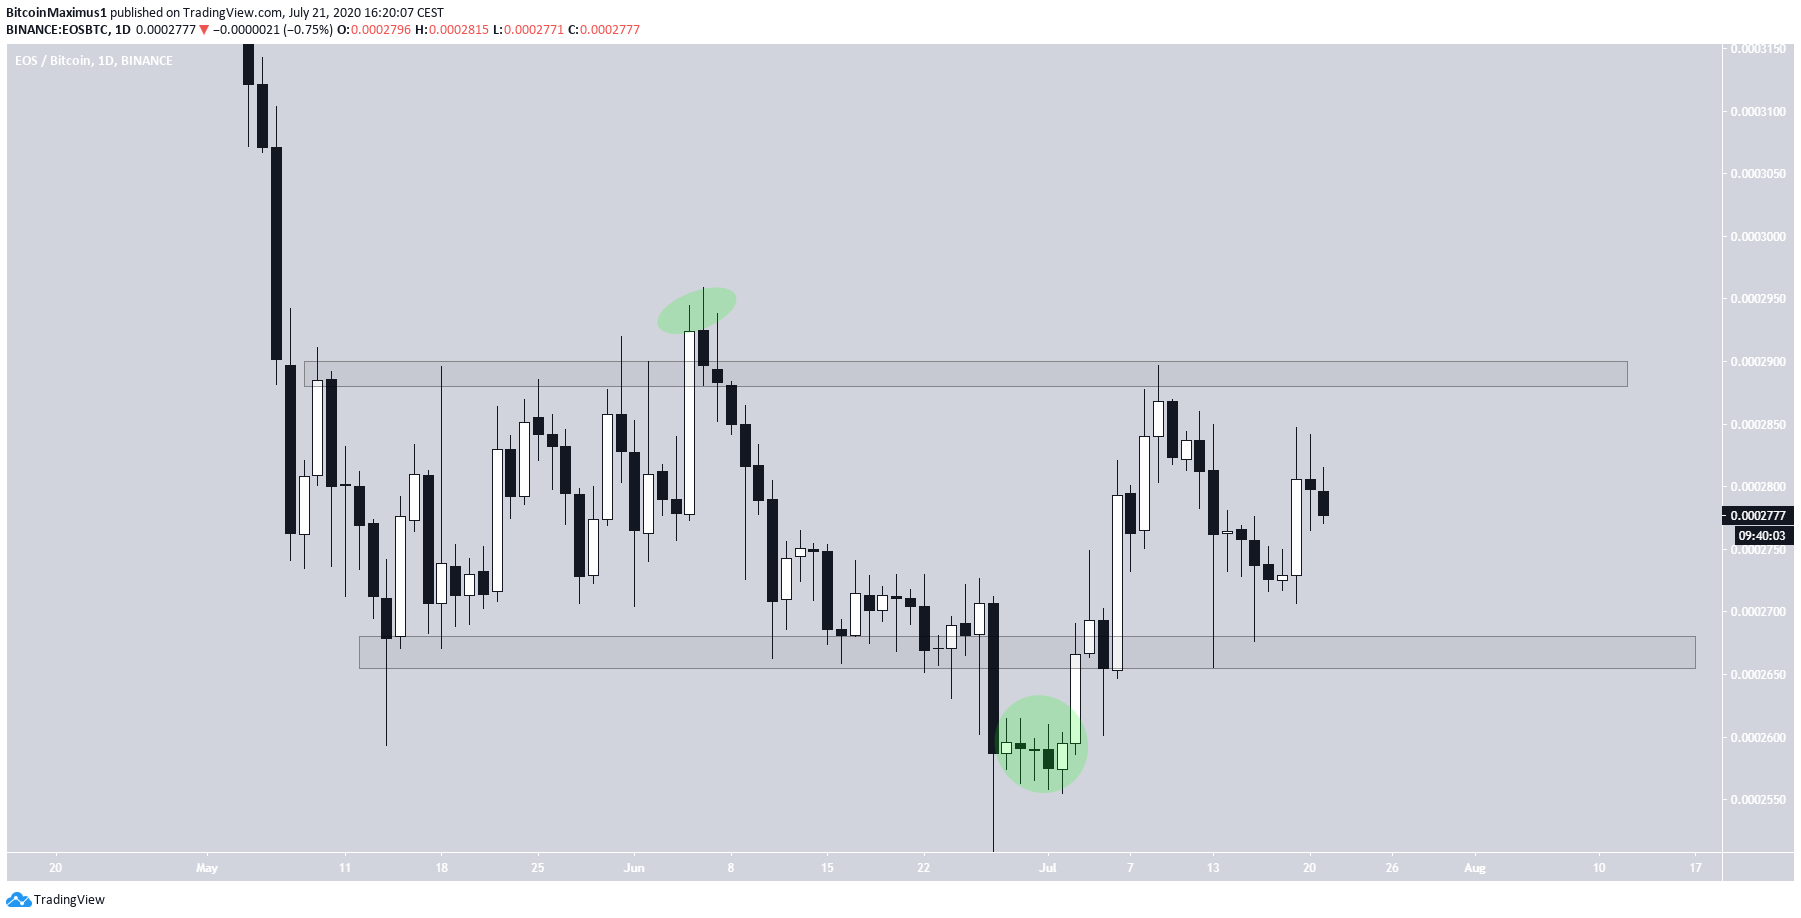
Trading Range
The daily chart reveals a trading range between 26,500 and 28,500 satoshis. The price initially faked a breakout above this range, only to fall back inside it to fake a breakdown.
However, the price has reclaimed the 26,500 satoshi area and validated it as support. This is a sign that the price is expected to continue moving upwards and eventually break out from the range.
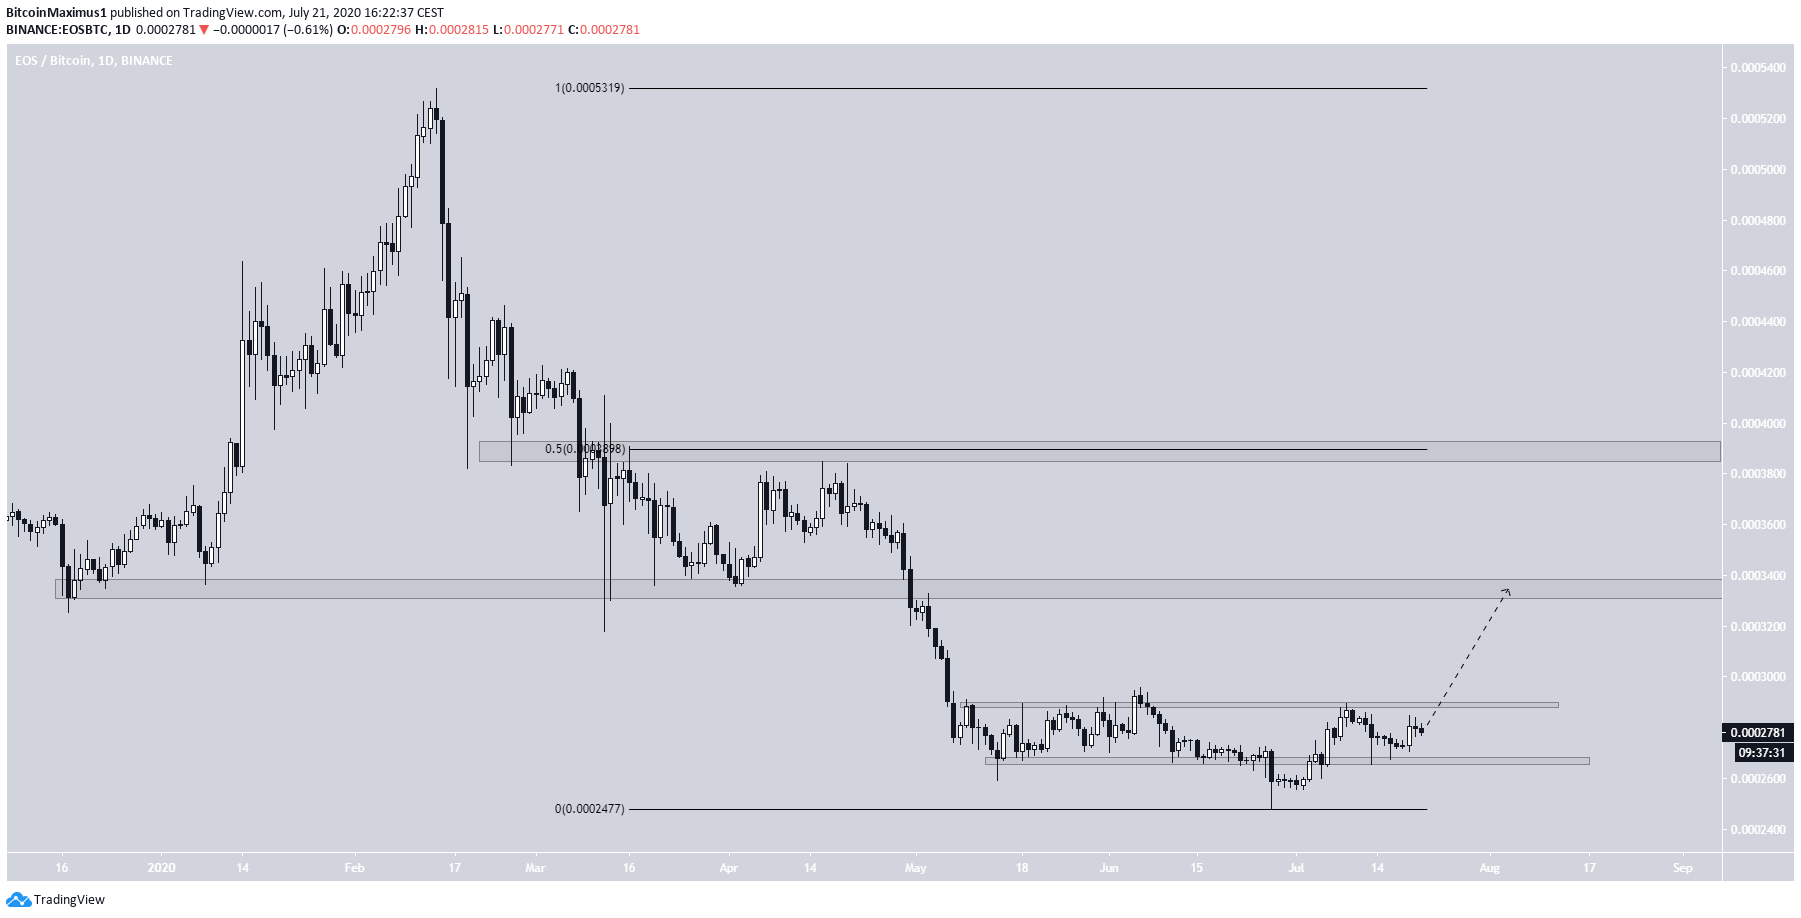
If the price breaks out from the previously mentioned trading range, the closest resistance areas are found at 33,600 and 39,300 satoshis.
The first is a previous support area, that is now expected to act as resistance, while the second is the 0.5 Fib level of the most recent decrease beginning in February.
Wave Count
Cryptocurrency trader @Glowto1994 tweeted an EOS chart, stating that the price has begun an impulse, and should soon resume its upward movement.
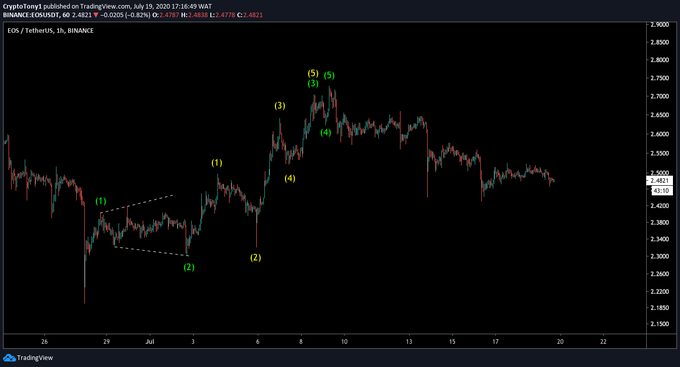
The most likely scenario is that the price began an impulsive move on its June 27 low, and is currently in the fifth and final wave, which has become extended.
The fifth wave is expected to cause a breakout from the range, before correcting slightly to validate it as support.
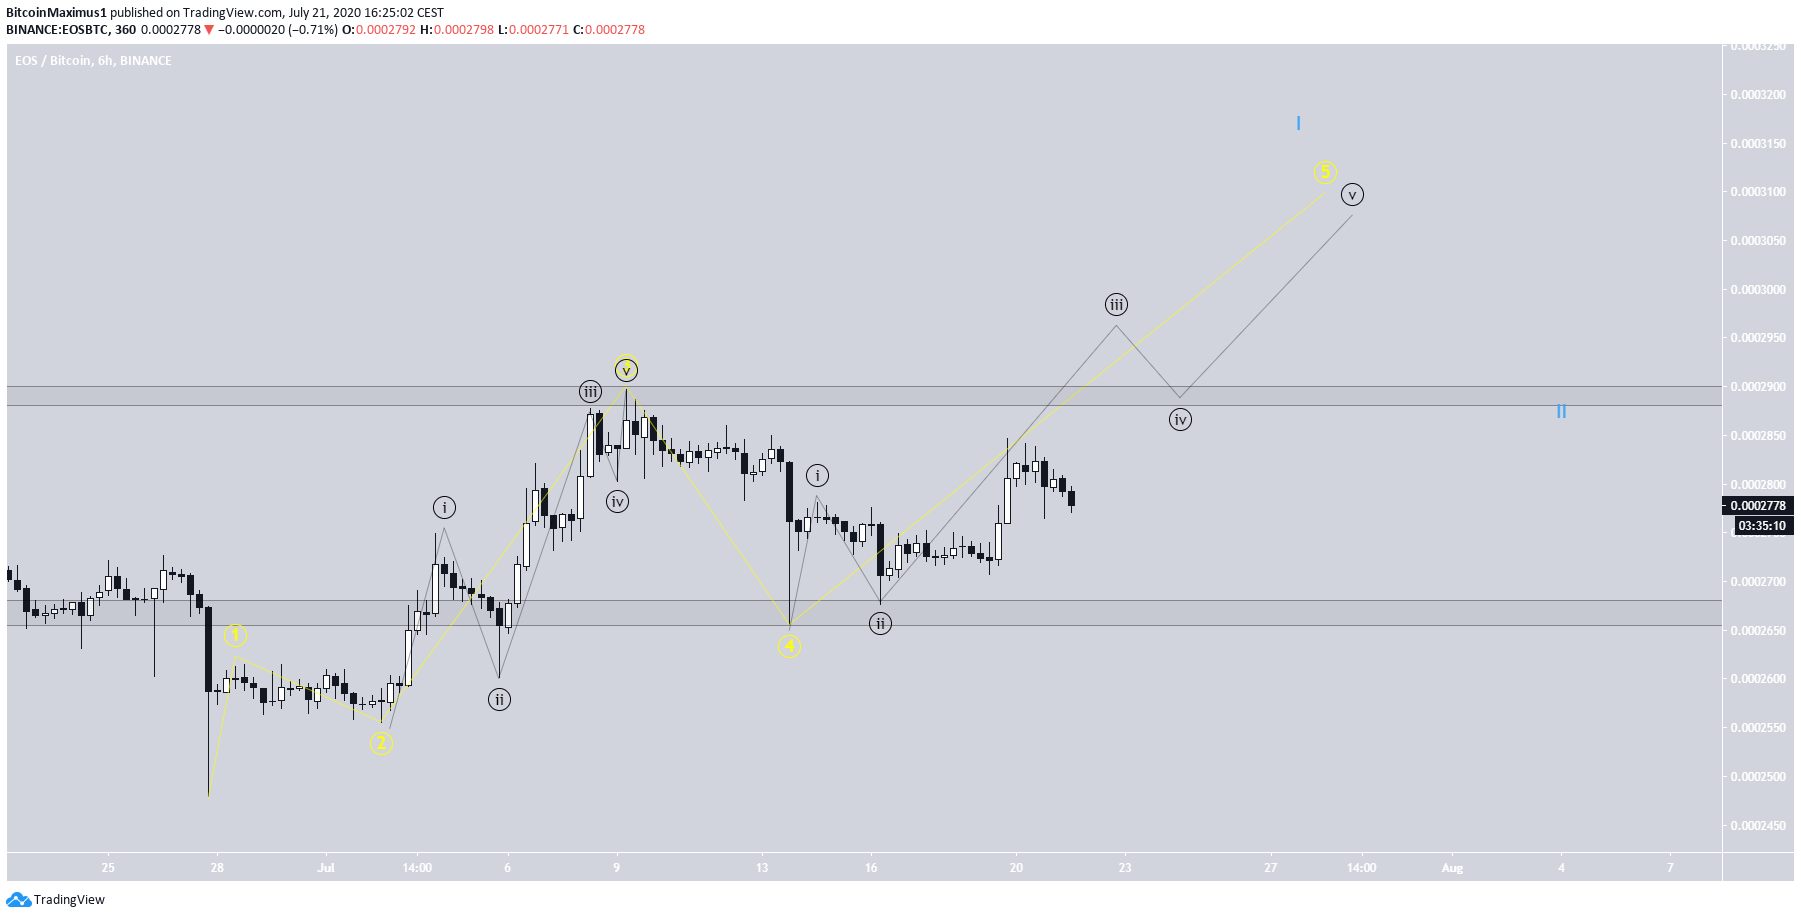
To conclude, the EOS price has likely begun a new bullish trend, which would be confirmed by a breakout above the current trading range.


