
Ethena’s native token, ENA, has extended its month-long winning streak with a 14% surge over the past 24 hours, trading at $0.670 at press time.
The price spike brings ENA’s total monthly gains to over 155%, making it one of the standout performers in the crypto market this July.
ENA’s Market Conviction Strengthens With $1.42 Billion Weekly Volume
On-chain data suggests that ENA’s recent rally is driven by genuine demand rather than short-term speculative hype. According to Santiment, the altcoin’s weekly trading volume has surged by over 700%, reaching $1.41 billion this week—its highest weekly total in over a year.
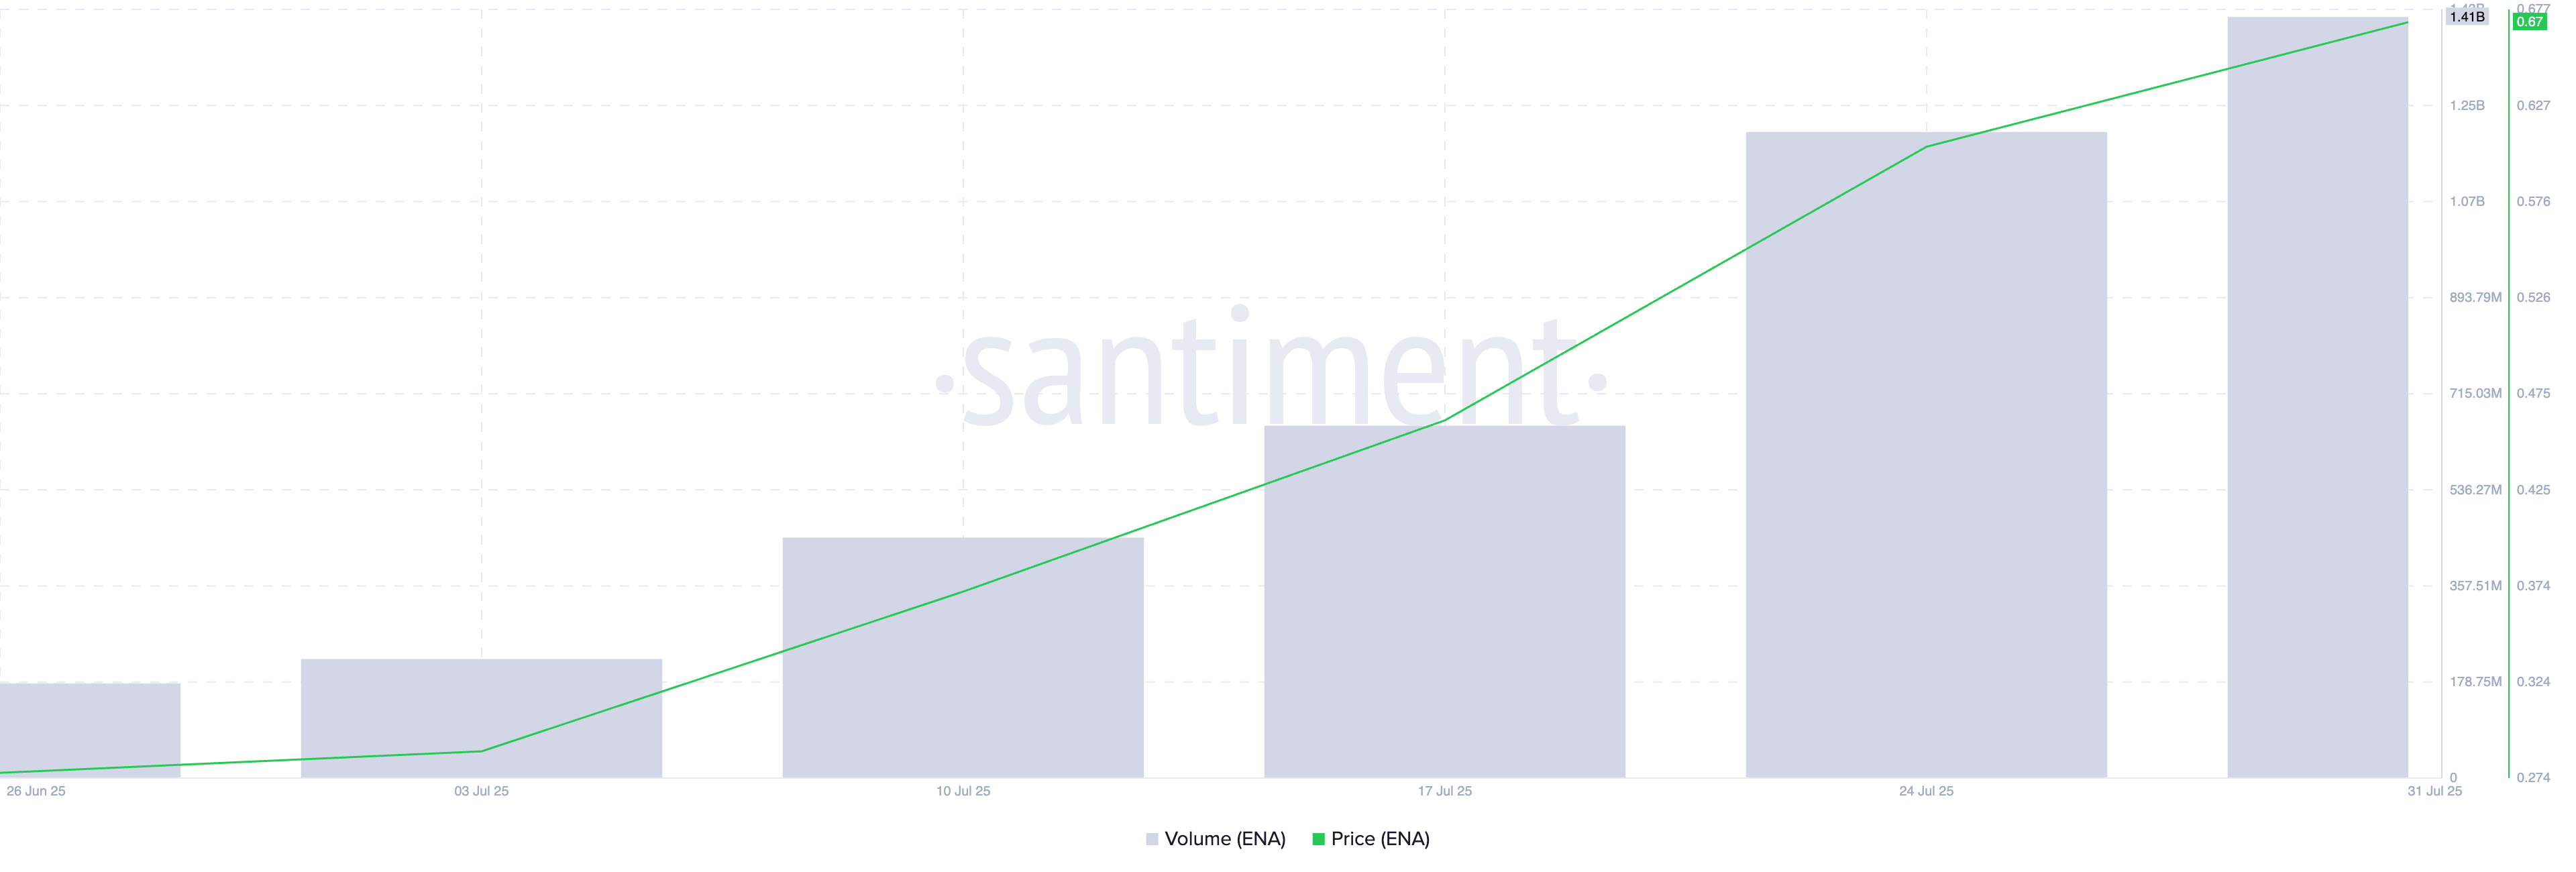
When an asset’s price and trading volume rise sharply, it signals strong market conviction behind the rally. High trading volume means more participants are buying (and selling), which lends credibility to the price movement.
For ENA, the combination of rising prices and soaring volume strengthens the case for a sustained bullish momentum as the market enters a new trading month.
Furthermore, futures market data reflects growing investor confidence. ENA’s open interest has climbed more than 30% in the past 24 hours and stands at $1.15 billion as of this writing.
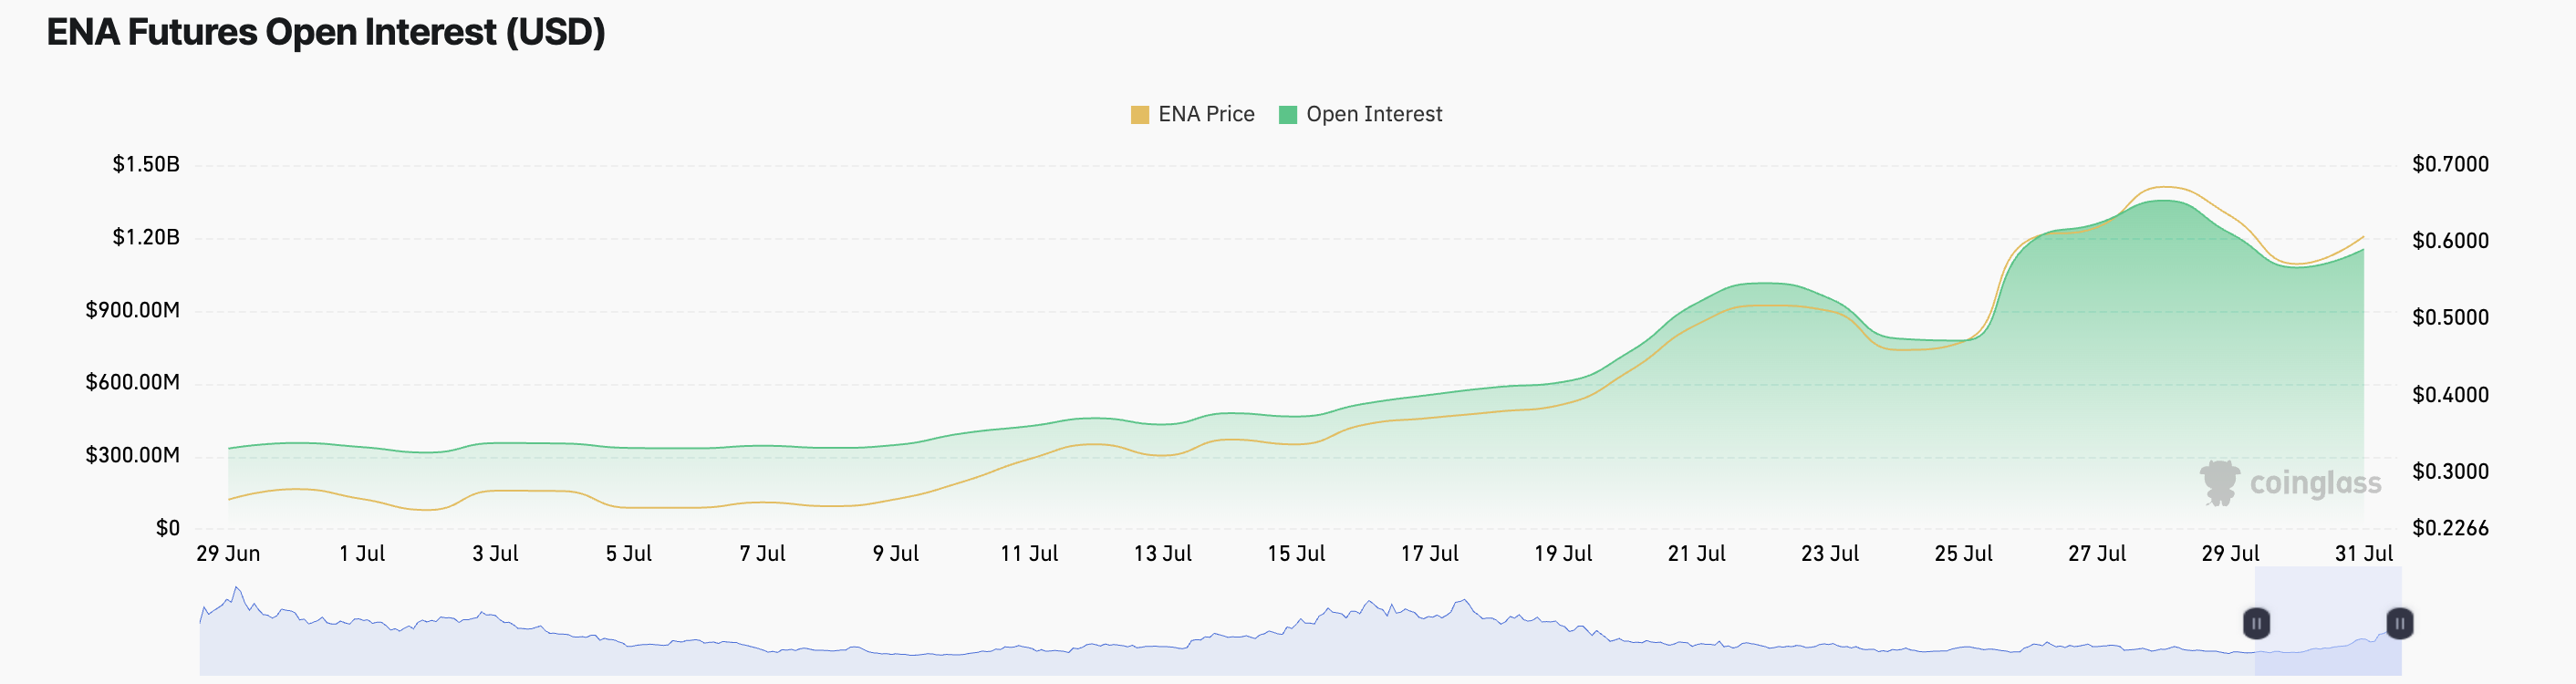
Open interest refers to the total number of outstanding derivative contracts, such as futures or options, that have not yet been settled. When futures open interest rises alongside an asset’s price, new money is flowing into the market, indicating growing bullish sentiment.
In ENA’s case, the 30% jump in open interest suggests that traders are increasingly positioning for further upside.
This trend is reflected in its long/short ratio, which now sits at a monthly high of 1.05, indicating significantly more bullish bets than bearish ones across the derivatives market.
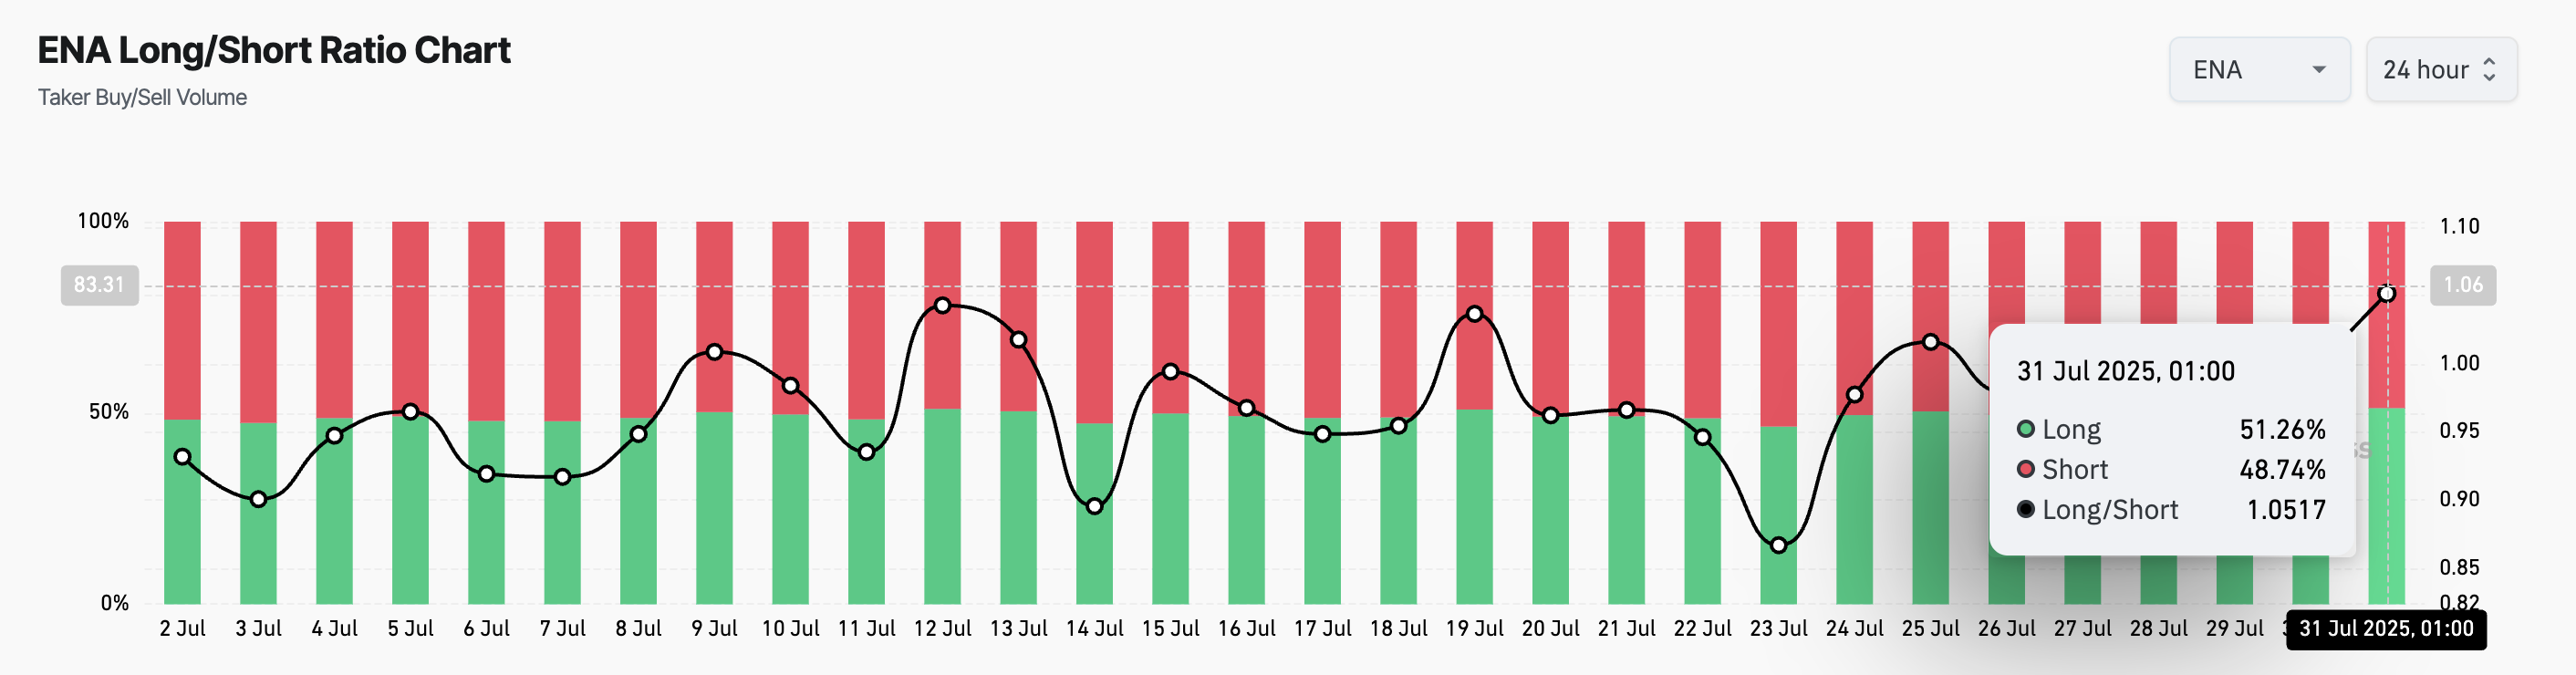
The long/short metric measures the proportion of long bets to short ones in an asset’s futures market. A ratio above one signals more long positions than short ones. This indicates a bullish sentiment, as most traders expect ENA’s value to rise.
ENA Eyes $0.77 as Bullish Indicator Signals Strong Momentum Ahead
Technical indicators also support the case for continued upside. ENA’s Moving Average Convergence Divergence (MACD) remains in a bullish crossover pattern on the daily chart. This happens when an asset’s MACD line (blue) rests above its signal line (orange), a signal often associated with sustained upward momentum.
If current trends persist, ENA could extend its gains and rally to $0.77 over the coming weeks.
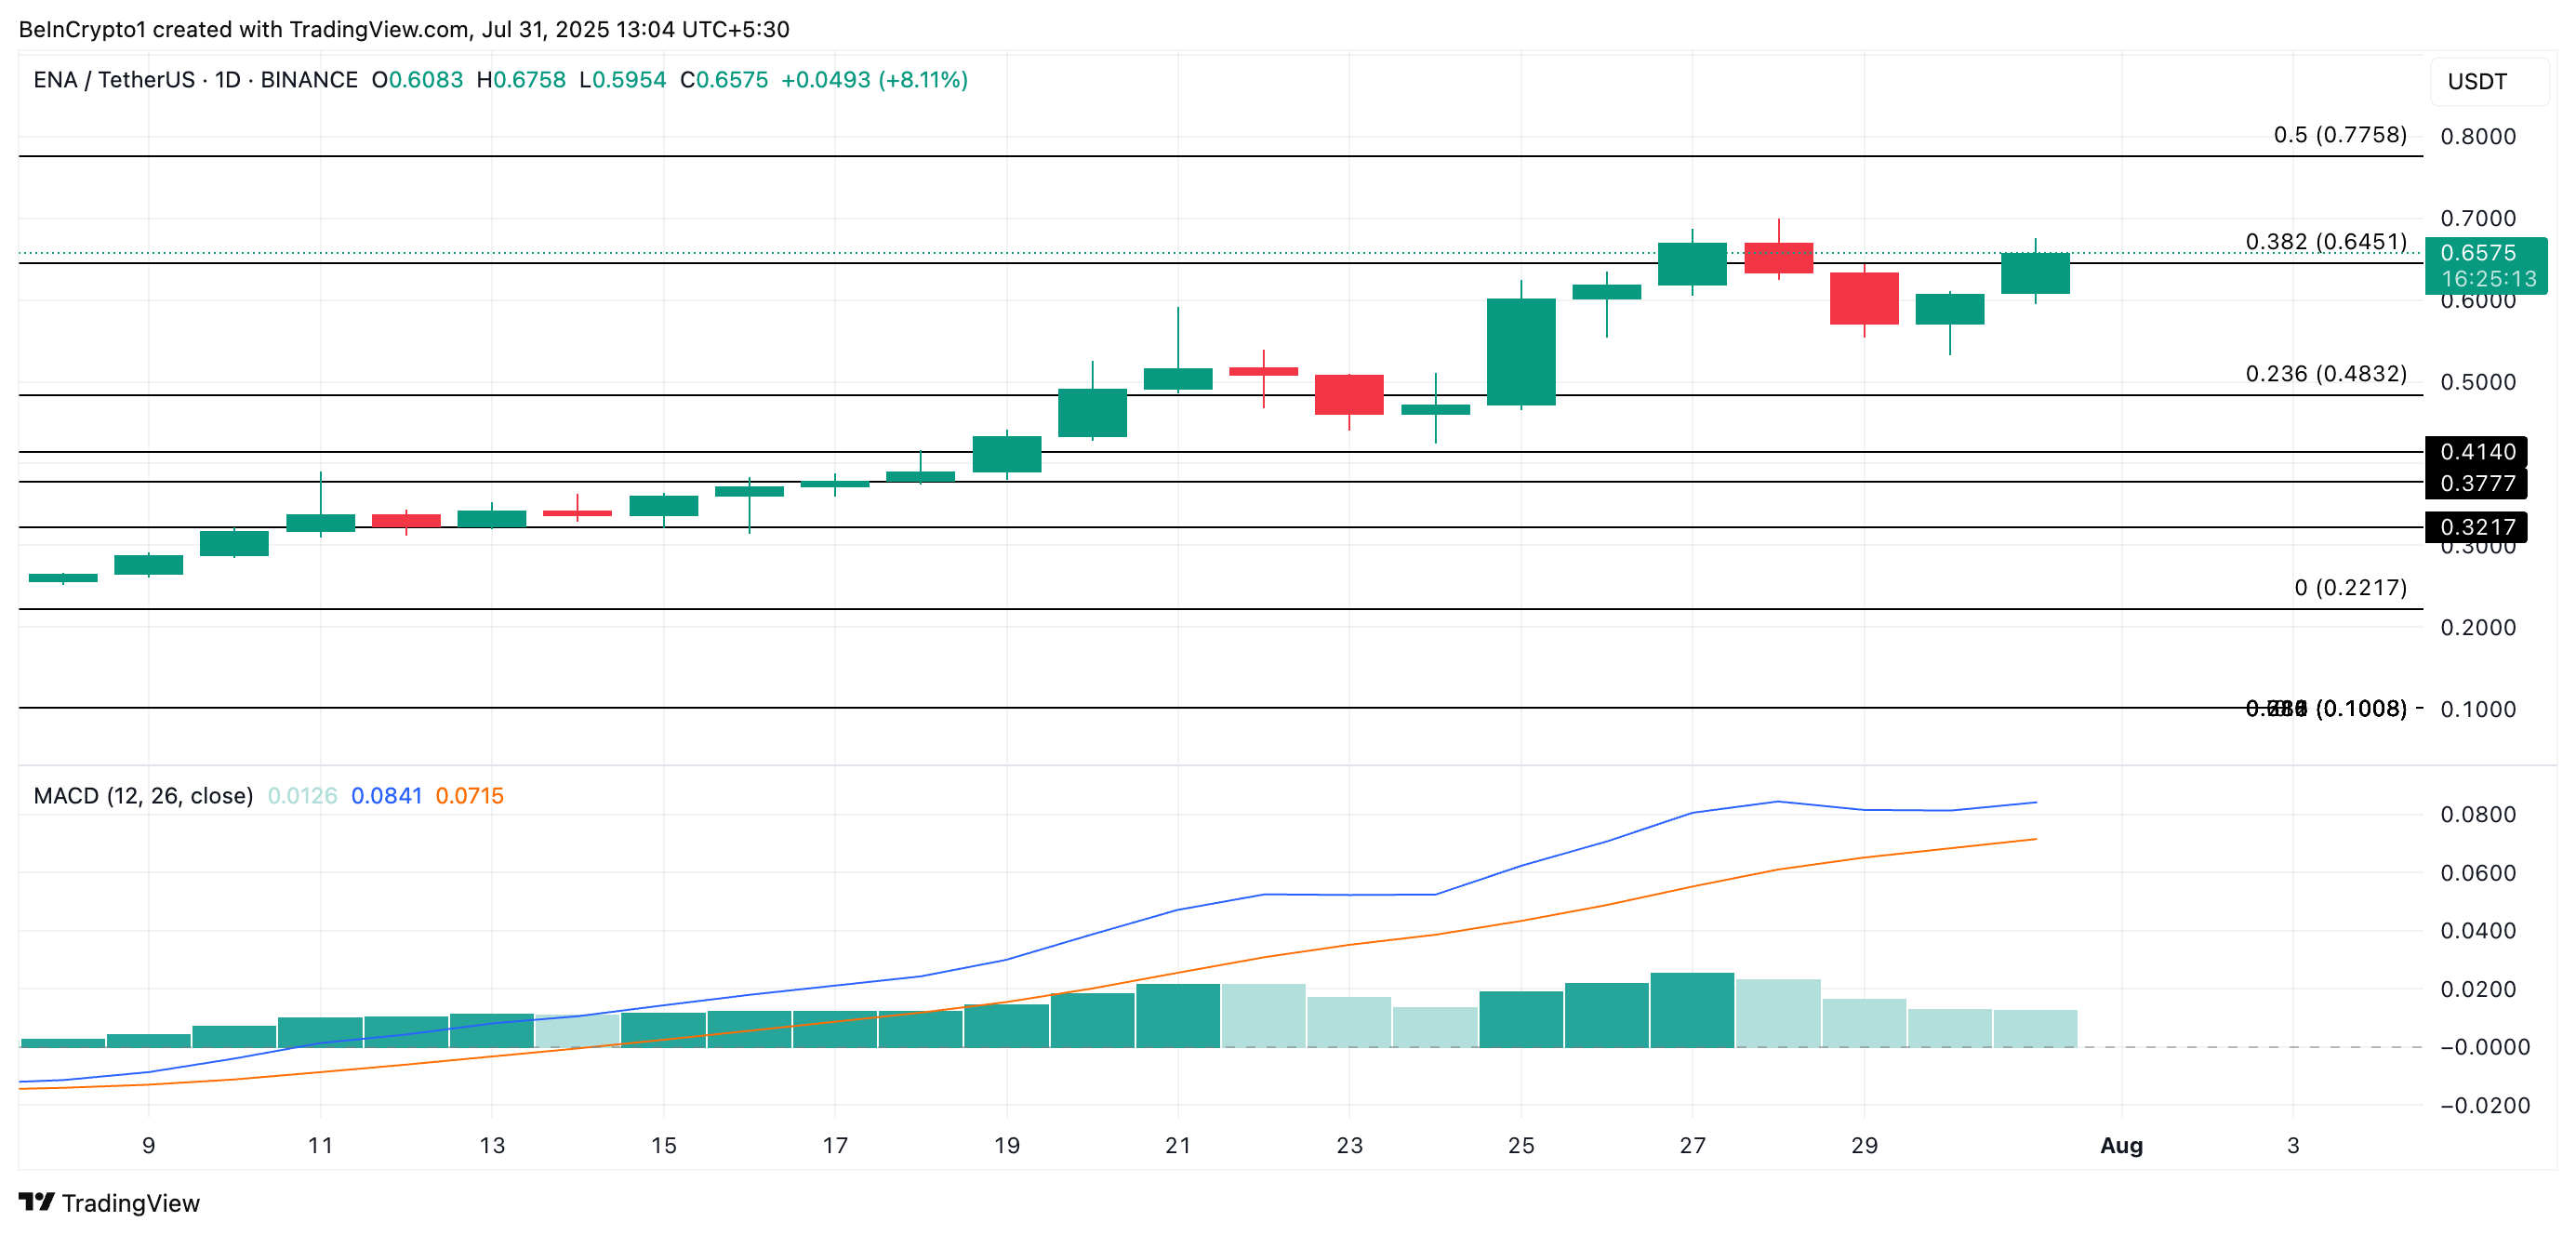
However, if demand falls and the bears regain dominance, they could trigger a price dip below $0.64 and fall toward $0.48.
