


Elrond (EGLD) price is expected to break out from the $56.50 resistance area and accelerate its rate of increase afterward.
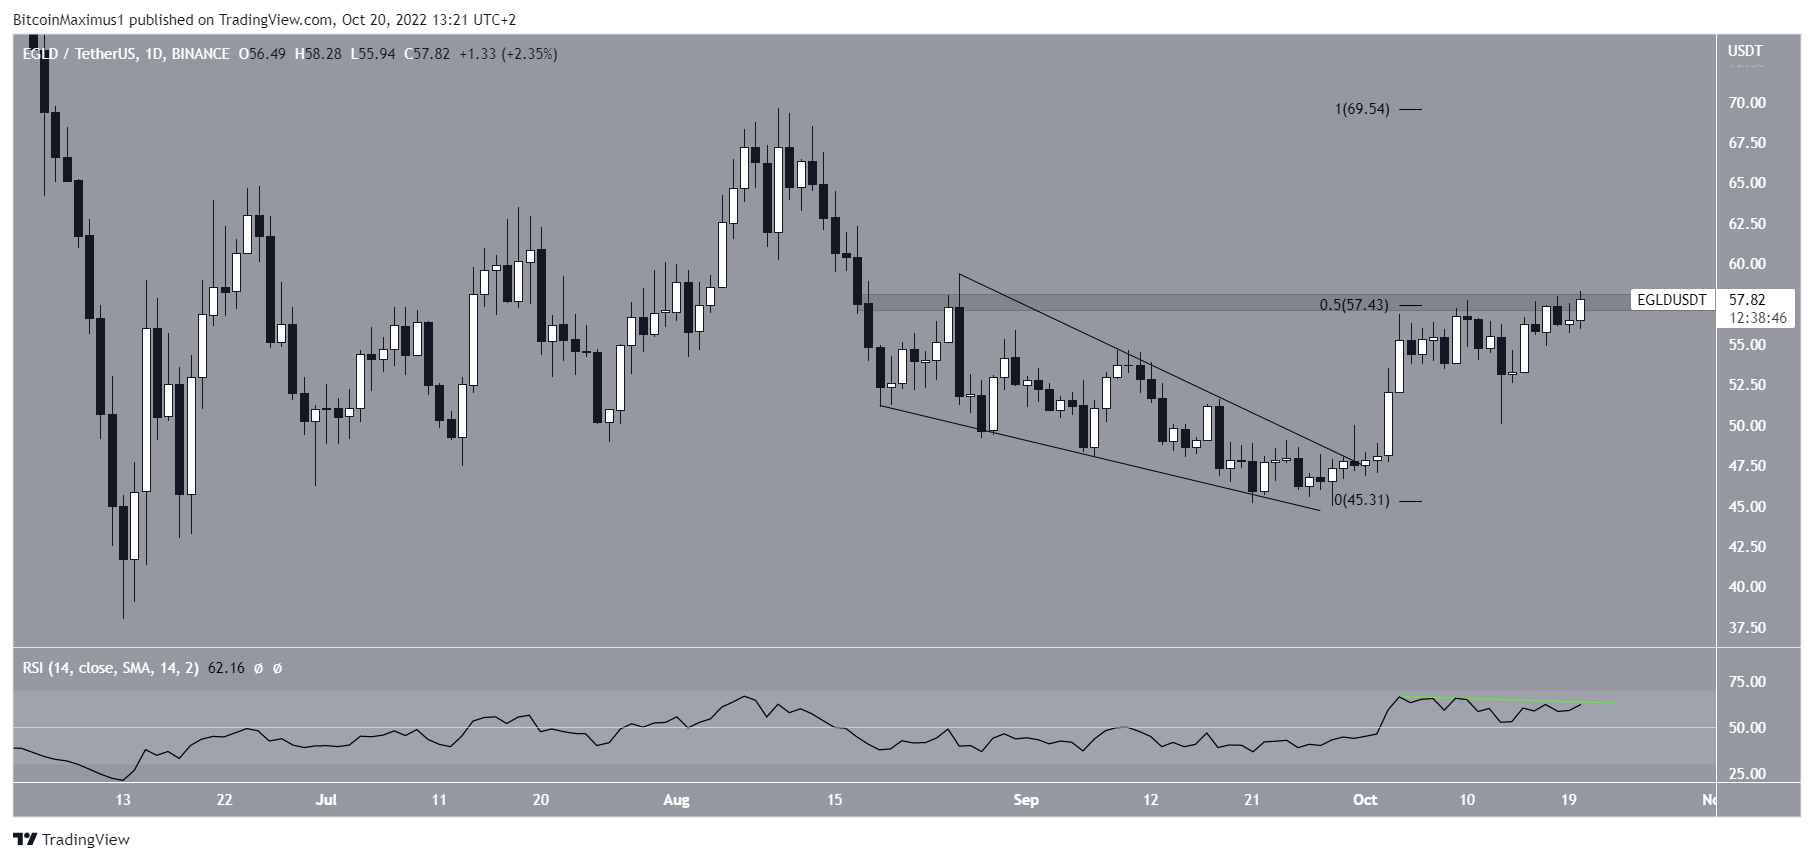
EGLD price has been moving upwards since breaking out from a descending wedge pattern on Sep. 30. Currently, Elrond price is in the process of breaking out from the $57.50 resistance area. Since this is both a horizontal and Fib resistance level, a breakout above it could greatly accelerate the rate of increase.
The daily RSI supports the possibility of an increase since it has moved above 50. However, it is worth mentioning that the indicator is in the process of generating a bearish divergence (green line). If the divergence gets confirmed with an EGLD price rejection, it would be expected to initiate a reversal.
So, whether the Elrond price manages to reach a close above the $57.50 area or gets rejected instead will likely determine the direction of the long-term future movement.
Short-Term Elrond Price Prediction
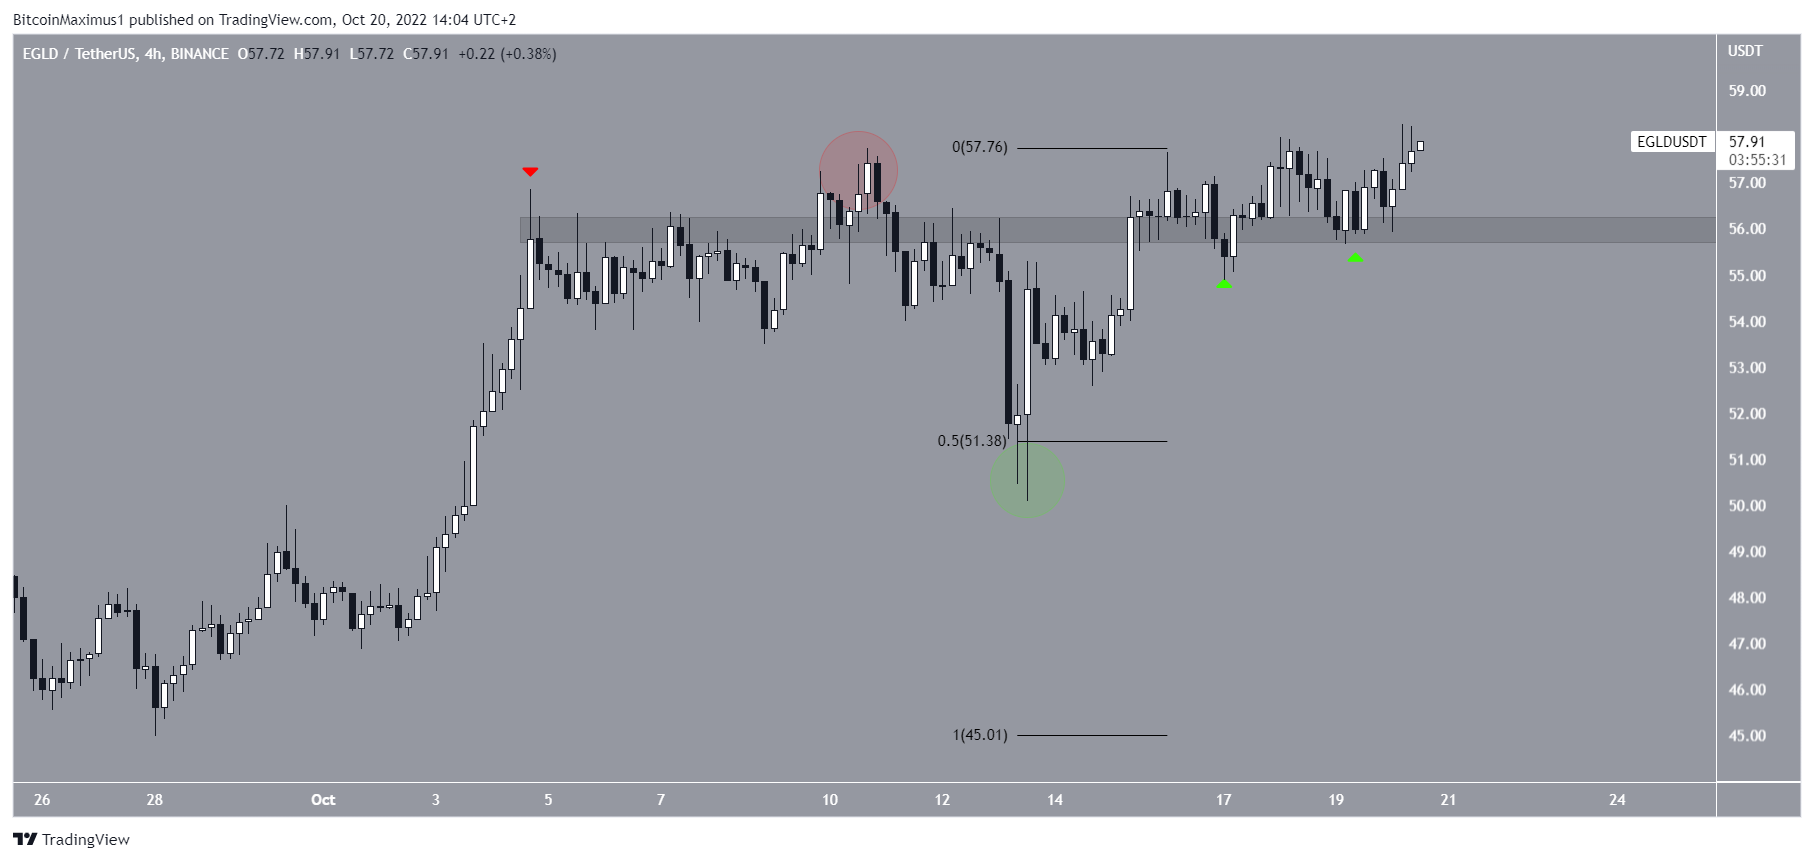
The four-hour chart provides a more bullish outlook. The first reason for this is the significant bounce once the Elrond price fell to the 0.5 Fib retracement support level (green circle). The creation of a very long lower wick afterward is a strong sign of buying pressure.
The second reason is that when zooming in, the main resistance area seems to have been at $56. The area first acted as resistance on Oct. 4 (red icon), before EGLD price deviated above it on Oct. 10.
The ensuing reclaim of the area and its validation as support (green icons) is a sign that the price is expected to break higher and continue increasing.
Future EGLD Price Movement Toward $76
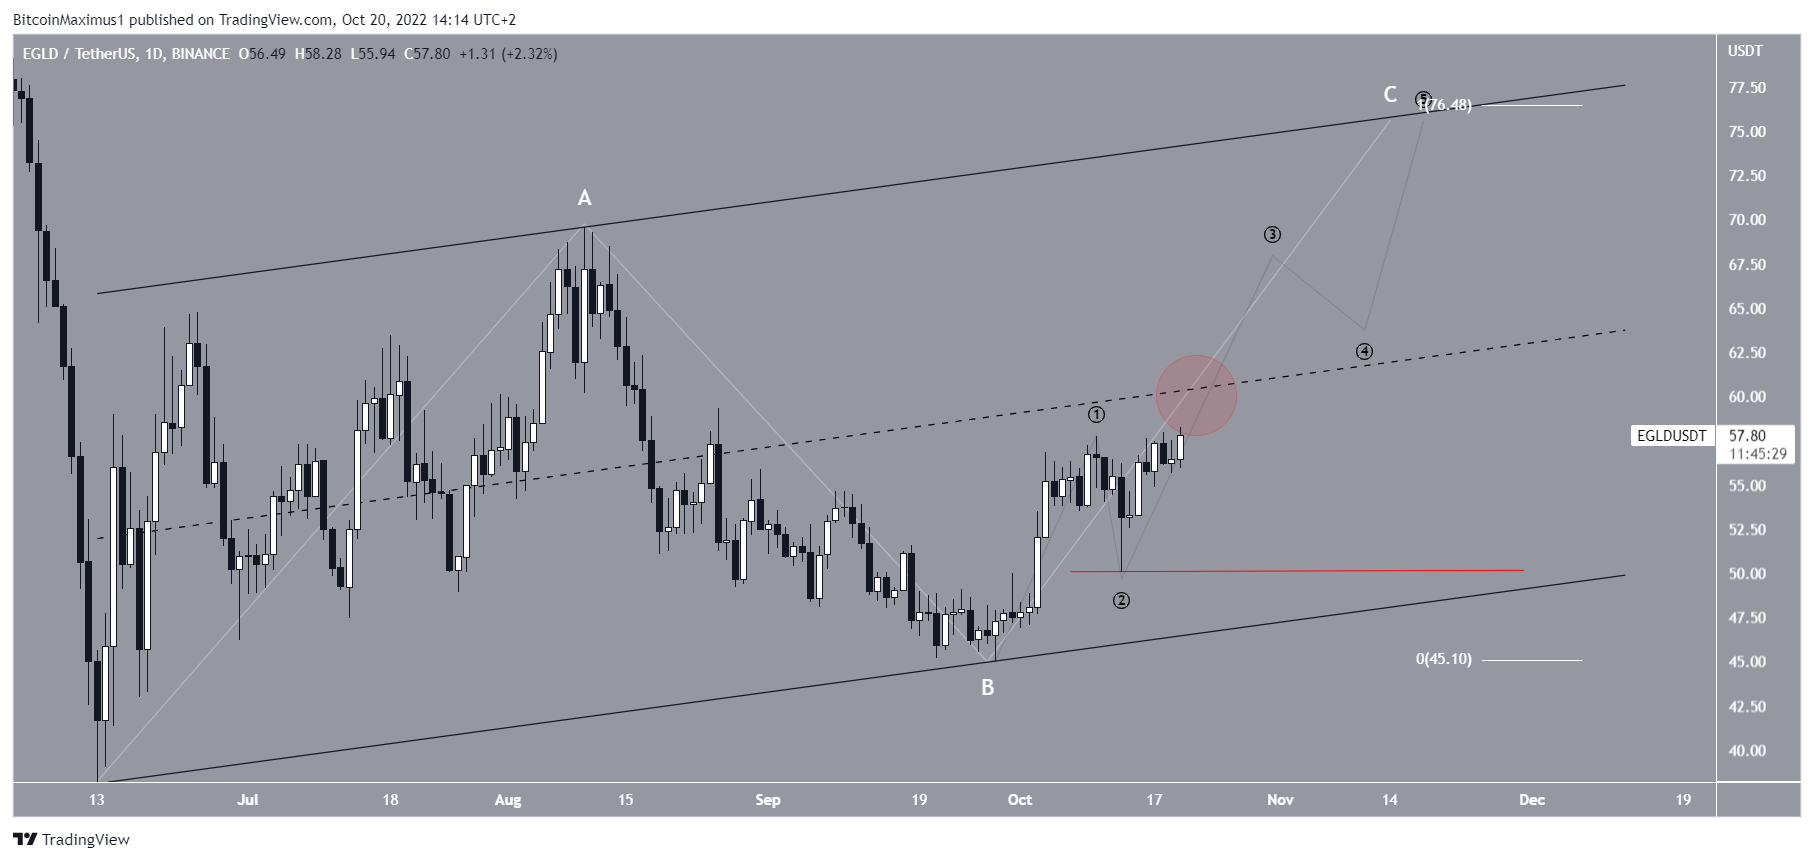
It is possible that the entire upward Elrond price movement since the June 15 lows is an A-B-C structure (white). If so, the price is currently in the C wave. The sub-wave count is given in black.
Giving waves A:C a 1:1 ratio would lead to a future price of $76. This would also validate the resistance line of a channel that has contained the entire upward movement so far.
Currently, ELGD price is in the process of moving above the middle of the channel (red circle). Doing so would go a long way in confirming the scenario.
Conversely, a decrease below the sub-wave two low (red line) would invalidate this EGLD price prediction and suggest that new lows are in store.
For the latest BeInCrypto Bitcoin (BTC) and crypto market analysis, click here
Disclaimer: BeInCrypto strives to provide accurate and up-to-date information, but it will not be responsible for any missing facts or inaccurate information. You comply and understand that you should use any of this information at your own risk. Cryptocurrencies are highly volatile financial assets, so research and make your own financial decisions.
