


The PolkaDot (DOT) price has been increasing rapidly since it reached a bottom on Dec. 23, 2020. On Feb. 3, it reached an all-time high price of $19.87.
DOT has been decreasing since its initial all-time high, however, the correction may be over as it resumes its upward momentum.
First Cycle
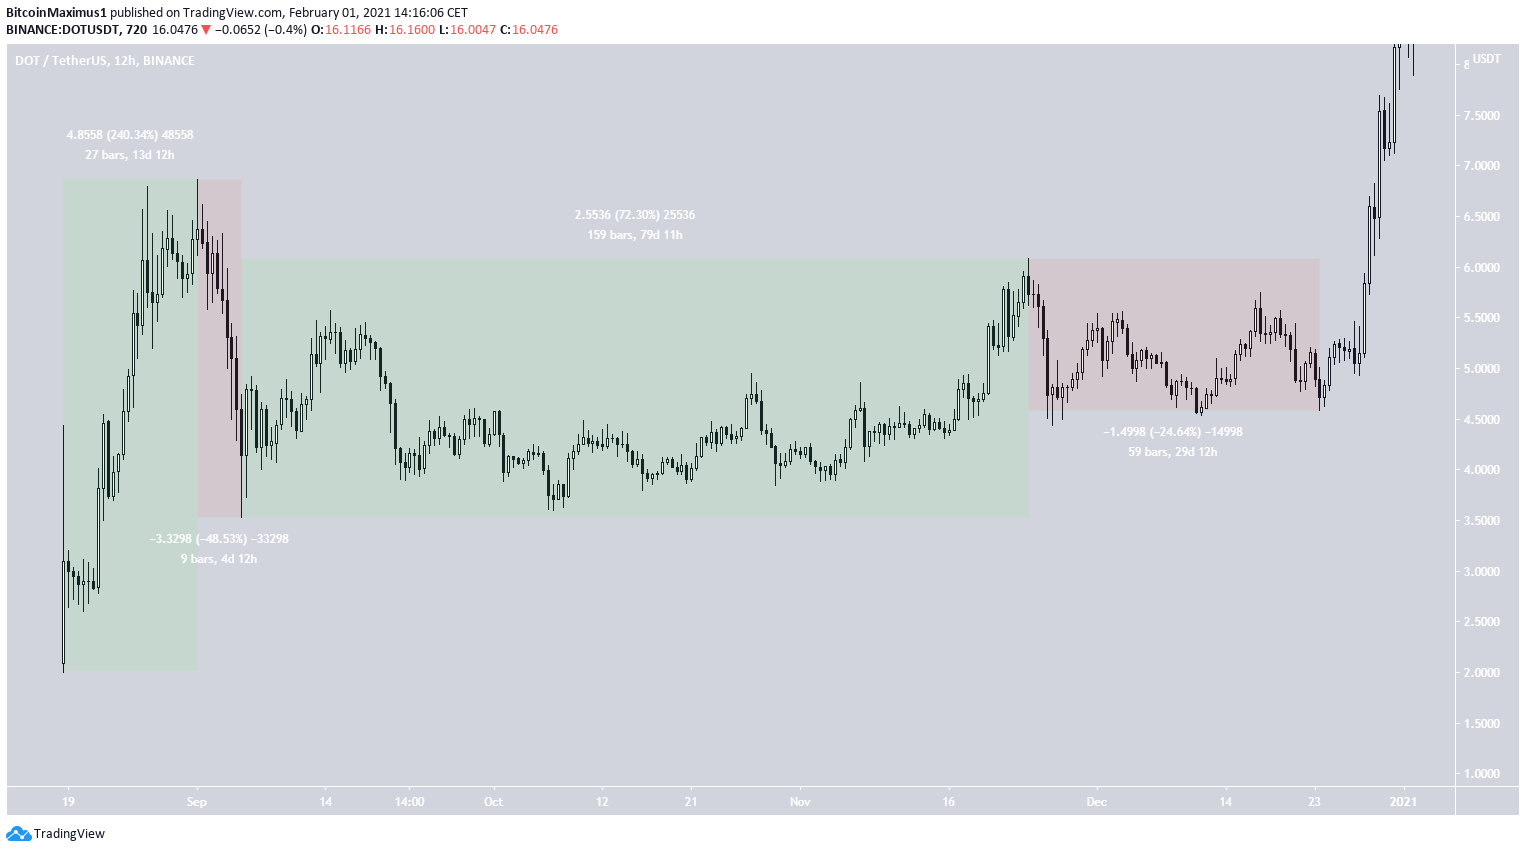
The first significant upward move began on the day of its listing, on Aug. 18, 2020. DOT increased by 240% in a 13 day period, culminating in a high of $6.86 on Sept. 1. However, a sharp drop followed, and DOT fell by 48% over the next four days.
You could consider this its first major cycle, which took place in around 17 days. Afterward, it began a more gradual upward movement, which resulted in a rally of about 72% in a 75 day period.
A more gradual correction followed where DOT declined by 34% in 29 days. Both these periods had deviations of around 1% per day in both directions. After this corrective period ended on Dec. 23, DOT began a rapid upward movement that is still ongoing.
DOT’s Current Movement
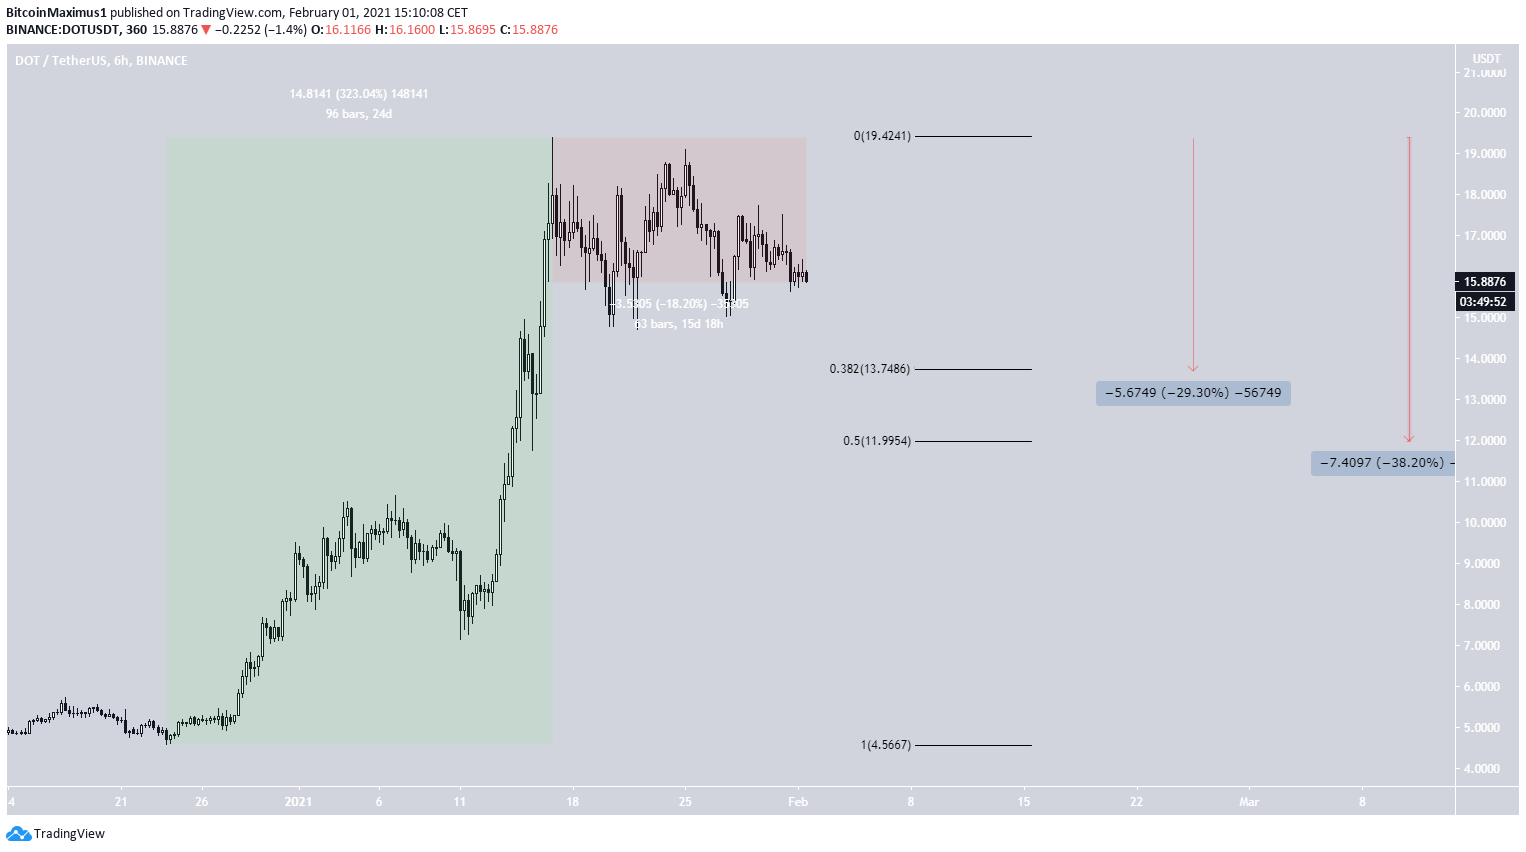
The move since that Dec. 23 low has been a nearly parabolic increase. DOT has rallied by 323% in only 24 days, culminating in an all-time high price of $19.87 on Feb. 3. The rate of increase during this upward move was roughly 15 times faster than during the original rally.
While DOT has been correcting since, it has lost only 18% of its value over the past 15 days. It has yet to reach the 0.382 Fib retracement level of the previous upward move, suggesting that the corrective period will likely continue.
A decrease to the 0.382 Fib retracement level would amount to a drop of around 29% measured from the all-time high, while one to the 0.5 Fib retracement would amount to 38%.
For BeInCrypto’s latest Bitcoin (BTC) analysis, click here


