


The Dogecoin (DOGE) price risks breaking down from a corrective pattern. The Shiba Inu (SHIB) price has broken down from a crucial support level.
Dogecoin Price Fails to Break Out
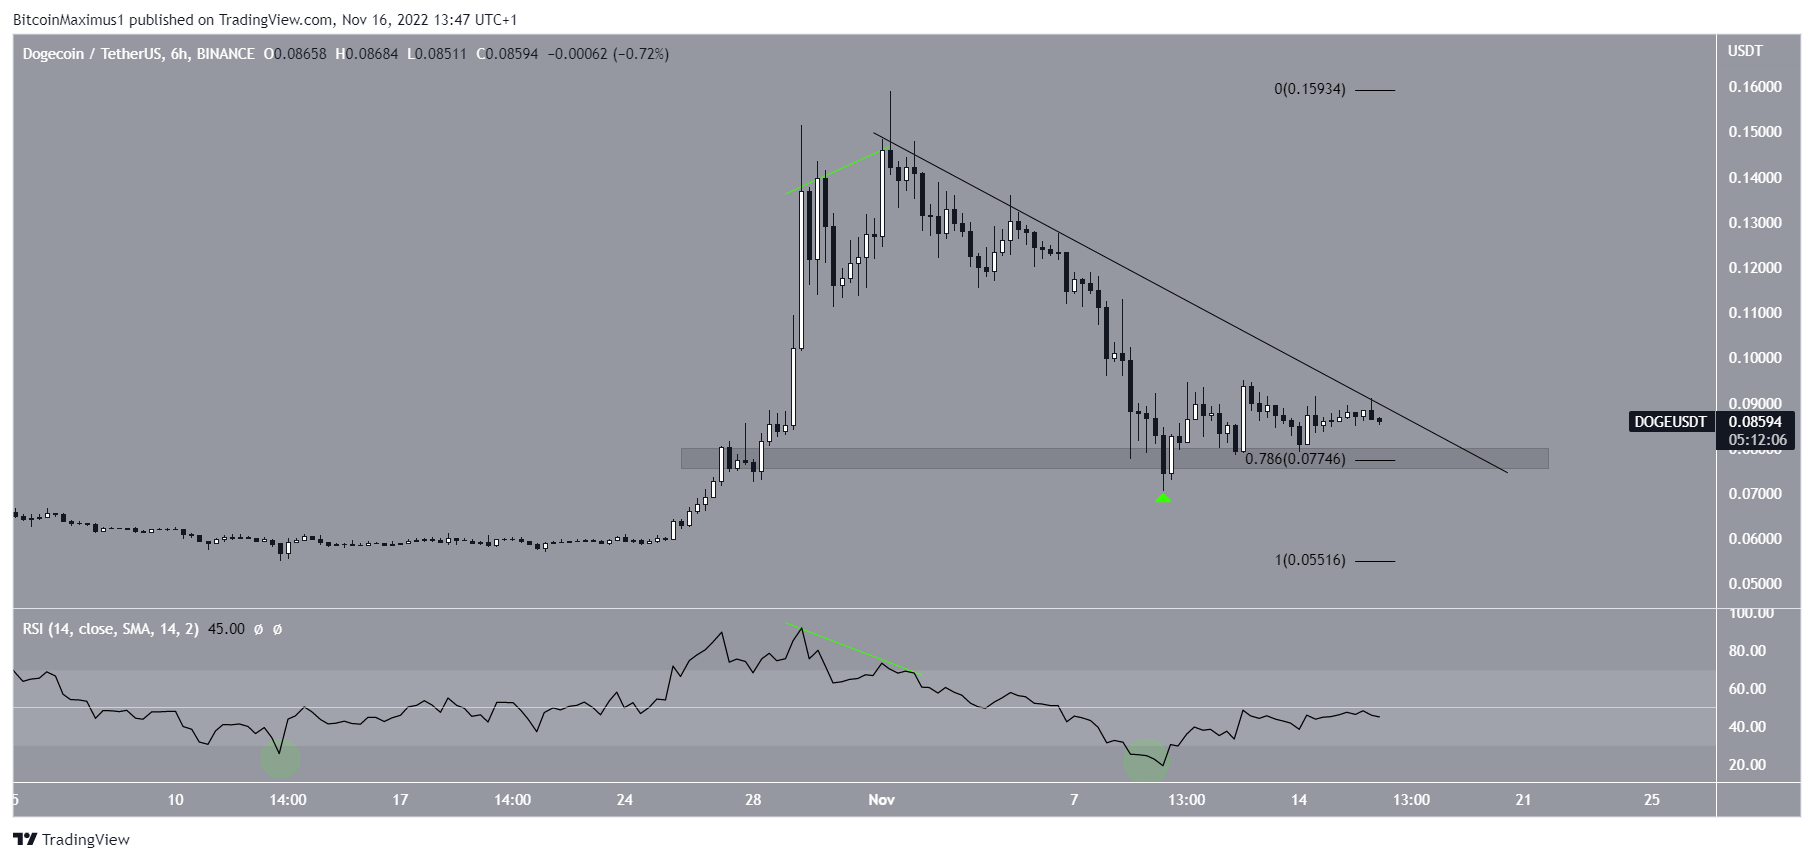
The technical analysis for the DOGE price shows that it has fallen underneath a descending resistance line since Nov. 1. At the time, it had just created a double top pattern, combined with bearish divergence in the RSI.
The drop led to a low of $0.07 on Nov. 9. Afterward, the Dogecoin price bounced (green icon), validating the $0.07 area as support. This is the 0.786 Fib retracement support level and a horizontal support area.
It is worth noting that the Nov. 9 low coincided with an extremely oversold level in the six-hour RSI (green circle).
Currently, the Dogecoin price is trading right at the descending resistance line. Whether it breaks out or gets rejected will likely determine the direction of the future trend. A breakdown from the $0.077 area could cause a drop to $0.055, while a breakout would take the DOGE price above $0.10.
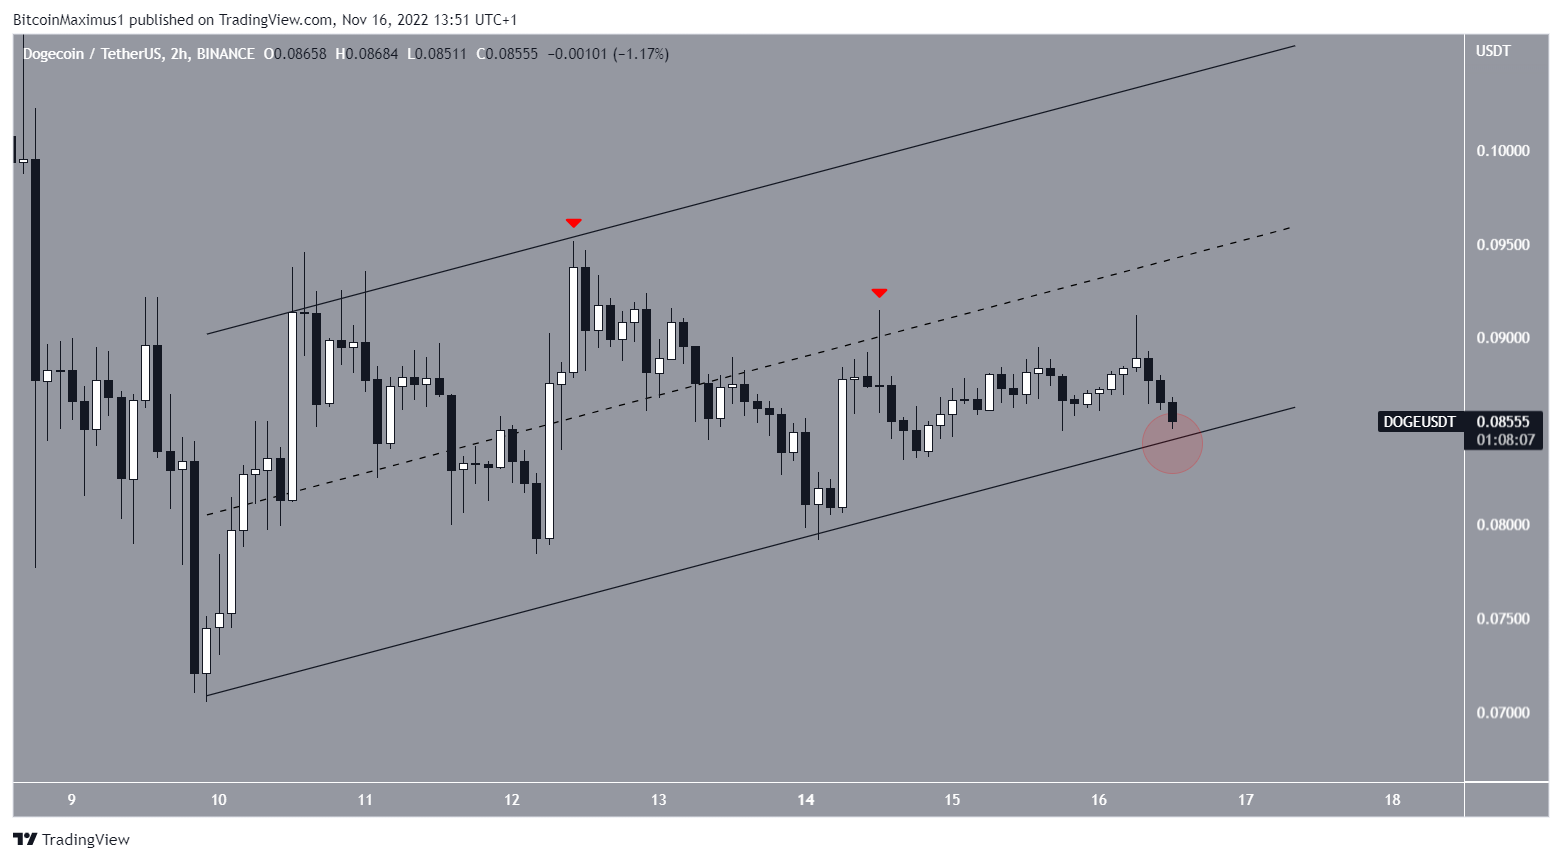
The short-term two-hour chart supports the possibility of a breakdown. The Dogecoin price is trading inside an ascending parallel channel, which is considered a bearish pattern.
Furthermore, it has been rejected by its resistance and midlines (red icons). Currently, the DOGE price is in the process of breaking down from its support line. Doing so would trigger the aforementioned drop toward $0.055.
Shiba Inu Price Breaks Down From Key Level
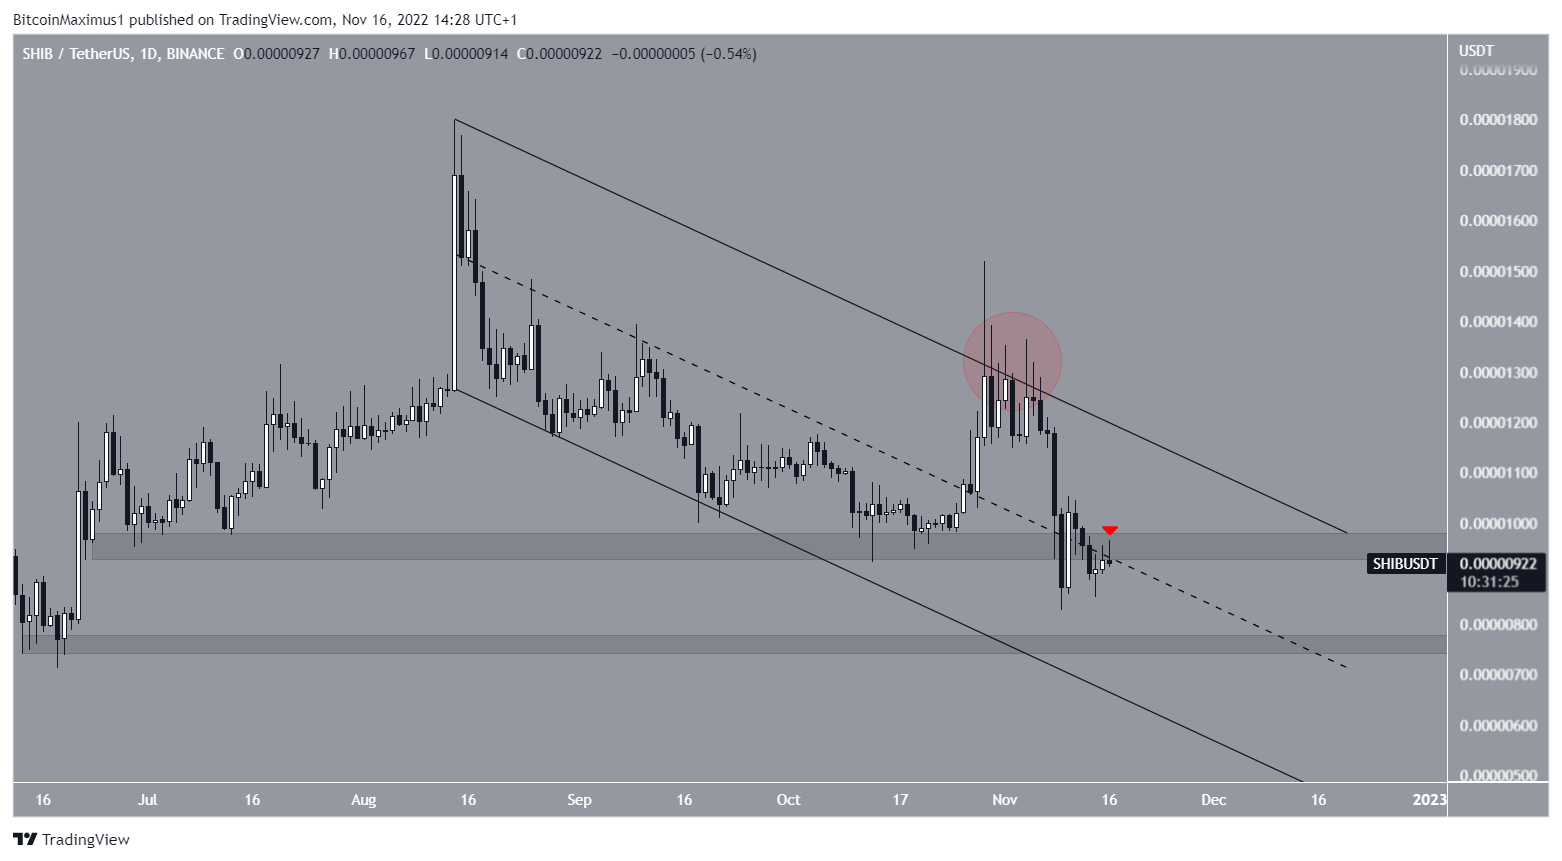
The Shiba Inu price has decreased inside a descending parallel channel since Aug. 14. It was rejected by its resistance line numerous times between Oct. 27 and Nov. 9 before beginning the current decrease. While trading inside the channel, the highest price reached was $0.000015.
The price of SHIB fell to a low of $0.0000082 on Nov. 9. This caused a breakdown from both the $).00000096 support area and the middle of the channel. Therefore, it is an extremely bearish development. The area rejected the Shiba Inu price over the past 24 hours (red icon).
So, unless it reclaims this level, the trend is considered bearish. The next closest support area is at $0.000076.
For BeInCrypto’s latest Bitcoin (BTC) analysis, click here.
Disclaimer: BeInCrypto strives to provide accurate and up-to-date information, but it will not be responsible for any missing facts or inaccurate information. You comply and understand that you should use any of this information at your own risk. Cryptocurrencies are highly volatile financial assets, so research and make your own financial decisions.


