


In the period from October to December 2017, the price of Dogecoin was trading near 20 satoshis. A rapid upward move ensued, and the DOGE price reached a high above 110 satoshis the next month. After a decrease, the price reached a similar level on September 2018.
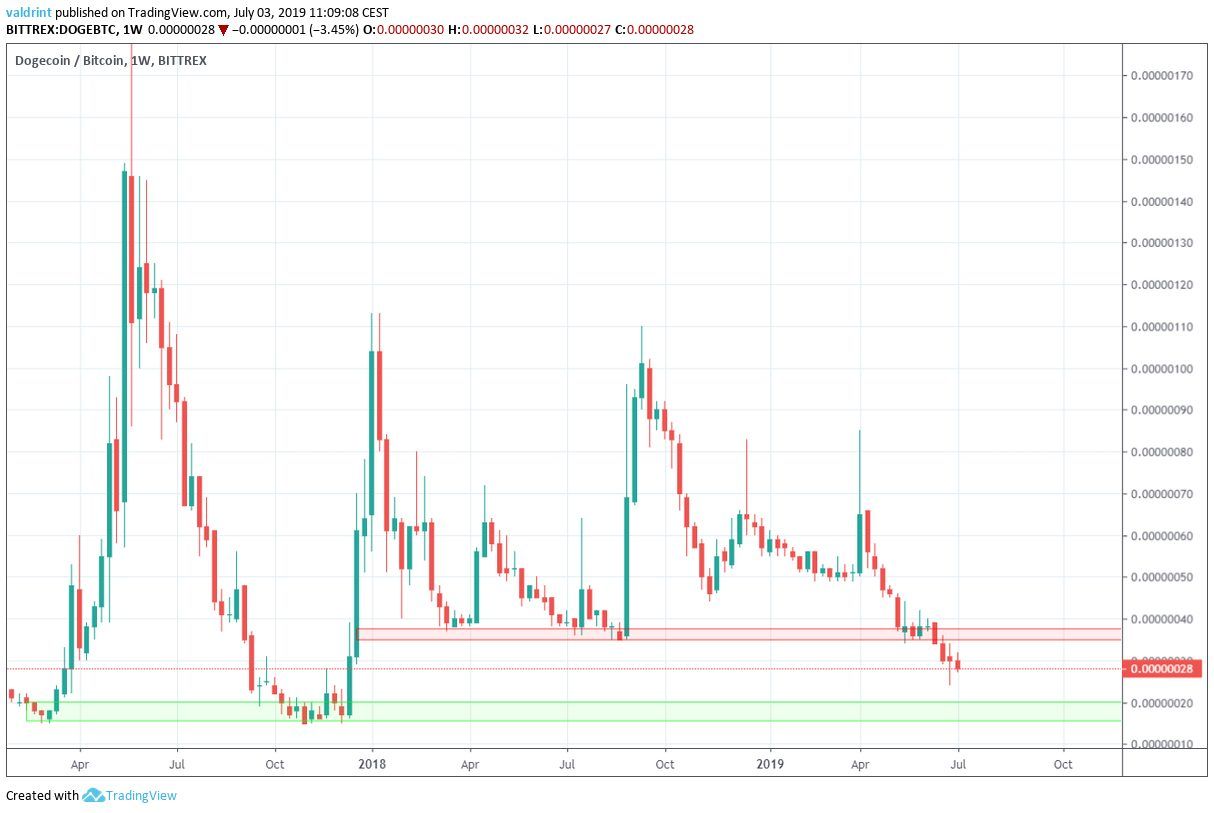
Since then, however, the DOGE price has been decreasing. It has fallen below the 35 satoshi support level and is heading towards 20.
Will the price reach that area or will it reverse before it does? Let’s find out!
For our previous analysis, please click here.
For our video analysis, please click below:
If you are interested in trading Bitcoin (BTC), Ethereum (ETH), Litecoin (LTC), Bitcoin Cash (BCH) and/or XRP on our partner exchange, follow this link to get all signed up on XCOEX.
Dogecoin Price: Trends and Highlights for July 3
- The DOGE price is trading above the main support area near 20 satoshis.
- There is bullish divergence developing in the RSI and the MACD.
- The price is struggling to break out above the moving averages.
DOGE Price in a Descending Channel
Since the beginning of May, the price of DOGE has been trading inside the descending channel outlined below.
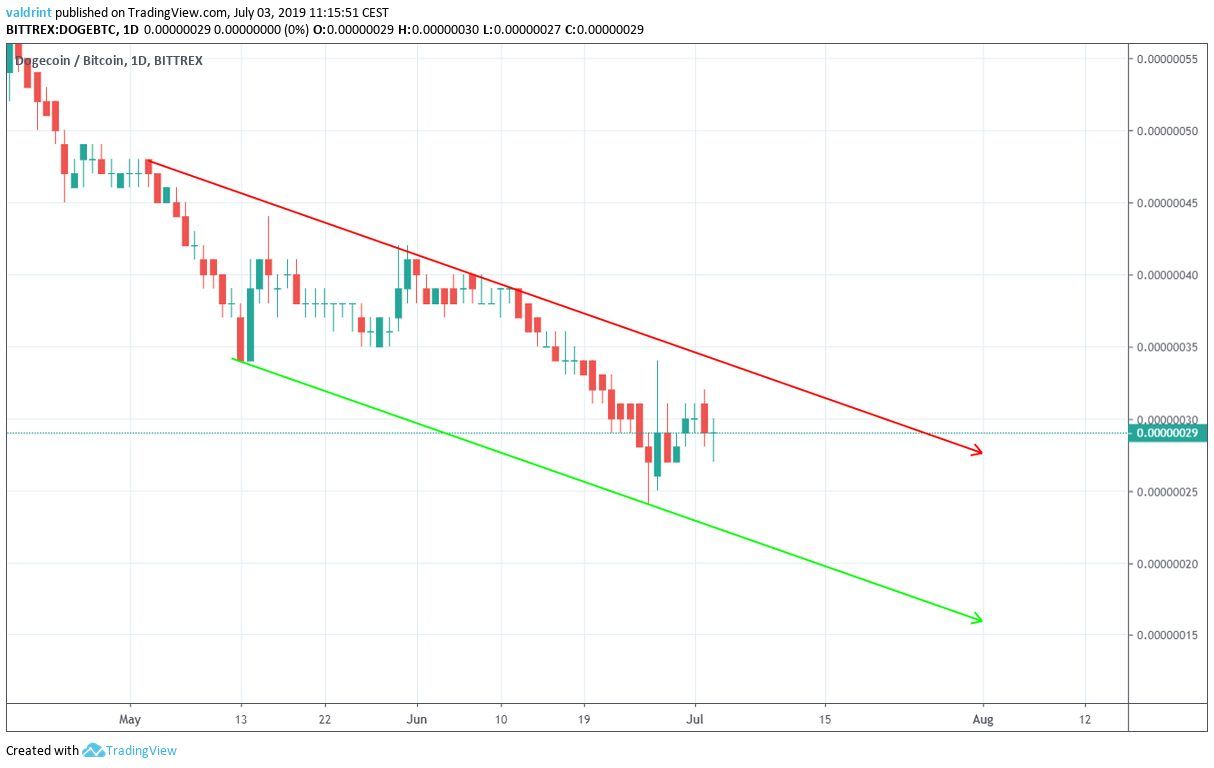
After touching the support line on June 21, an upward move began.
At the time of writing, the DOGE price is trading in the middle of the channel, after failing to reach the resistance line.
Technical Indicators
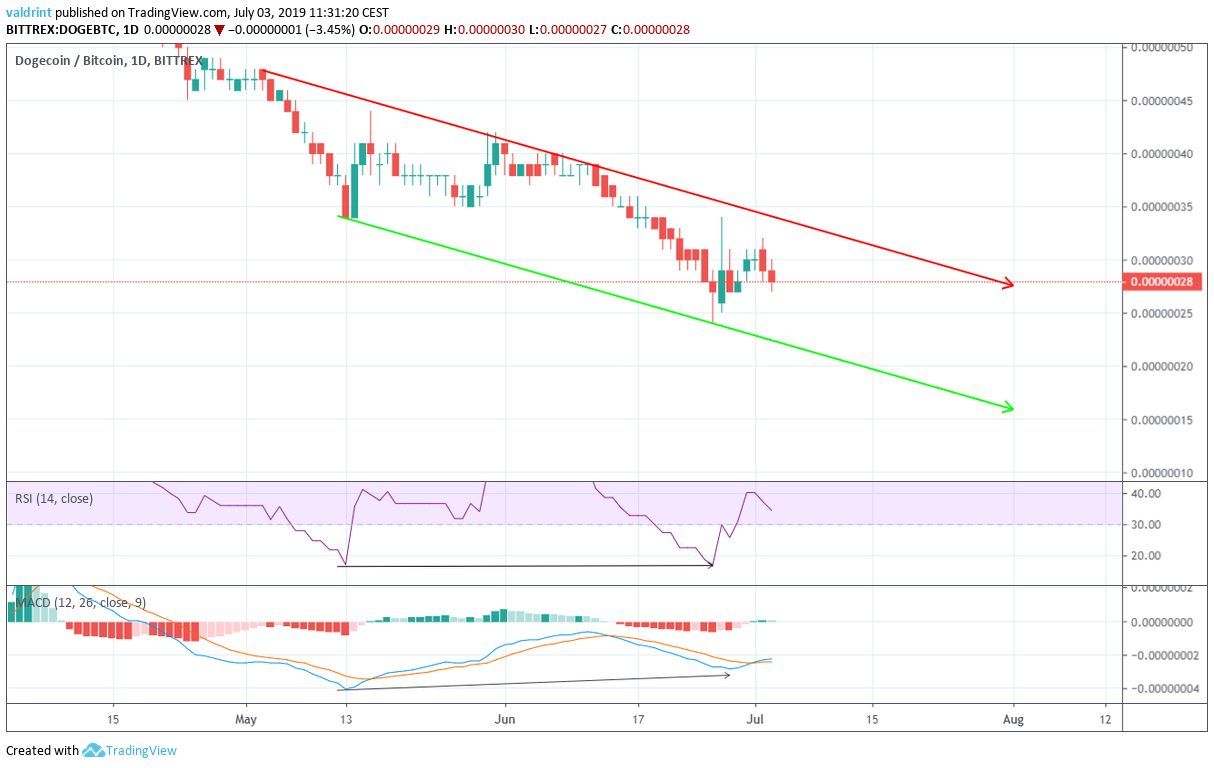
During this time, however, both the RSI and the MACD have generated higher values. This is known as bullish divergence and often precedes price increases. However, it is not very significant in value, and it is occurring in a neutral pattern.
It is possible that it will initiate a breakout from the channel.
However, it is more likely that the price again touches the support line of the channel, most likely near 20 satoshis around July 10 and possibly creates a more significant divergence. That would be a more positive sign that a breakout will occur.
A look at the moving averages shows the failed attempt at a breakout in more detail:
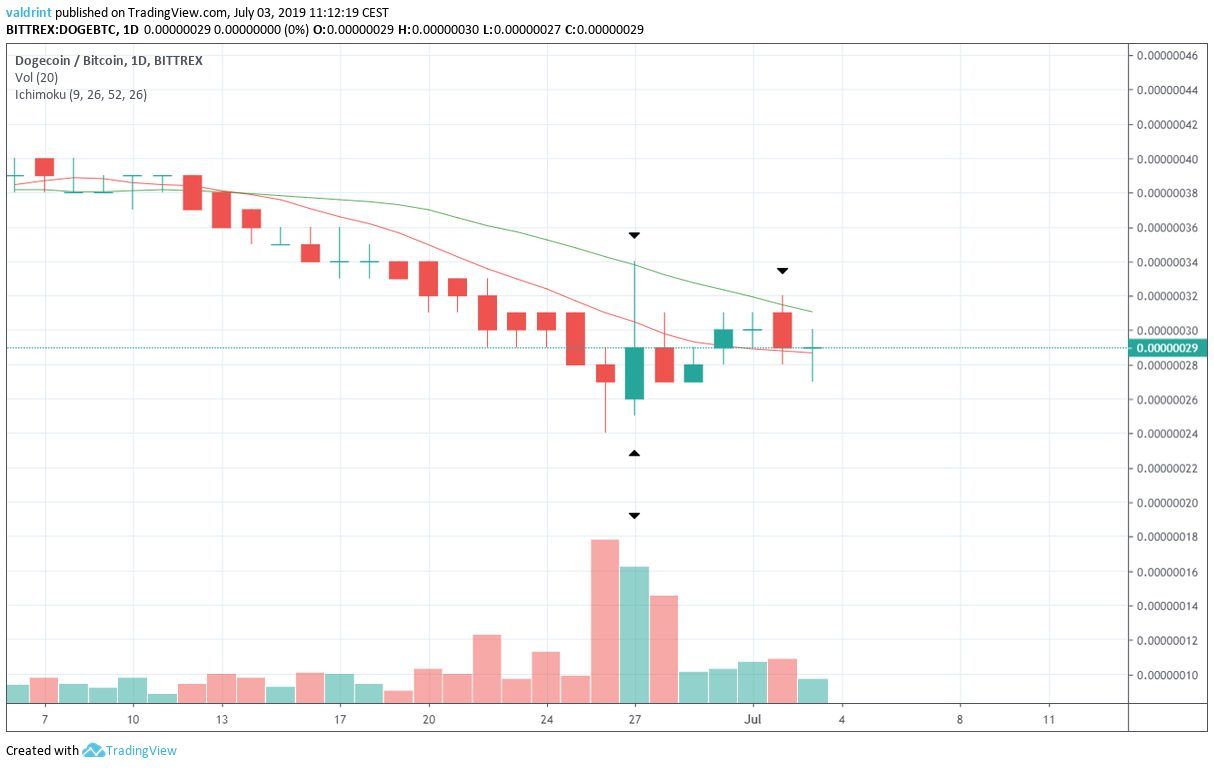
The daily candle of June 27 made an attempt at a breakout. However, it reached the 20-day MA before being pushed down and creating an inverted hammer. This movement transpired with significant volume.
When found in a downtrend, an inverted hammer is a bullish candlestick.
Afterward, it gradually increased above the 10-day MA, before again finding resistance at the 20-day MA.
A breakout above this moving average would be a sign that an uptrend may begin. If a bullish cross occurs afterward, it could serve as confirmation for the uptrend.
Summary
The price of DOGE recently broke down below a significant support area.
It is currently trading inside a descending wedge and has developed significant bullish divergence in the RSI and the MACD.
The moving averages are leaning towards turning bullish, but have not yet done so.
Do you think the Dogecoin price will break out from the wedge? Let us know in the comments below.
Disclaimer: This article is not trading advice and should not be construed as such. Always consult a trained financial professional before investing in cryptocurrencies, as the market is particularly volatile.
Images are courtesy of Shutterstock, TradingView.


