


The Dogecoin (DOGE) price has broken out from a bullish pattern that had been in place since July. It will likely continue rallying towards the resistance areas outlined below.
Breakout From Long-Term Pattern
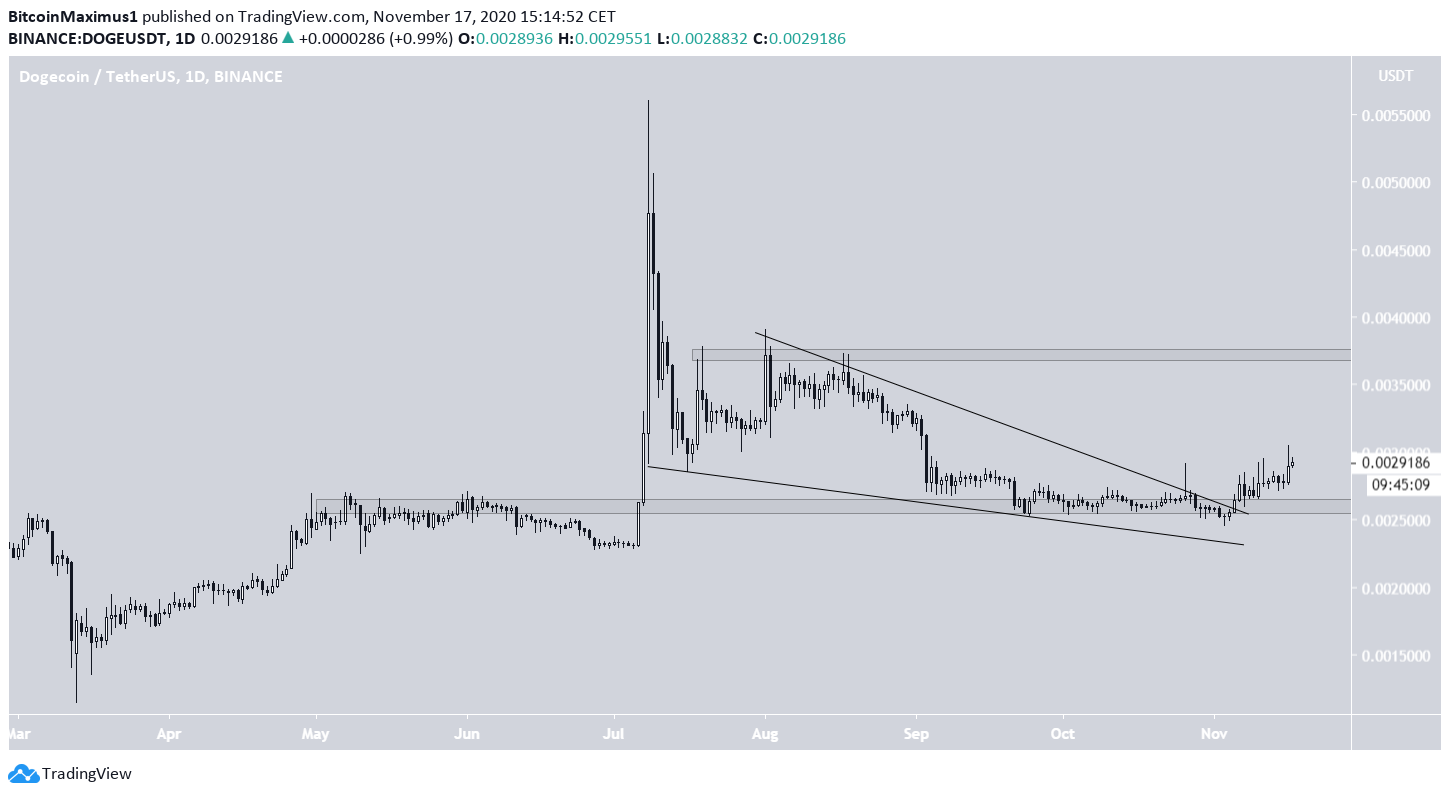
The DOGE price has been moving downwards since a rapid rise took it to $0.0056 on Jul 8. Since Jul 16, the price has been trading inside a descending wedge.
After reaching the $0.0026 support area and validating it twice, the price began to rally and broke out from the wedge on Nov 5, beginning an upward move that is still ongoing.
The closest resistance area is at $0.0037, a horizontal resistance level and the top of the descending wedge.
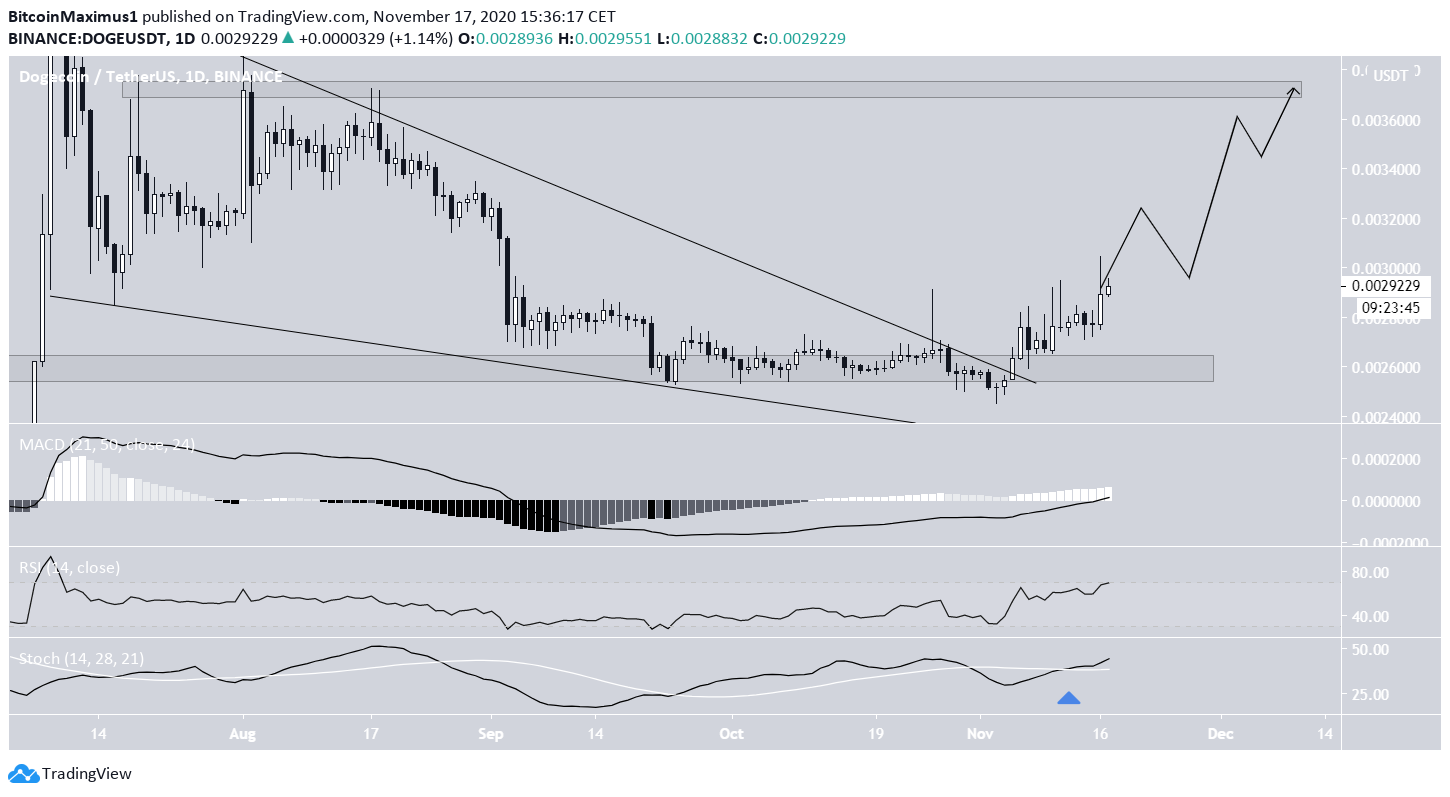
Technical indicators on the daily time-frame are bullish and support the idea:
- The MACD is increasing and is above 0.
- The RSI is increasing and is above 50.
- The Stochastic Oscillator is increasing and has made a bullish cross.
Therefore, the price should eventually reach the previous resistance area at $0.037.
Short-Term Movement
Cryptocurrency trader @ColdBloodShill tweeted a 6-hour DOGE chart, which shows that the price has broken out from a minor resistance area.
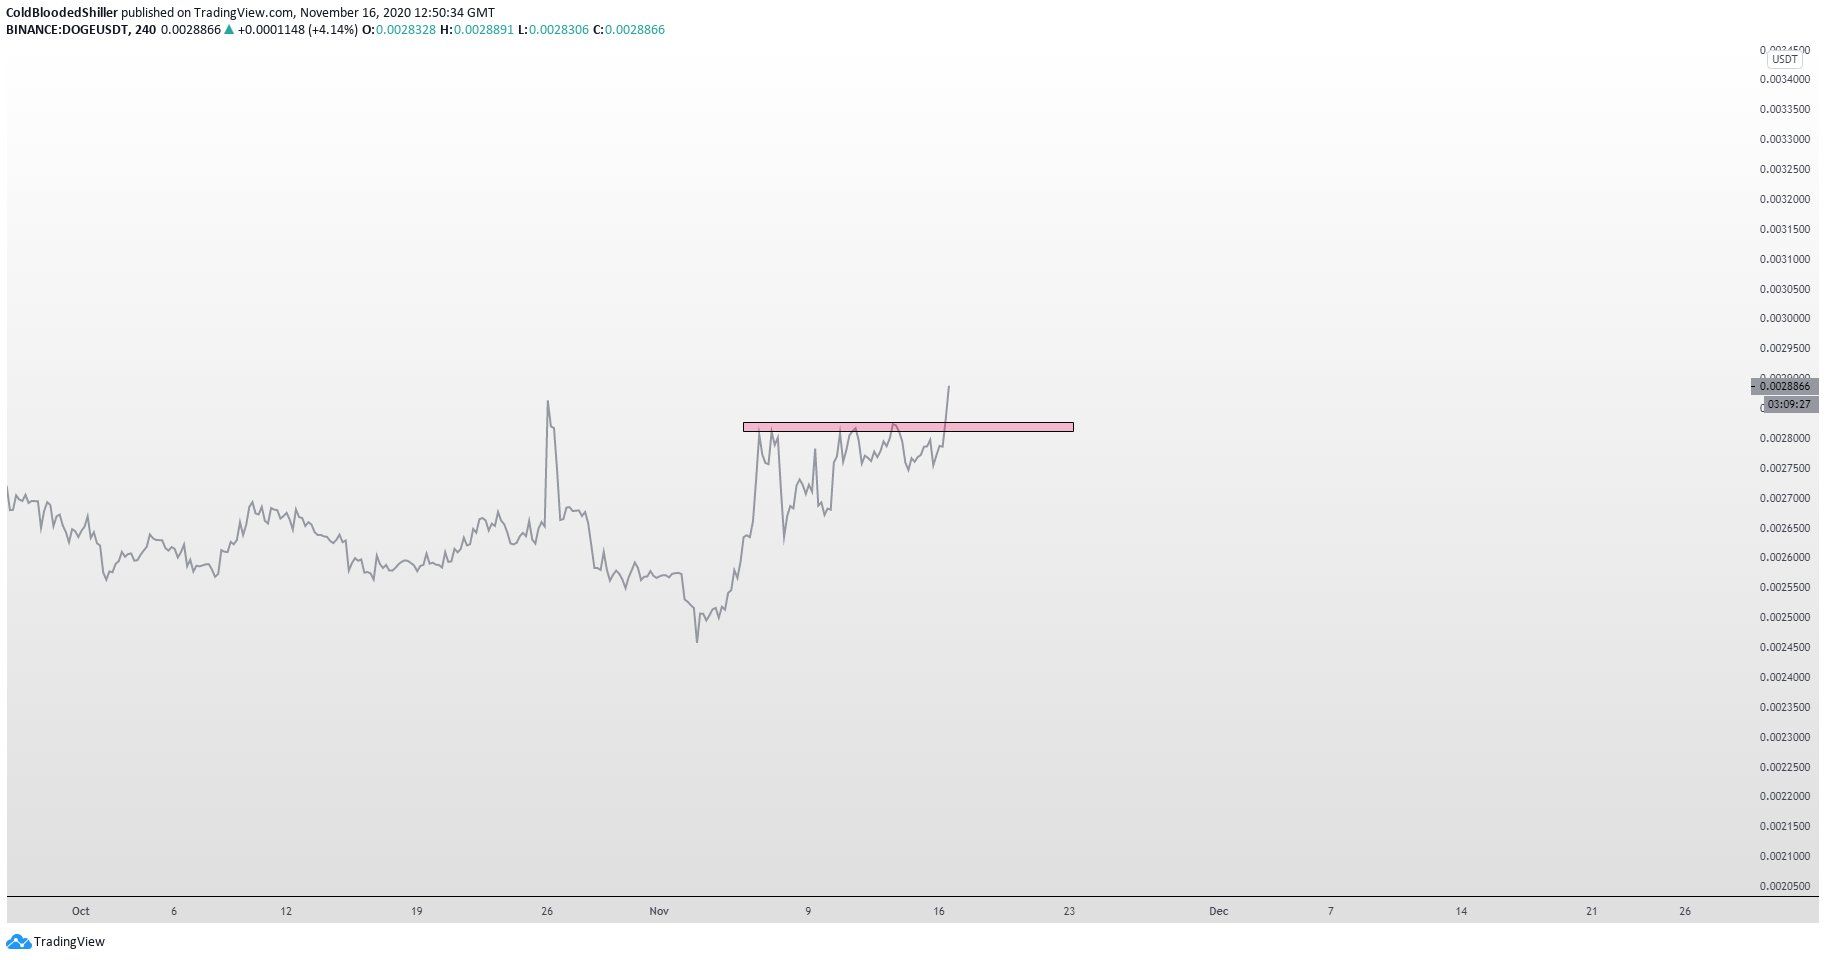
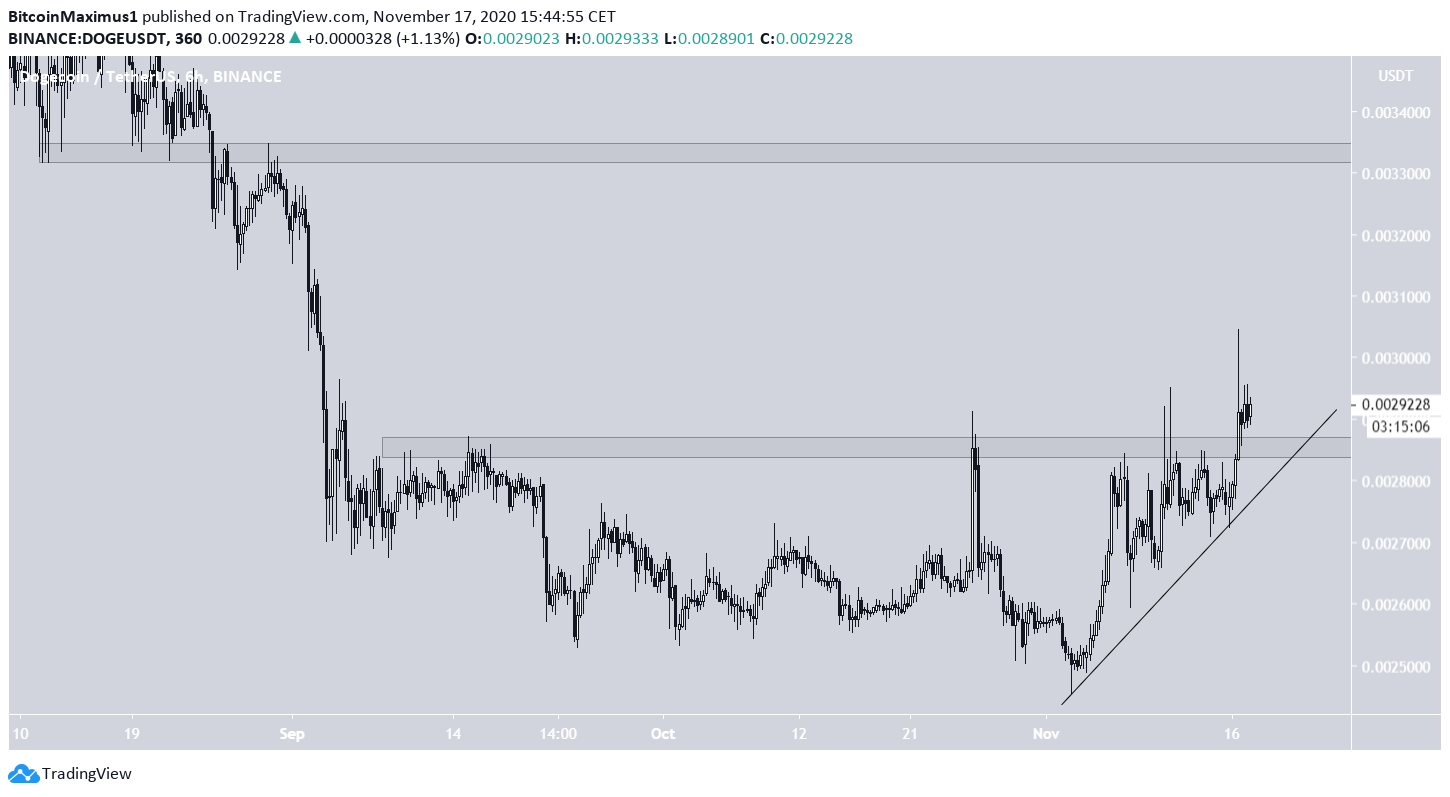
The previous resistance area is at $0.00285 and is now likely to act as support. Furthermore, the area coincides with an ascending support line, strengthening its importance.
As long as the price is trading above this area/line, DOGE should gradually continue to rise towards the resistance area outlined in the previous section.
The closest minor resistance area, which is expected to provide some resistance, is at $0.0033.
Conclusion
The DOGE price should eventually reach the $0.0037 resistance area. The short-term move is bullish as long as the price is trading above the minor $0.00285 support area and the ascending support line.
For BeInCrypto’s previous Bitcoin analysis, click here!
Disclaimer: Cryptocurrency trading carries a high level of risk and may not be suitable for all investors. The views expressed in this article do not reflect those of BeInCrypto


