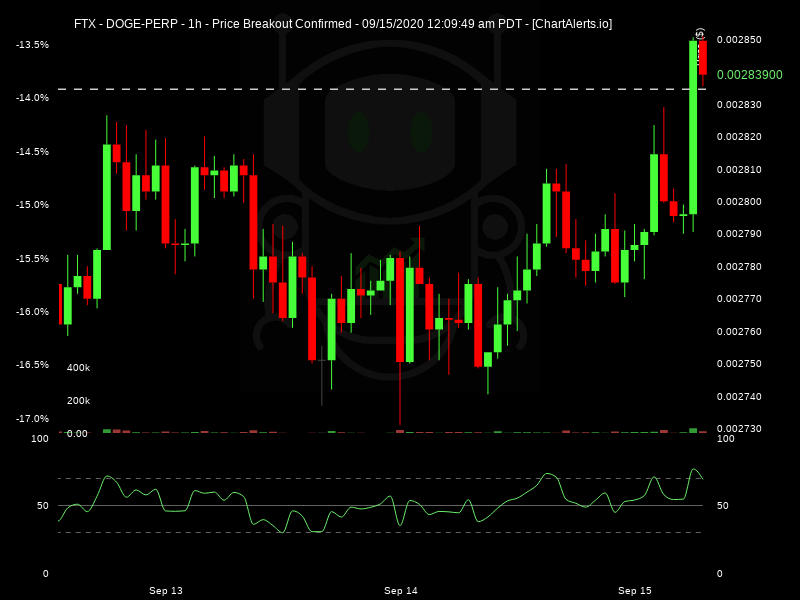
The Dogecoin (DOGE) price has been consolidating after a rapid pump and dump on July 10.
Currently, there are no signs that suggest the price is likely to begin an upward or downward move. However, the DOGE/USD chart looks considerably more bullish than the DOGE/BTC one.
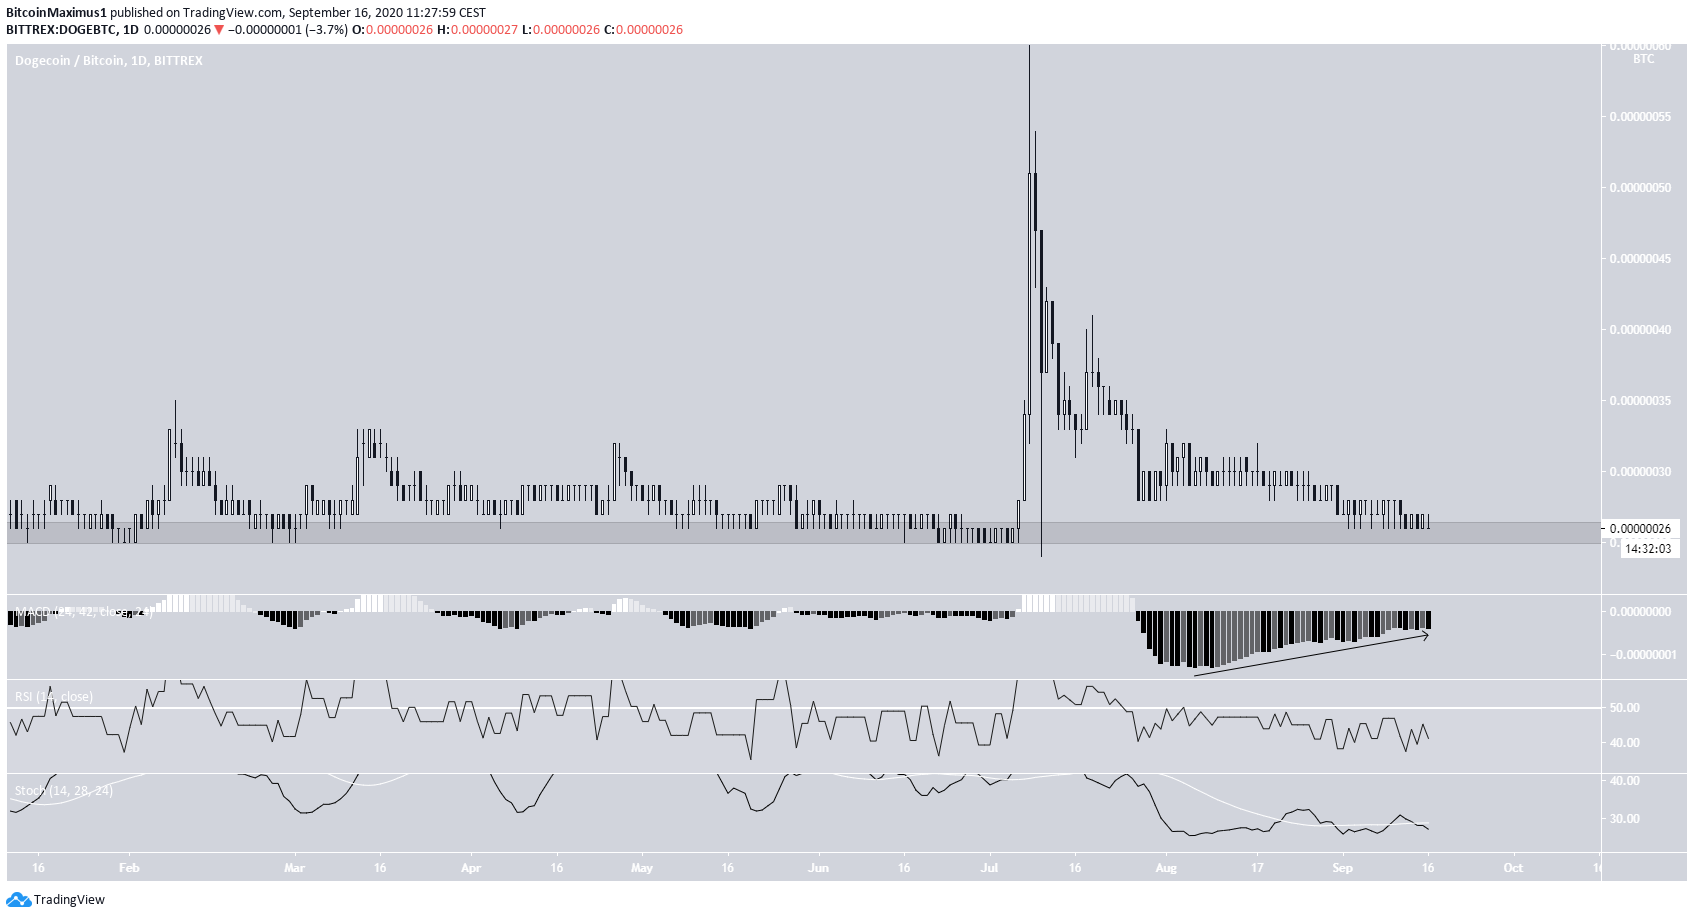
Long-Term Consolidation
With the exception of an upward move on July 8, which took the price to a high of 60 satoshis (that was quickly retraced), the DOGE price has barely moved. The price is trading very close to 26 satoshis, an area that has acted as support since the beginning of February.
While the MACD is increasing, it hasn’t turned positive yet. In addition, both the RSI and the Stochastic Oscillator are moving downwards. This indicates that there are no reversal signs however, and the price could continue consolidating near this level for the foreseeable future.
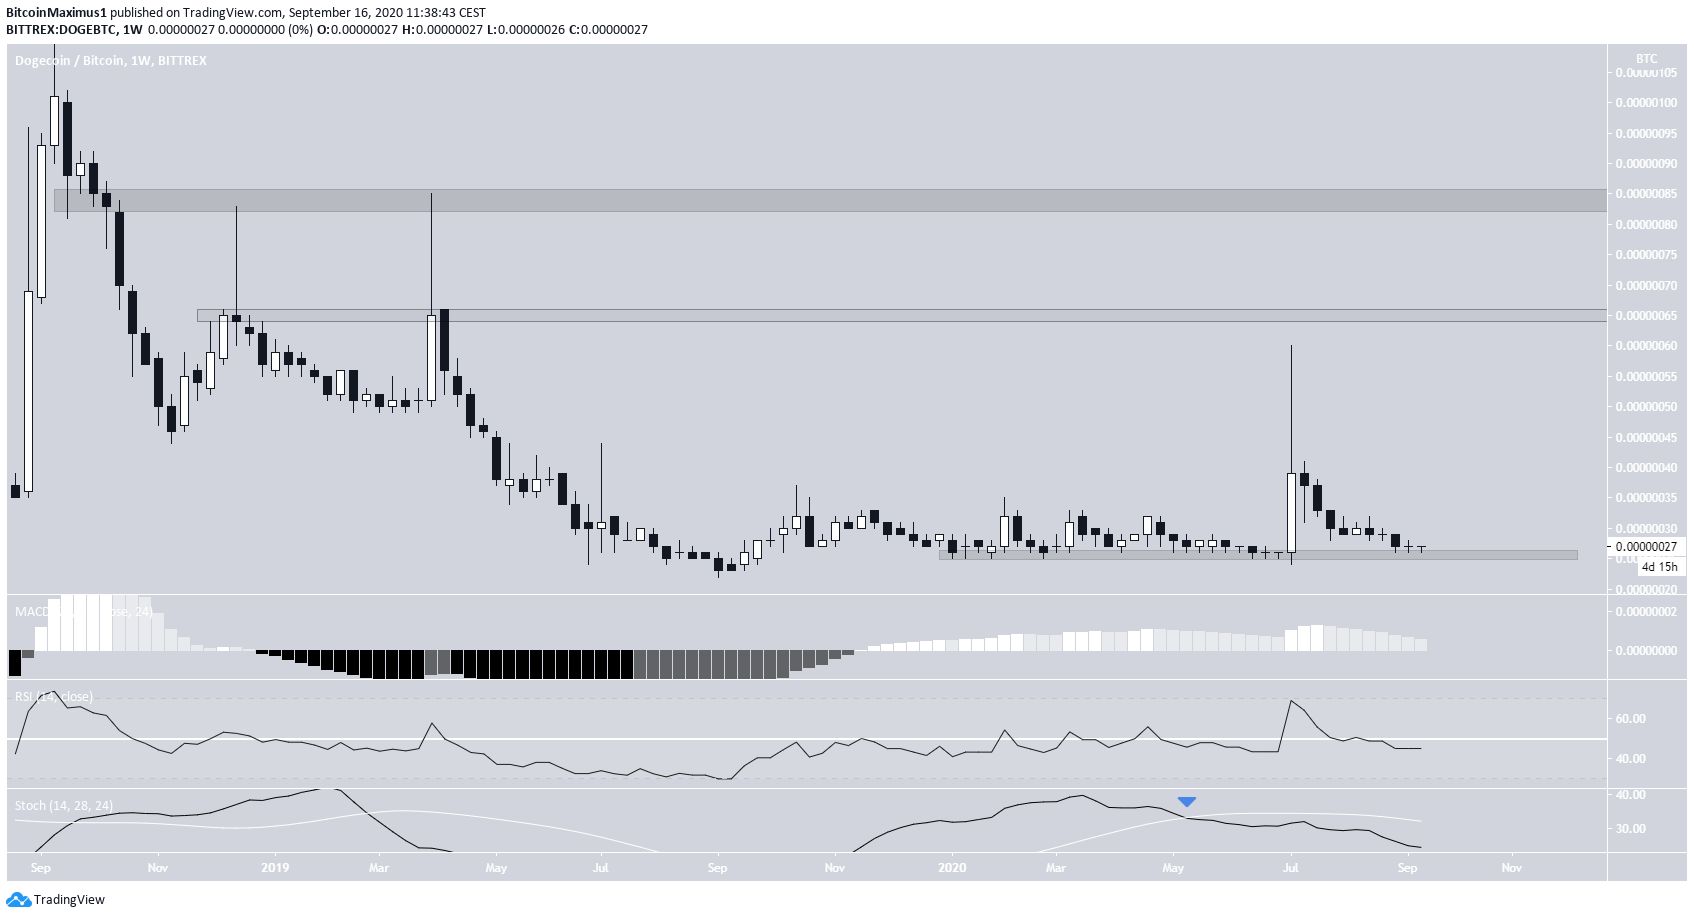
The weekly chart reveals a similar outlook, with the exception that technical indicators are more bearish. The MACD is falling, and the Stochastic Oscillator has made a bearish cross. The RSI is currently trading near the 50 level.
If the price were to move upwards, the closest resistance areas would be found at 65 and 85 satoshis, respectively. However, currently, there are no signs that the price will do so.
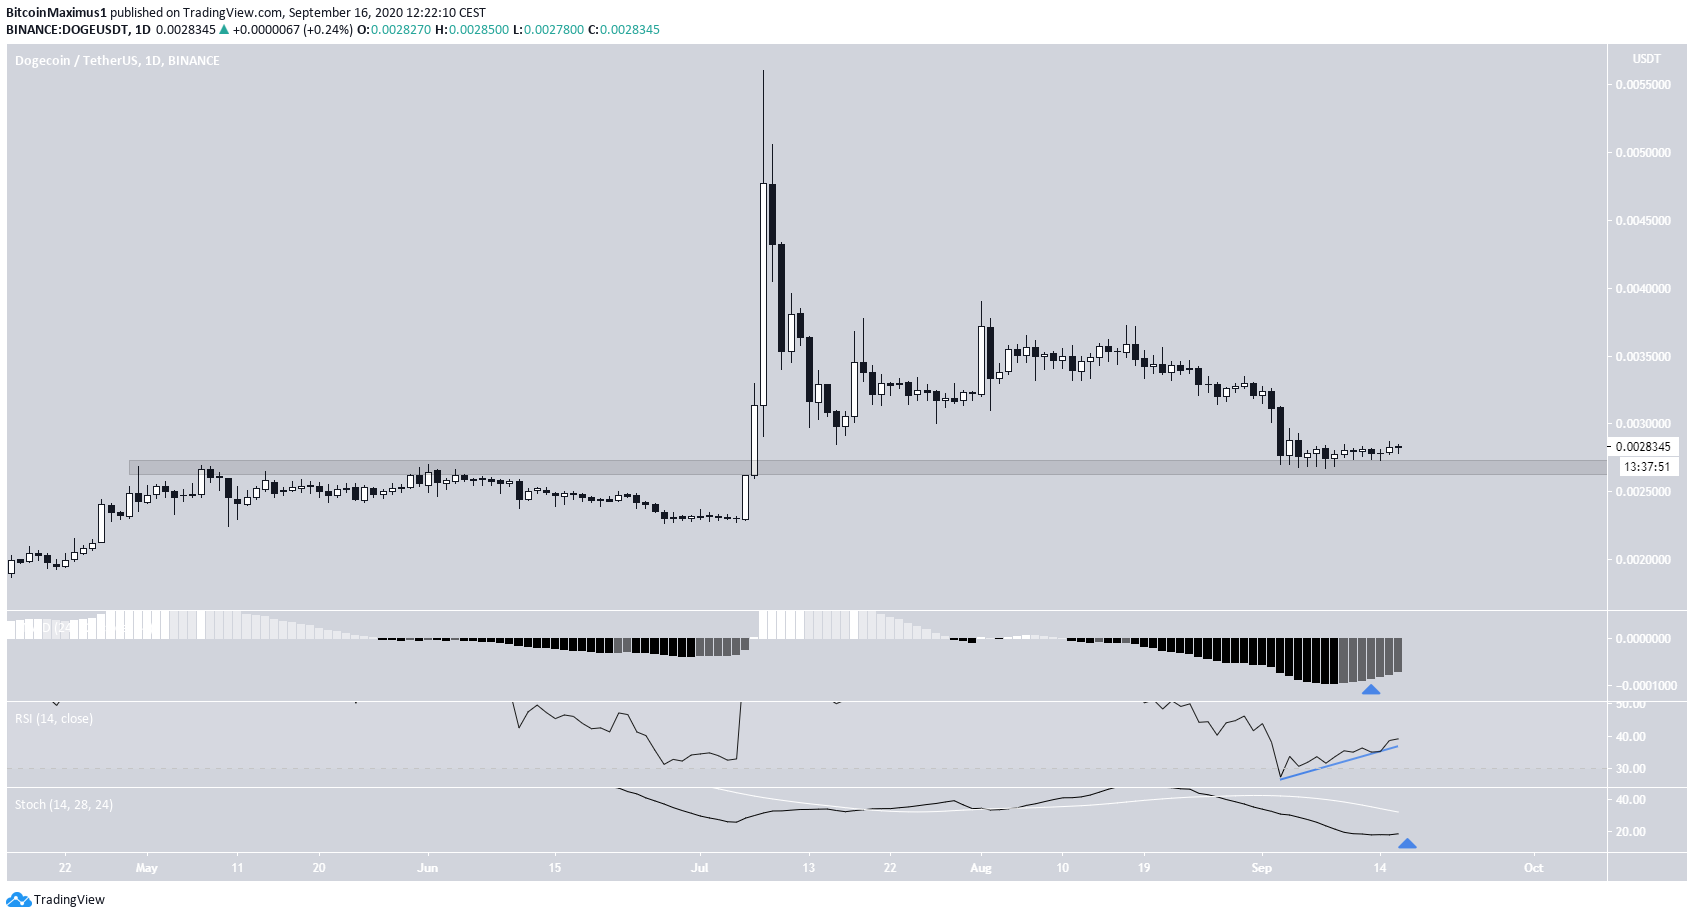
DOGE/USD
Cryptocurrency trader @Devchart stated that DOGE is finally moving upwards after an extended period of consolidation.
The DOGE/USD chart looks considerably more bullish than its BTC counterpart. While the price has been falling since its rapid pump on July 10, the decline has served to validate the $0.0027 area as support. This area acted as resistance before the pump.
Also, technical indicators have begun to turn bullish. Both the MACD and Stochastic Oscillator are increasing, the latter possibly getting ready to make a bullish cross. In addition, the RSI has formed a slight bullish divergence, a sign that the price is likely to begin moving upwards.
Therefore, we could eventually see an upward move towards $0.0035 and possibly $0.0045.