


The DigiByte (DGB) price has broken out from a descending wedge that had previously been in place since Aug.
The price should continue increasing towards the resistance areas outlined in the article.
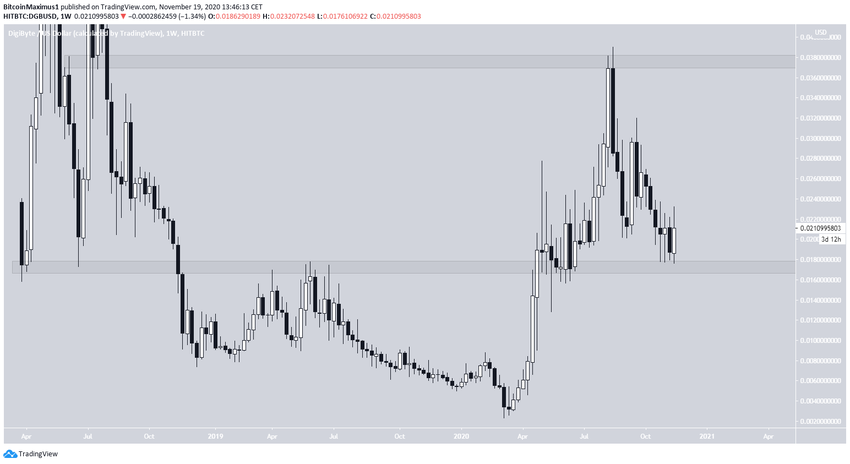
Long-Term Levels
The DGB price is trading above a crucial long-term support level at $0.017. The price broke out above it in Apr 2020, validated the level as resistance, and continued to move upwards.
After reaching a high of $0.039, the price began the current downward move and has now returned to the same support level.
The closest long-term resistance area is found at $0.037.
Possible Breakout
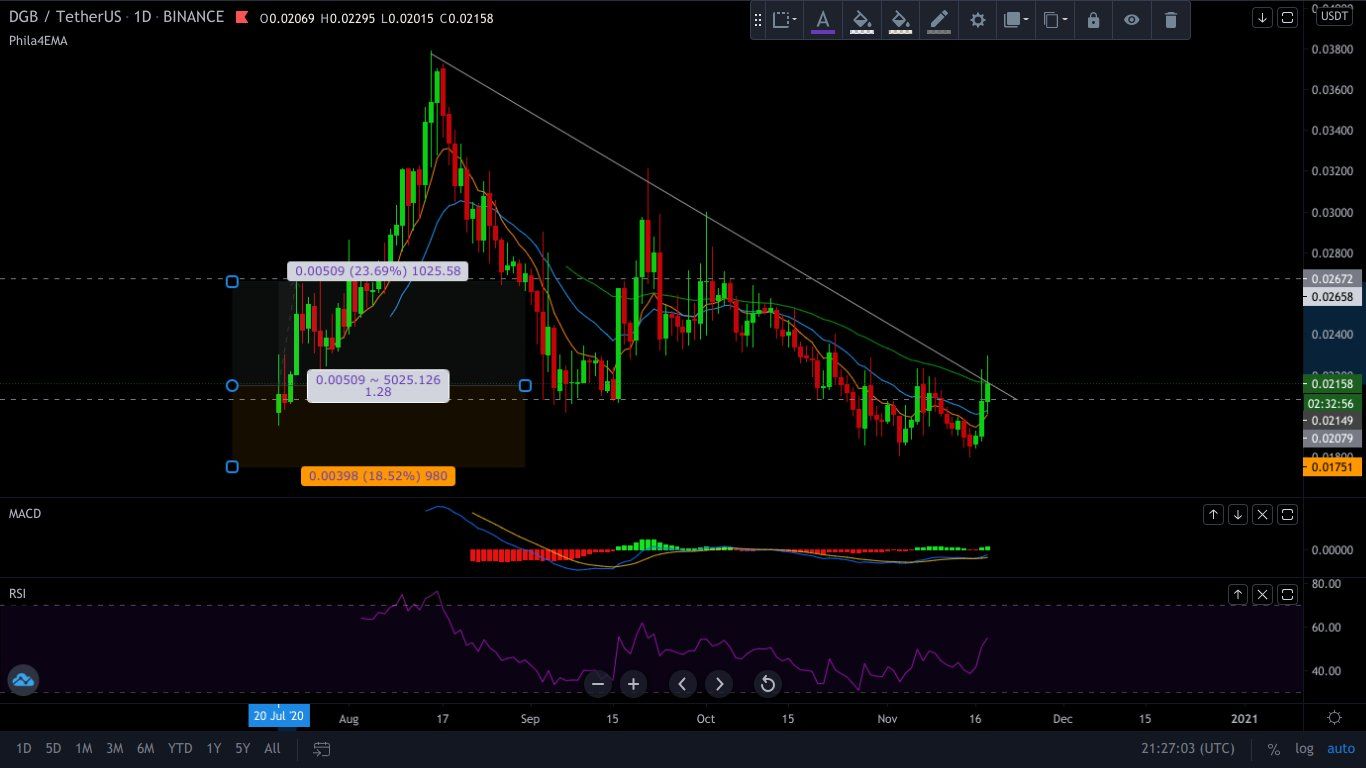
Cryptocurrency trader @Rafaela_Rigo_ outlined a DGB chart, stating that the price could begin to move upwards once it breaks out above the current descending resistance line.
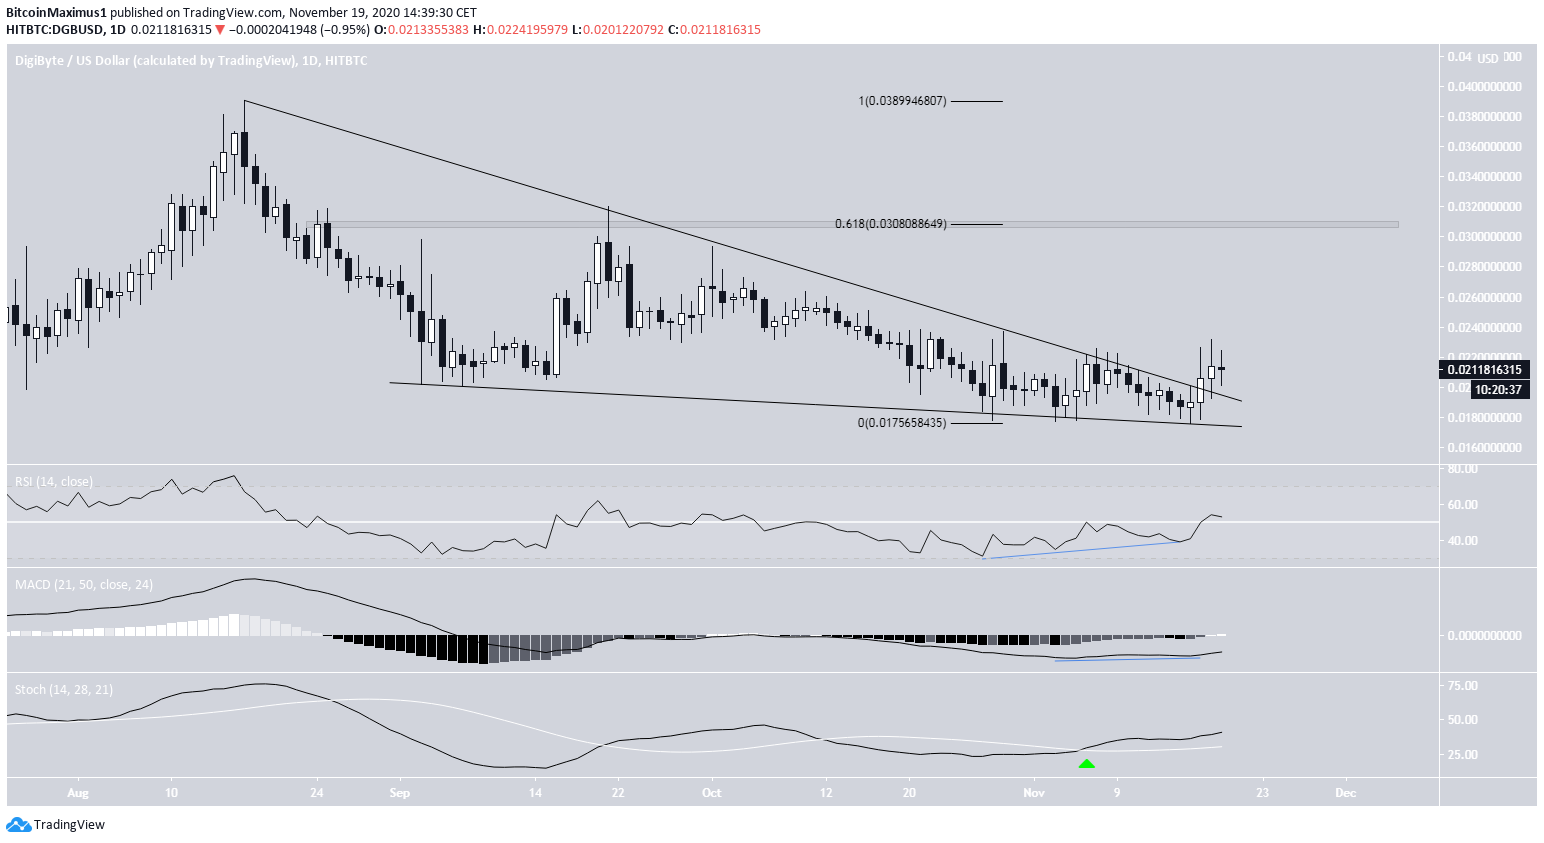
The price has indeed broken out from what looks like a descending wedge and had been in place since Aug.
Furthermore, the breakout was preceded by bullish divergence in both the RSI and the MACD, the former of which is now above 50 while the latter has crossed into positive territory.
Furthermore, the Stochastic Oscillator has just made a bullish cross. Therefore, the price is likely to continue rallying, possibly reaching the 0.618 Fib level of the recent fall, found at $0.03.
DGB/BTC
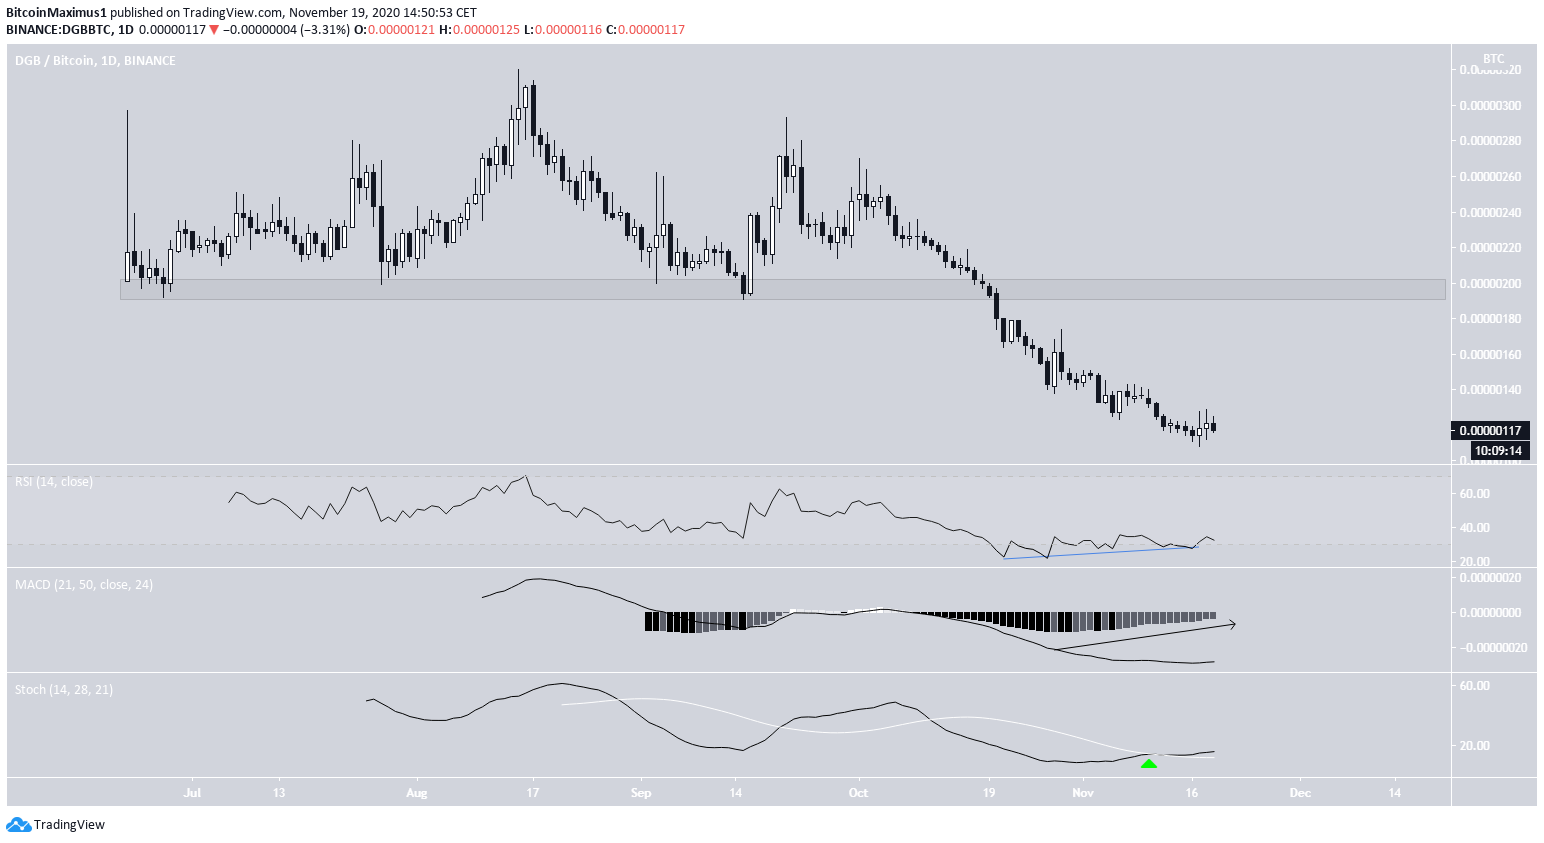
The DGB/BTC price has been moving downwards since the beginning of Aug. On Oct 16, the price broke down from the 200 satoshi resistance area and has been declining at an accelerated rate.
Even though there is no support below the current price level, both the RSI and the MACD have formed considerable bullish divergence, a sign that a trend reversal could soon occur. Furthermore, the Stochastic Oscillator has made a bullish cross.
If a reversal occurs, DGB could rally all the way to the 200 satoshi resistance area, validating it as resistance. Until the price breaks out above this level, the long-term trend remains bearish.
Conclusion
To conclude, the DGB price will likely continue moving upwards, at least until it reaches the closest resistance area at $0.03.
While the DGB/BTC pair has been declining for a long period of time, the price has shown strong bullish reversal signs and could soon begin an upward move.
For BeInCrypto’s previous Bitcoin analysis, click here!
Disclaimer: Cryptocurrency trading carries a high level of risk and may not be suitable for all investors. The views expressed in this article do not reflect those of BeInCrypto


