


On June 5, 2019, the DASH price reached a low of $140.2 A gradual increase ensued. On June 7, the price reached a high of $152.8. Since then, it has been trading between these two values, reaching lows on June 10 and highs on June 11 and 12.
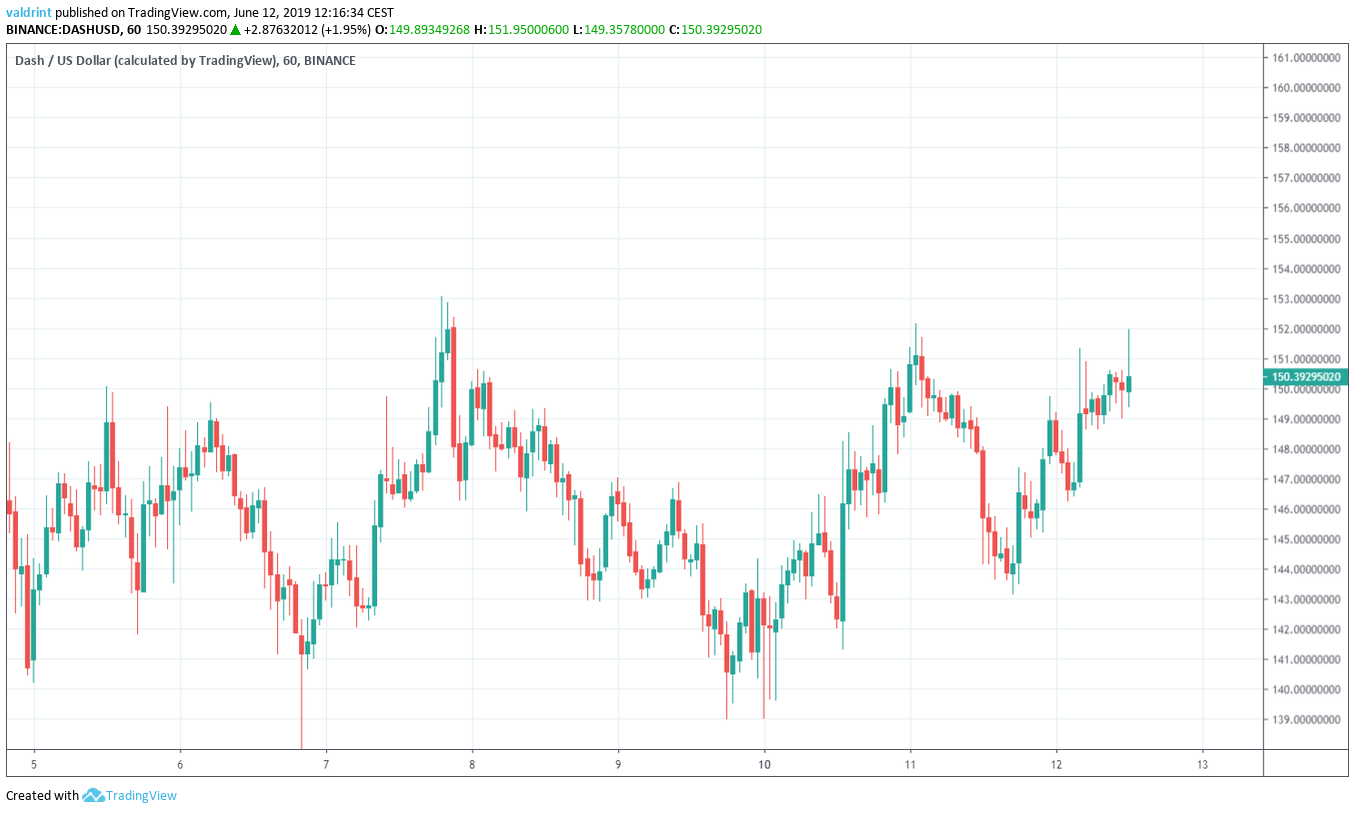
At the time of writing, the DASH price was trading close to $150.
Below, we are going to analyze the price of DASH in different time-frames alongside technical indicators in order to try and predict its future movement.
DASH: Trends And Highlights For June 12
- DASH/USD reached a low on June 5.
- It is trading inside a horizontal channel.
- There is a short-term bearish divergence developing in the RSI.
- The 10- and 20-day moving averages have made a bearish cross.
- There is support near $132.
DASH Price Inside A Horizontal Channel
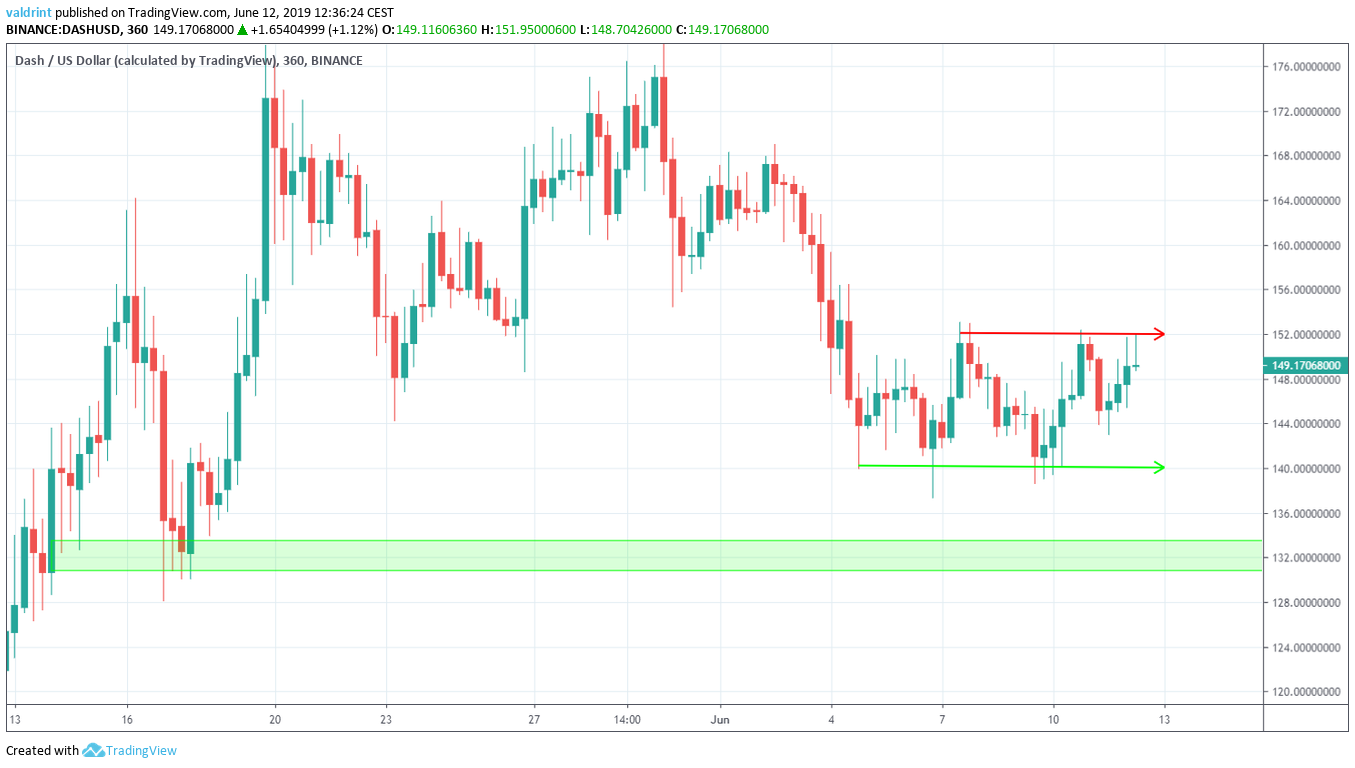
On June 5, the price of DASH reached a low of $140.2 A gradual increase followed. The price reached a high of $152.8 on June 7.
Since then, the price has been trading inside the horizontal channel outlined below:
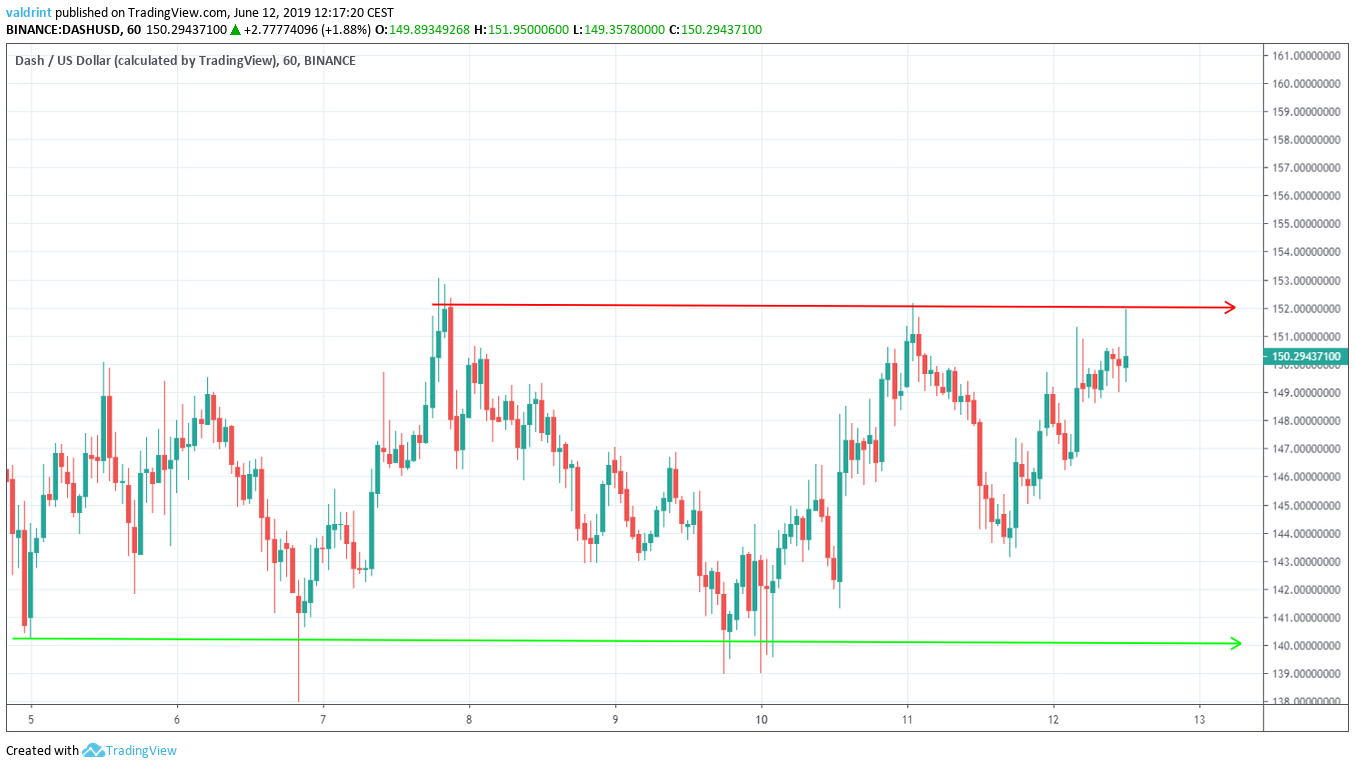
Both the resistance and support lines have been touched three times. The price made an unsuccessful attempt at a breakout on June 11. At the time of writing, it is in the process of making another attempt.
Will this one be successful? Let’s take a look at technical indicators and try to answer this question.
DASH Price: Technical Indicators
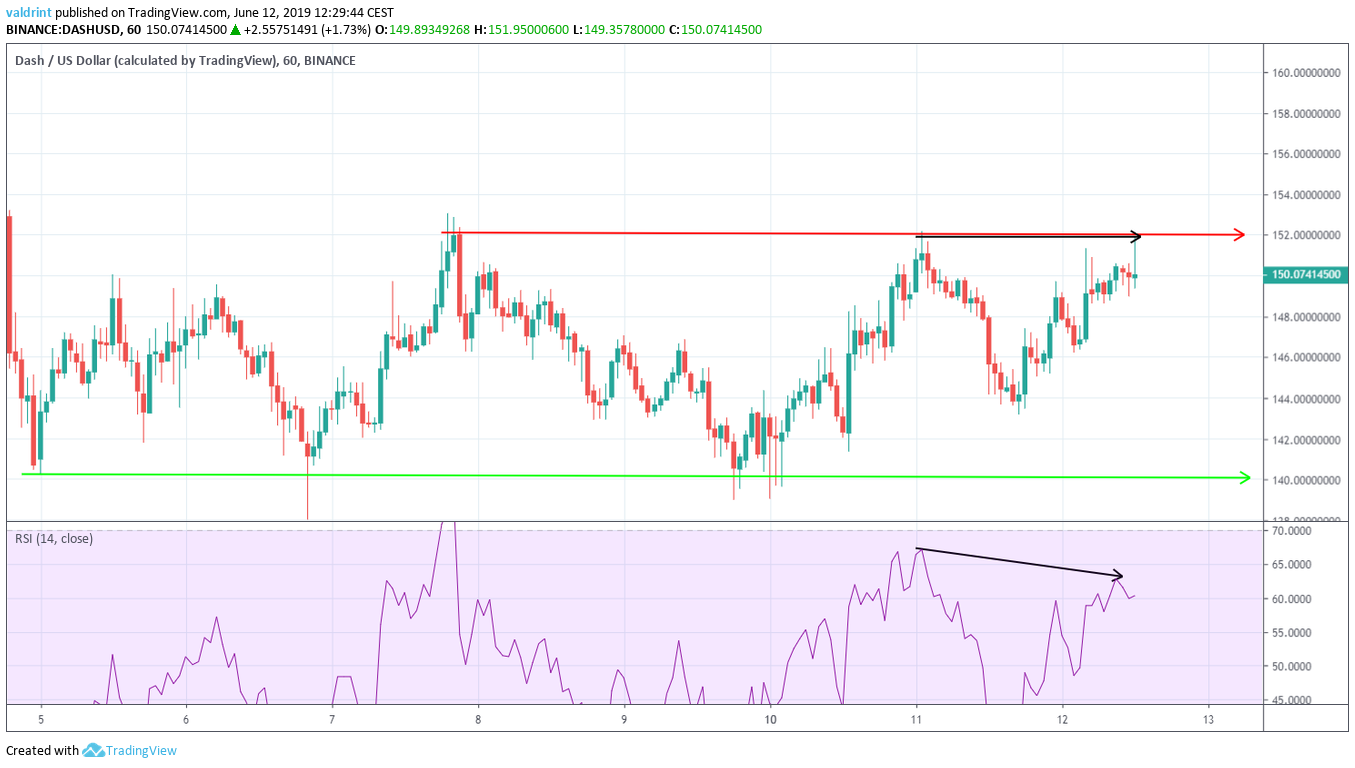
The use of the RSI supports a price drop towards the support line of the channel. However, it is only occurring in short-term time frames.
The use of daily moving averages also gives a bearish outlook:
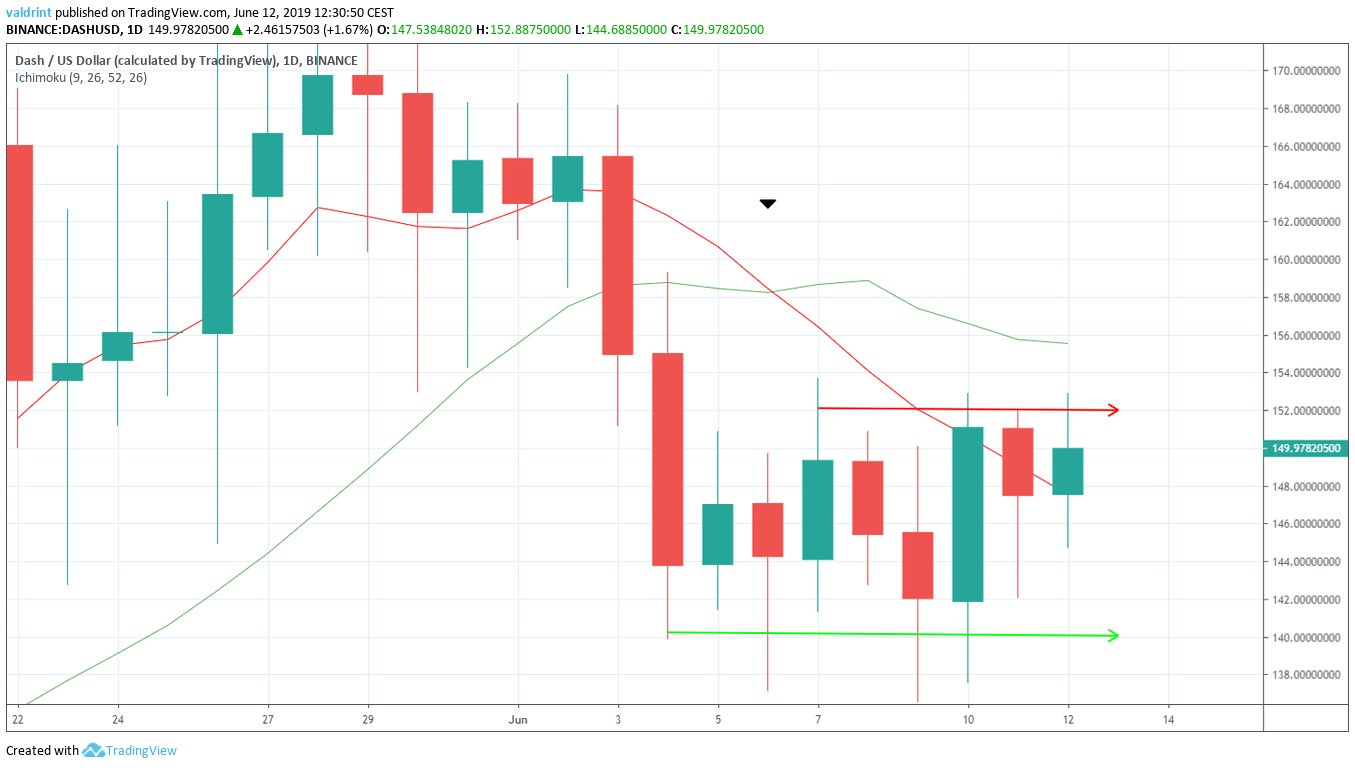
On June 6 the 10-day MA crossed below the 20-day one. This is known as a bearish cross. Since then, the DASH price has been trading below both MAs. It is facing very close resistance from the 10-day one.
At the time of writing, the current prices were slightly above the 10-day MA. However, we have not yet had a close above it.
The use of these indicators supports a decrease towards the support line of the channel.
Reversal Areas
In case a breakdown occurs, one support area is traced for DASH/USD below:
The closest support area is found near $132. If the DASH price breaks down from the channel, it is likely to provide a reversal.
Summary
The price of DASH reached a low on June 5 and has been increasing since. It is trading inside a horizontal channel. Both the short and long-term indicators give a bearish outlook.
Price decreases towards the support line of the channel are expected. A breakdown is possible, although not necessarily in the short-term.
Do you think the price of DASH will reach the support area outlined above? Let us know in the comments below.
Disclaimer: This article is not trading advice and should not be construed as such. Always consult a trained financial professional before investing in cryptocurrencies, as the market is particularly volatile.


