


On July 2, 2019, the DASH price reached a high of ₿0.015. A decrease ensued. In the period between July 2 and July 8, the price traded between ₿0.013 and ₿0.014. Another decrease ensued on July 8.
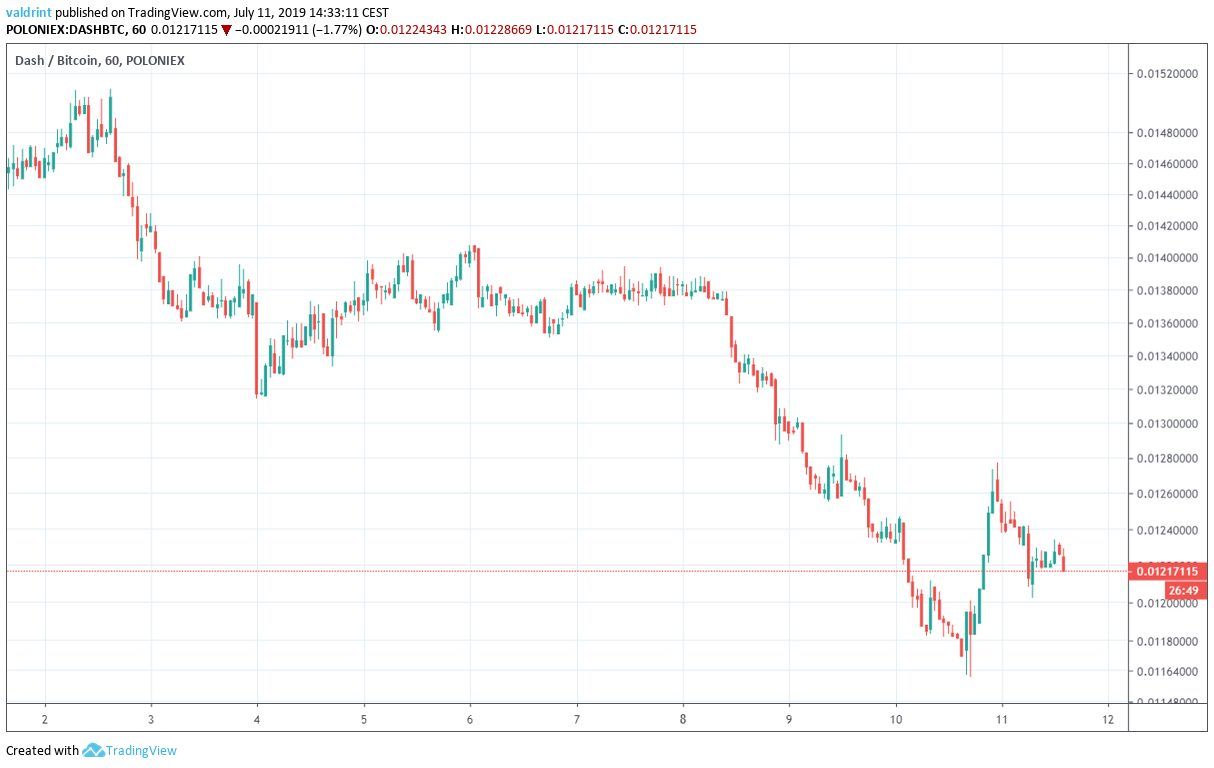
At the time of writing, the DASH price was trading slightly above ₿0.012.
When will DASH begin a reversal? Keep reading below in order to find out.
For our previous analysis, click here.
If you are interested in trading cryptocurrencies like Bitcoin (BTC), Ethereum (ETH), Litecoin (LTC), Bitcoin Cash (BCH) and XRP on our partner exchange, follow this link to get signed up on XCOEX.
For a video analysis, click below:
https://youtu.be/NFZoFNLn3S8
DASH Price: Trends and Highlights for July 11
- DASH is following a long-term ascending support line.
- It is trading inside a descending wedge.
- There is bullish divergence developing in the RSI.
- Moving averages give a bearish outlook.
- There is resistance near ₿0.018.
Long-Term DASH Price Support
A look at the logarithmic weekly chart for DASH shows that the price has been following an ascending support line since 2014.
The logarithmic chart is used to better visualize large price fluctuations.
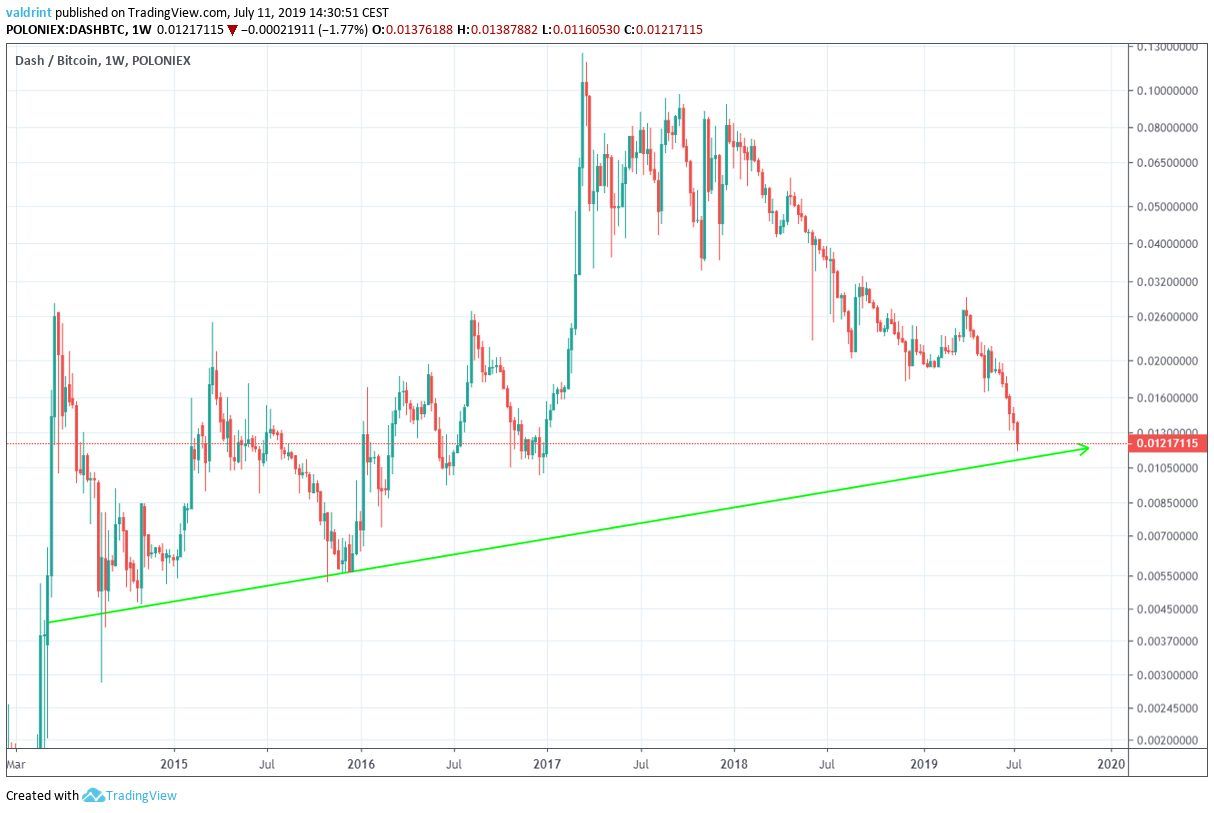
At the time of writing, the DASH price was trading slightly above this line.
Let’s take a look at a short-term time-frame to see how it relates to this long-term support line.
Descending Wedge
A look at the daily chart shows that the DASH price has been trading inside a descending wedge since September 2018.
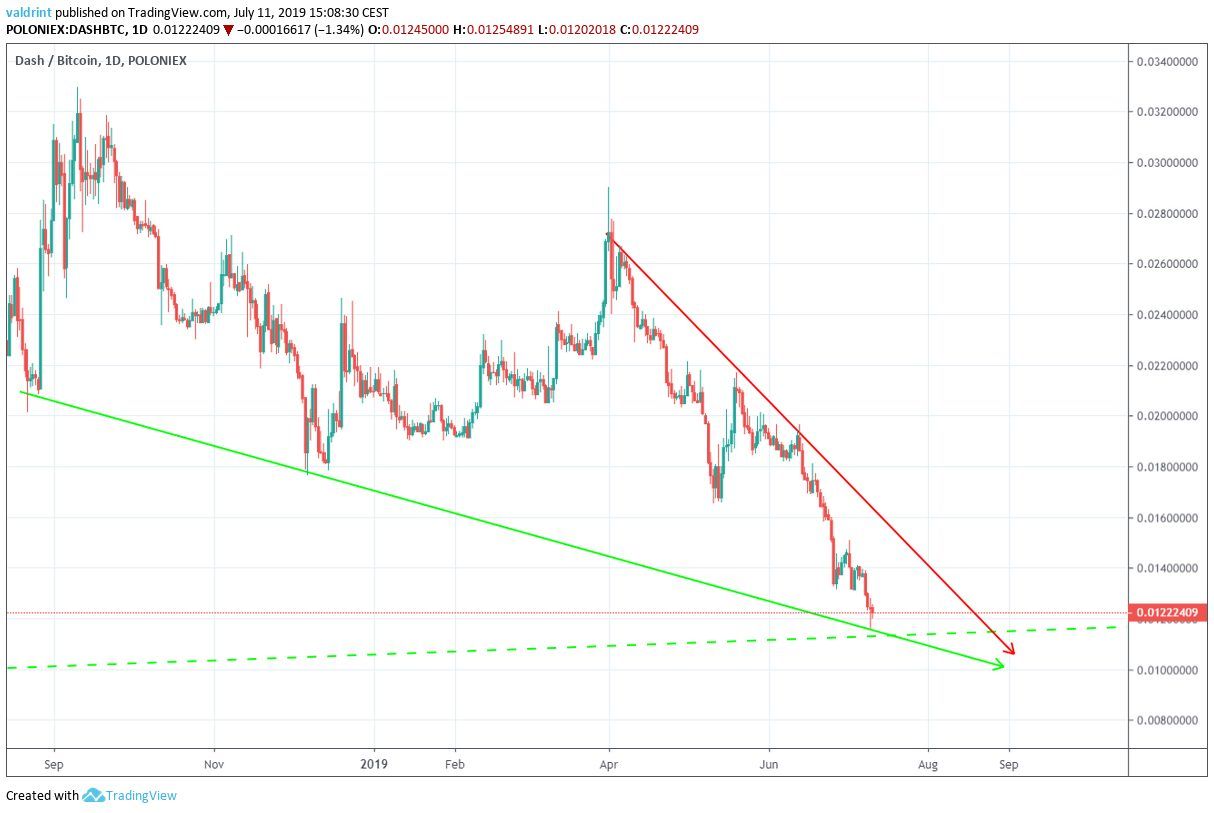
The descending wedge is a bullish pattern, making price breakouts more likely.
Additionally, the support line of the wedge coincides with the long-term ascending support line outlined in the previous section.
Possible Reversal
A look at technical indicators shows that the RSI has been generating bullish divergence.
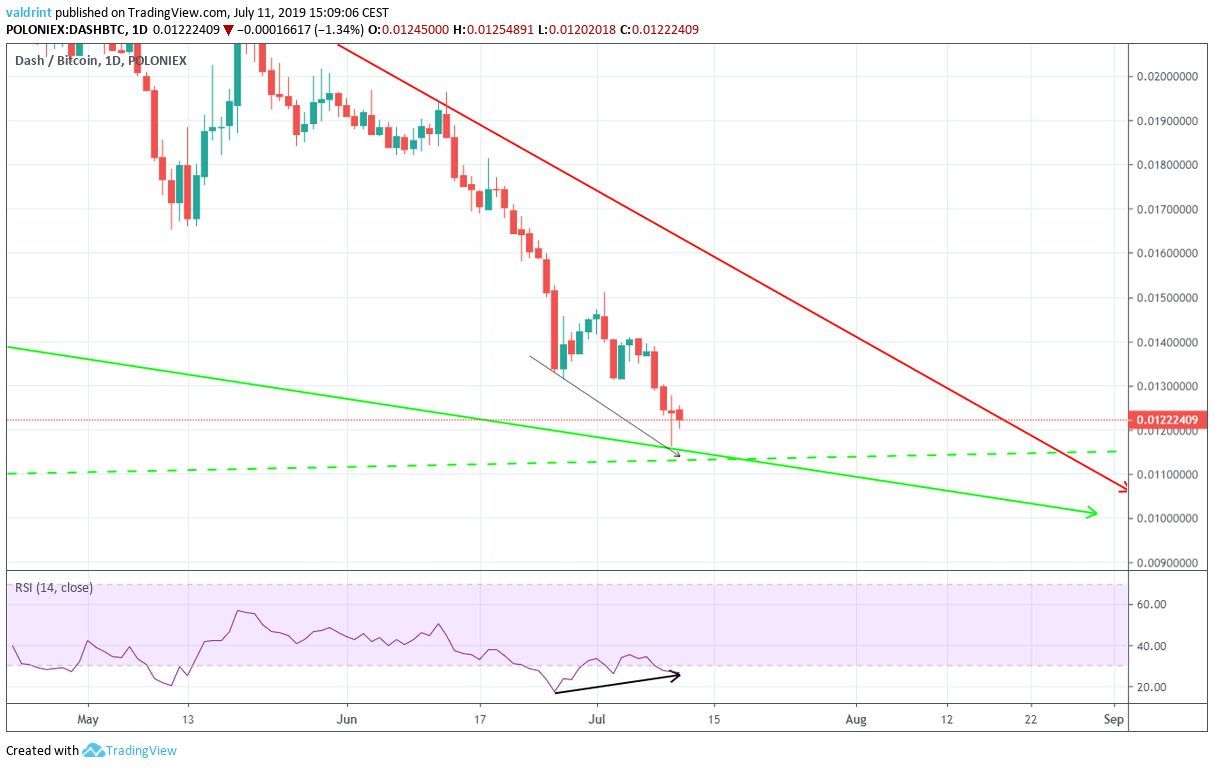
The level of divergence is significant.
Furthermore, it is occurring at the support line of the wedge and the long-term support line.
However, it is not present in the MACD.
On the other hand, a look at the moving averages (MA) gives a bearish outlook.
Both long- and short-term MAs have made bearish crosses and are providing resistance to the price.
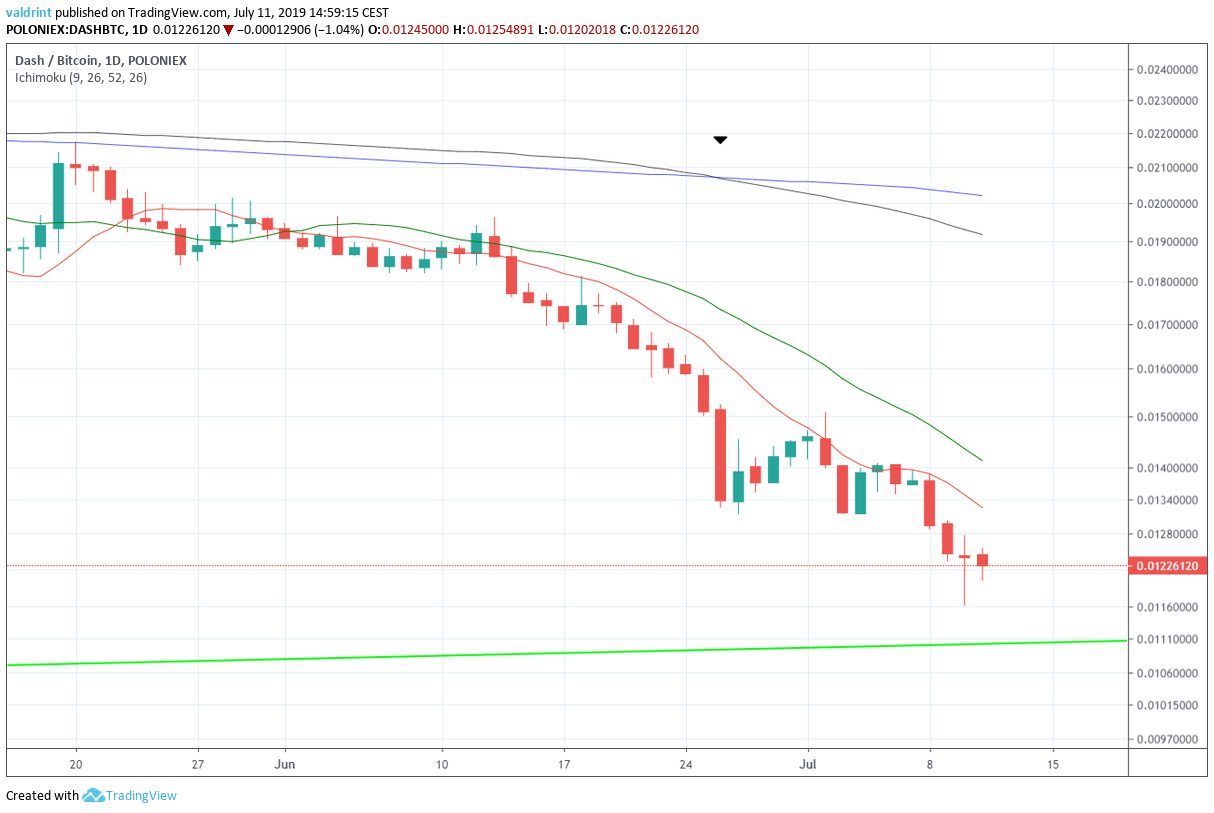
A bearish cross between the 10- and 20-period MAs transpired on June 1, while the 100- and 200-period MAs followed suit on June 26.
Combining the analysis from these technical indicators, we can come to the conclusion that, while it is likely that the DASH price will break out from the wedge, the ensuing increase might be short-lived.
Reversal Areas
In case a breakout occurs, one resistance area is outlined below:
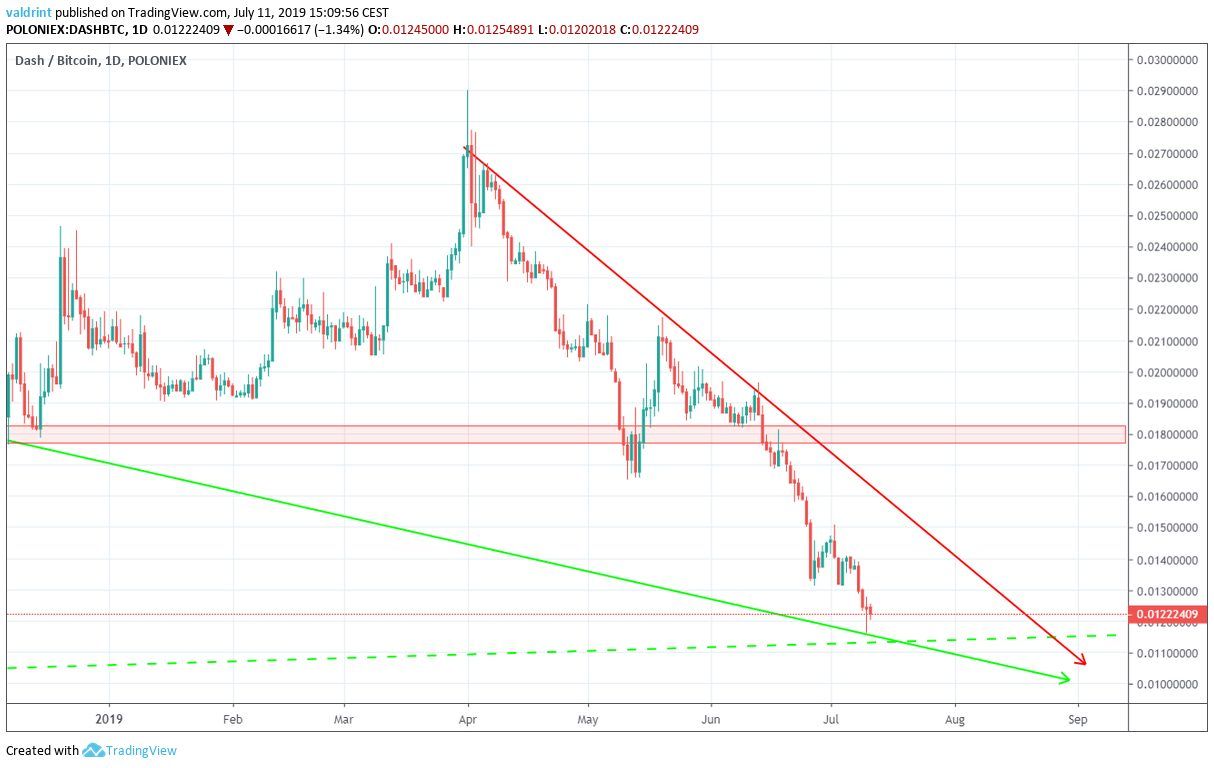
The closest resistance area is found near ₿0.018.
If the DASH price breaks out from the wedge, it is likely to initiate a reversal.
Summary
The DASH price is trading inside a descending wedge.
Momentum indicators suggest that a breakout is forthcoming.
However, moving averages indicate that there is significant resistance above the price.
To conclude, we believe that the DASH price will break out from the wedge and reach the resistance area outlined above.
Do you think the DASH price will break out from the wedge? Let us know in the comments below.
Disclaimer: This article is not trading advice and should not be construed as such. Always consult a trained financial professional before investing in cryptocurrencies, as the market is particularly volatile.
Images are courtesy of Shutterstock, TradingView.


