


On Oct 11, the DASH price broke out from a descending wedge. After validating it as support, the price resumed its upward move on Oct 19.
Unless the $66 support area fails, the price should continue rallying.
Breakout From Long-Term Wedge
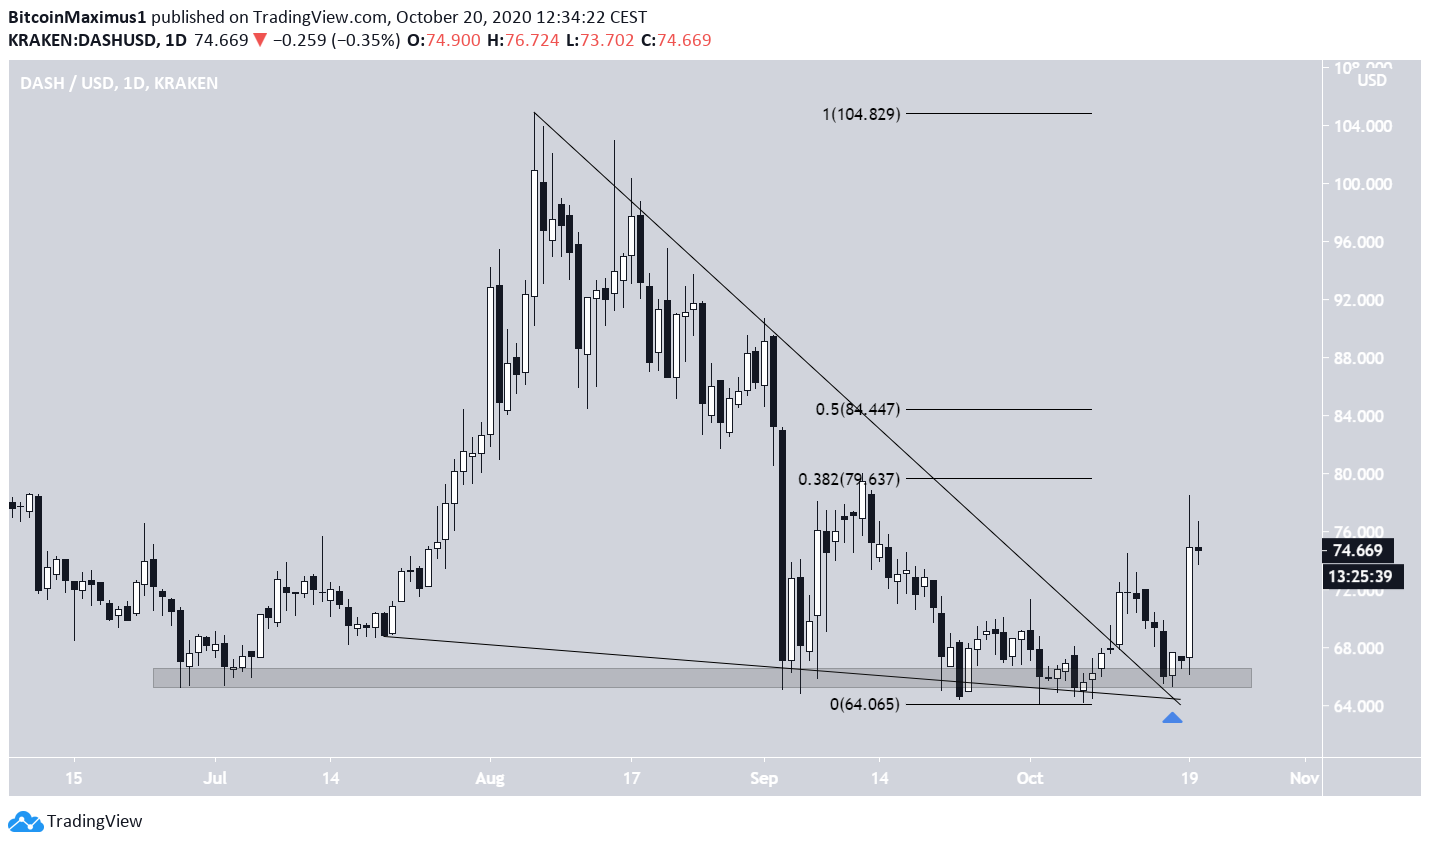
DASH has been falling since Aug 16, when the price reached a high of $104.85. Since then, the price has been following a descending resistance line and possibly trading inside a descending wedge, which is considered a bullish reversal pattern.
On Oct 11, the price broke out from the wedge, returned to validate it as support, and created another bullish engulfing candlestick on Oct 11, briefly reaching a high of $78.47.
The closest support area is found at $66, while the closest resistance levels are found at $79 and $84, the 0.382 and 0.5 Fib levels of the entire decline, respectively.
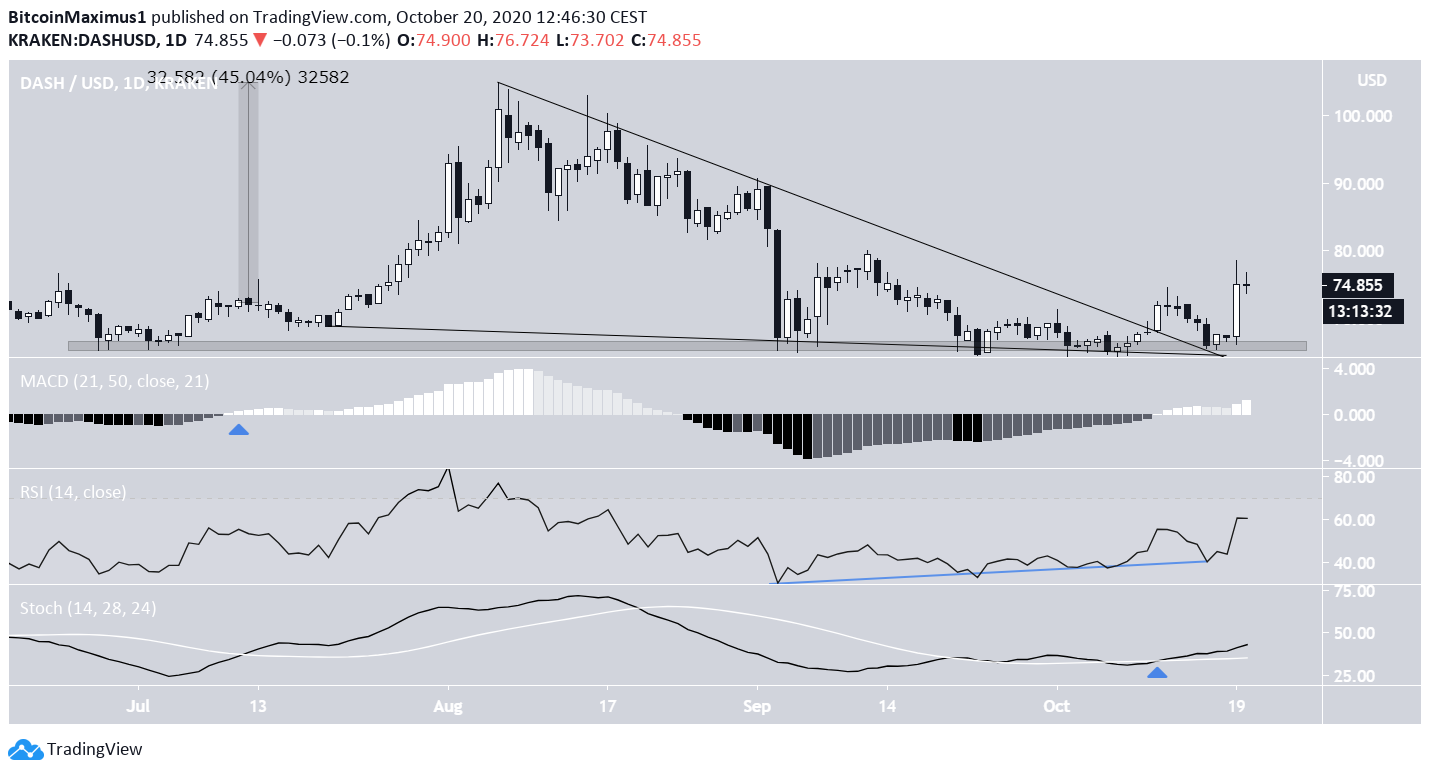
Technical indicators on the daily time-frame are bullish:
- The MACD is increasing and has turned positive.
- The Stochastic RSI has made a bullish cross and is increasing.
- The RSI is increasing after completing a very significant bullish divergence.
Previously when the MACD crossed into positive territory, the price eventually rallied by 45%, reaching the Aug 16 high.
Therefore, the price should continue rising unless it somehow manages to lose the $66 support area.
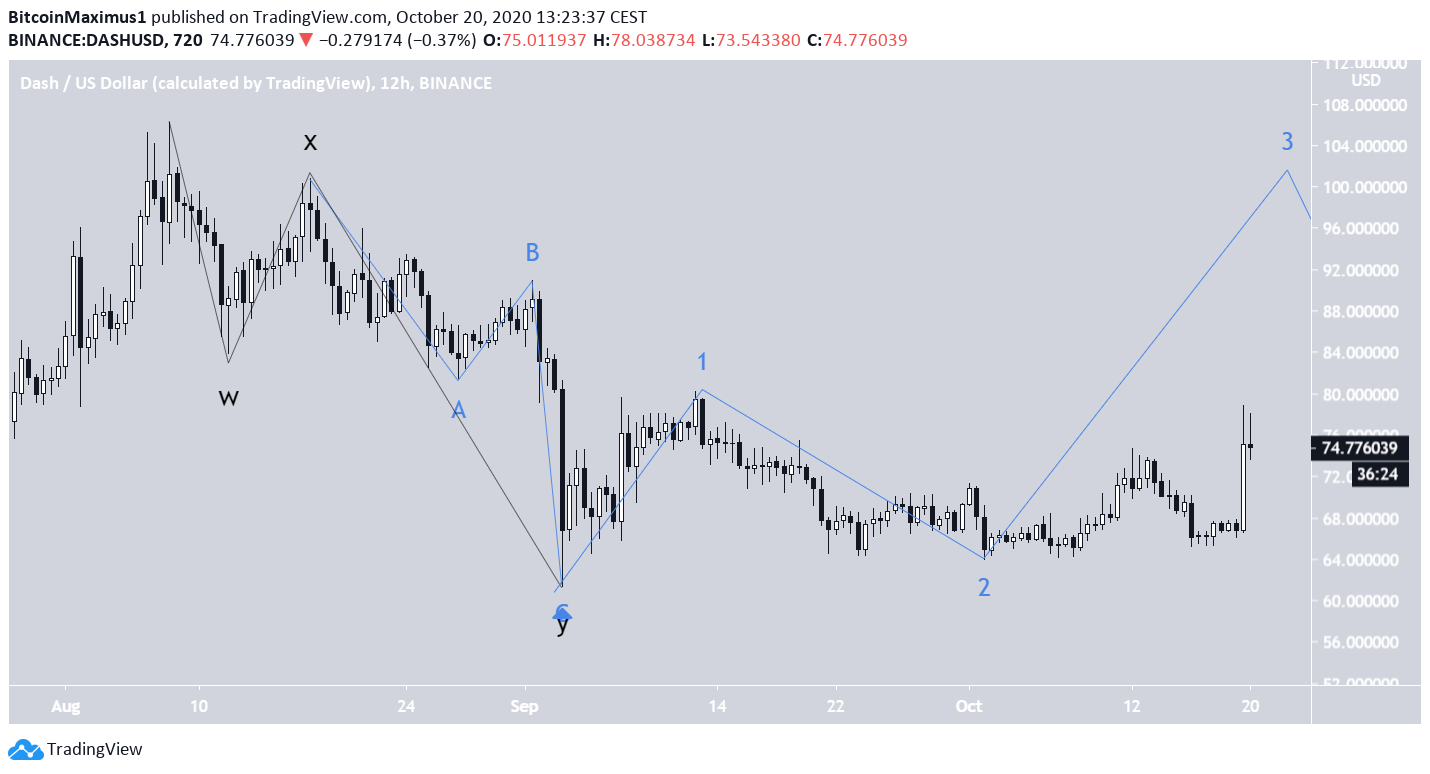
Wave Count
The most likely count suggests that DASH has completed a W-X-Y correction (shown in black below) with its low reached on Sept 3.
Since then, the price has possibly begun a new bullish impulse (blue) and is currently in wave 3. The move would also fit with the wedge breakout and the bullish technical indicators.
A fall below the w2 low at $64.30 would invalidate this count.
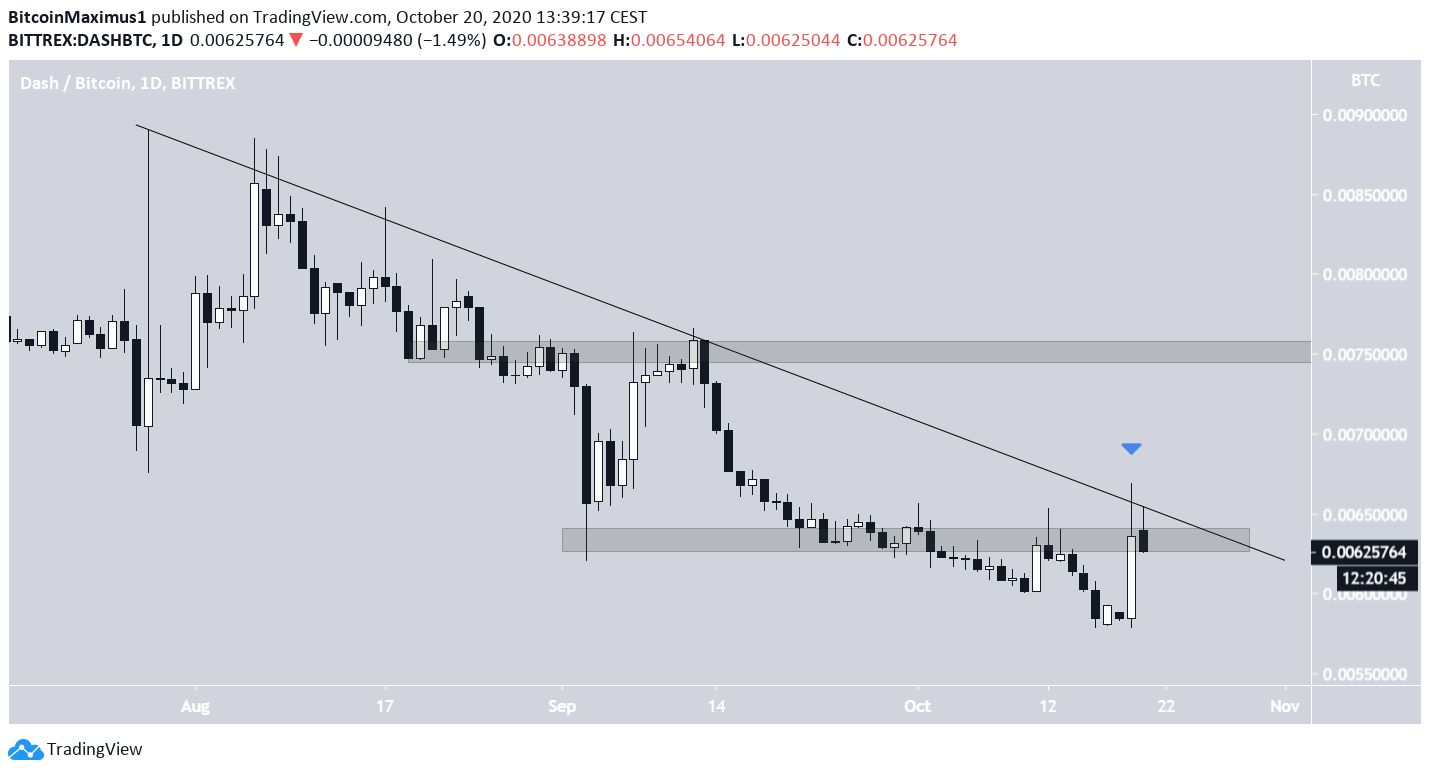
DASH/BTC
Cryptocurrency trader @Daancrypto tweeted a DASH/BTC chart that shows a descending wedge. He believes the price will continue falling until it reaches ฿0.0052.
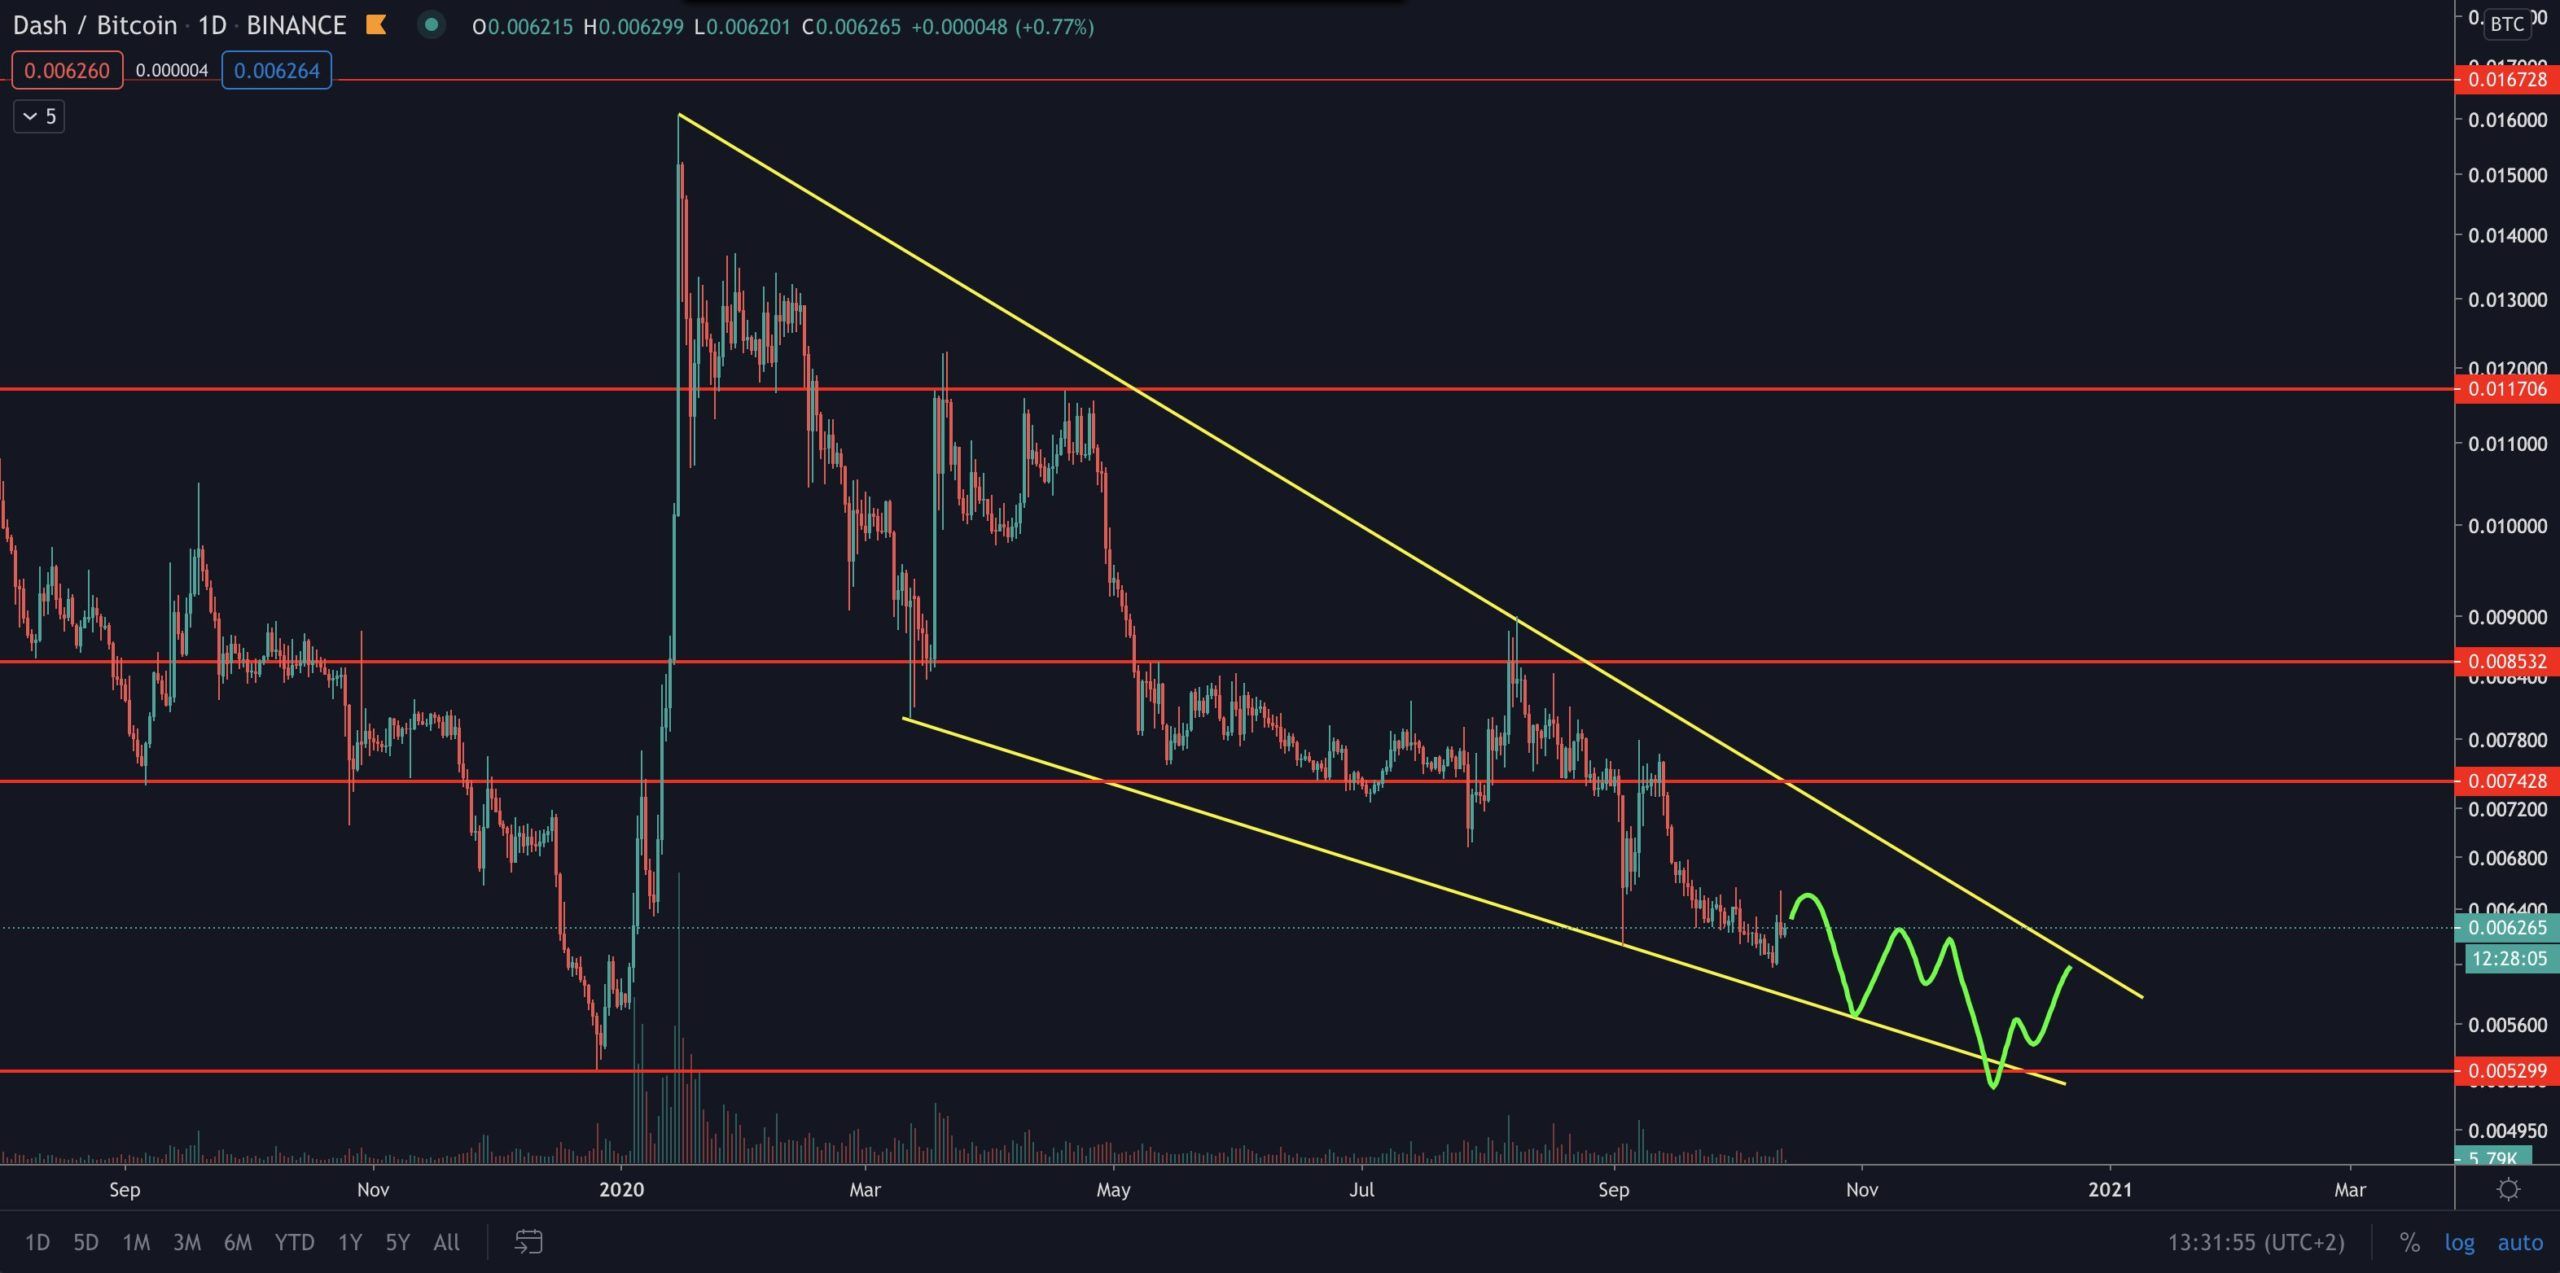
Unlike the DASH/USD pair, DASH/BTC is still trading below a descending resistance line. Furthermore, it is facing strong resistance at ฿0.00625, having created a long upper wick.
Therefore, a price decline towards ฿0.00525, as outlined in the tweet, remains the most likely scenario.
For BeInCrypto’s previous Bitcoin analysis, click here!
Disclaimer: Cryptocurrency trading carries a high level of risk and may not be suitable for all investors. The views expressed in this article do not reflect those of BeInCrypto.


