


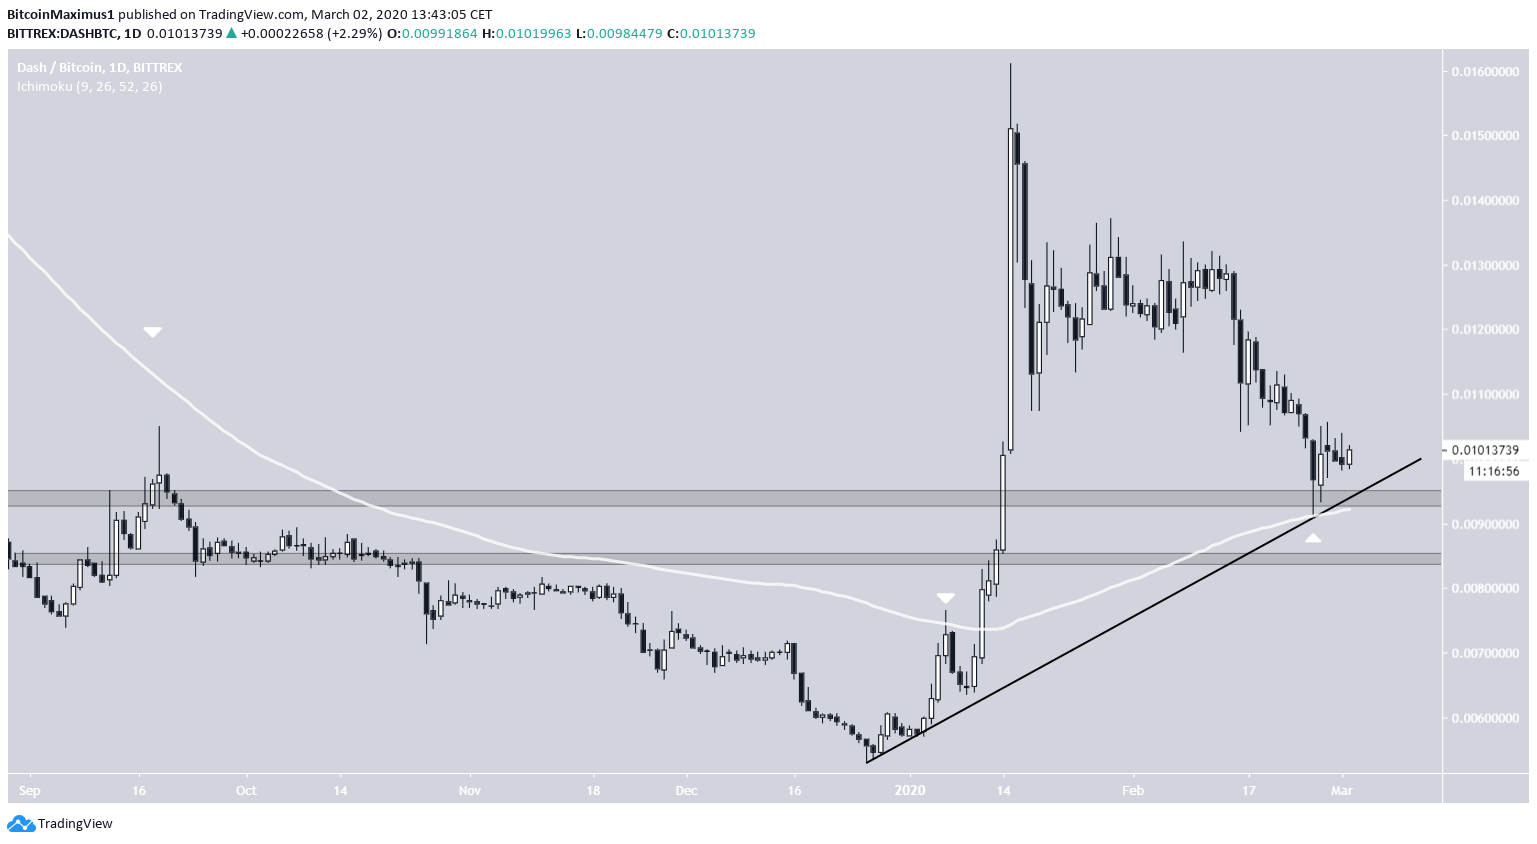
The DASH price has been decreasing since January 16, when it reached a high of ₿0.061. The decrease came to an end on February 26, when the price bounced at the 100-day moving average (MA).
DASH (DASH) Price Highlights
- There is support at ₿0.093 and ₿0.085.
- The price might be following an ascending support line.
- DASH has broken down from a descending triangle.
- It is facing resistance from the 200-hour moving average.
Trader @cryptotunez tweeted a DASH chart that shows the price resting above a major moving average. Also, he asked his followers to hypothesize on which moving average they believe he was illustrating.
who can tell me which MA this is?$DASH pic.twitter.com/IeuNjBtG0R
— tunez (evm/acc) 🎮 (@cryptunez) February 29, 2020
Without making you scroll through the entire article, we are going to tell you that the MA in the picture is the 100-day one. If you want to know its significance for future price movement, continue reading below.
For our previous analysis, click here.
Ascending Support Line
The daily chart immediately reveals two support areas that are found at ₿0.093 and ₿0.085. In addition, the DASH price might be following an ascending support line since December 26, 2019.
On February 26, the price decreased and created a long lower wick. The wick served to validate the ₿0.093 support area, ascending support line, and 100-day MA.
Therefore, the ₿0.0093 support area is a very likely place to reverse the trend.
Previous Breakdown
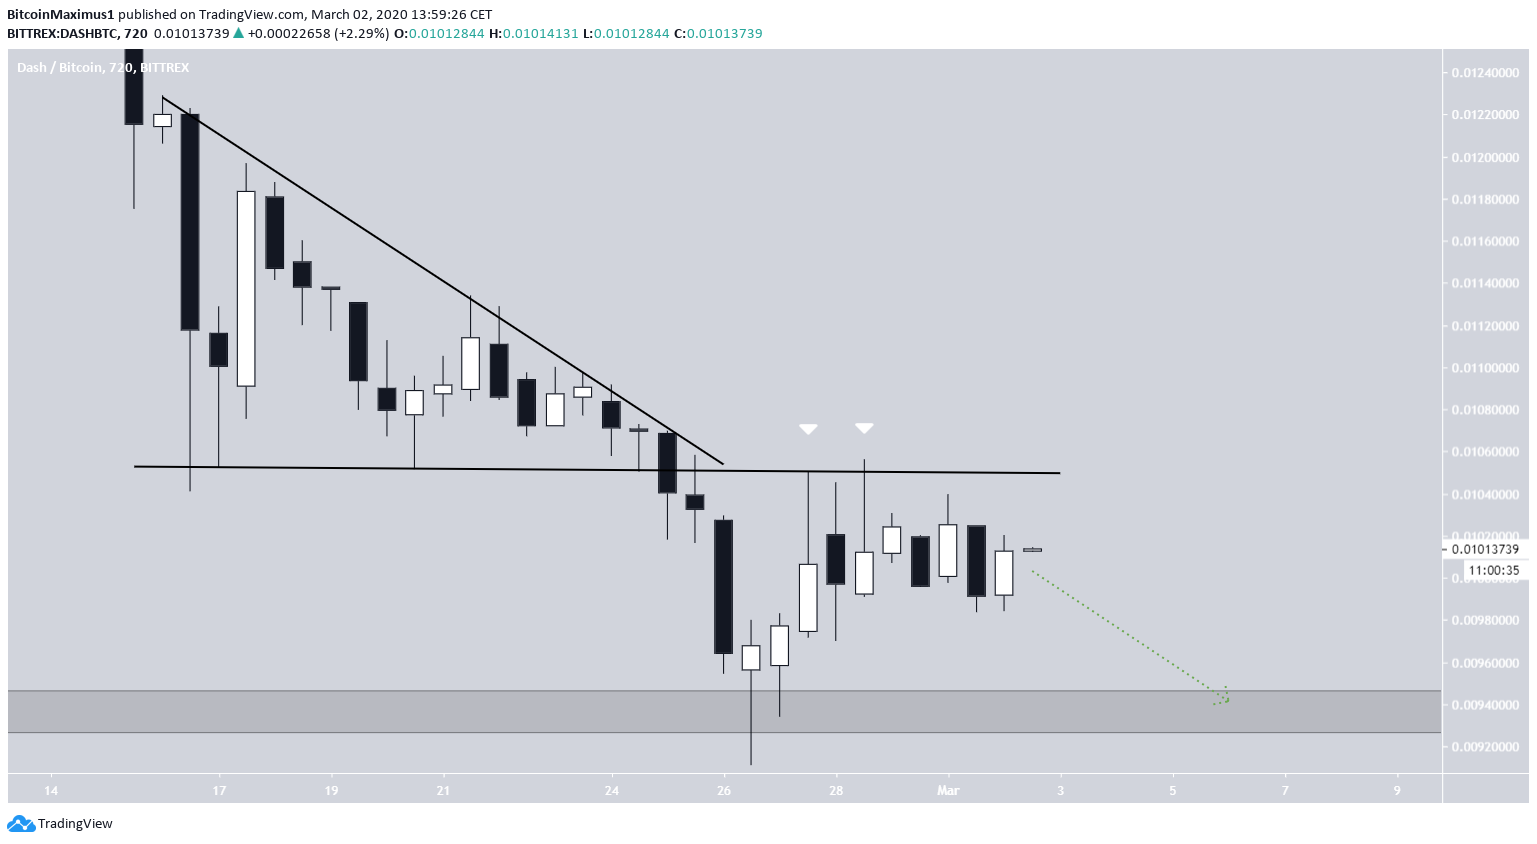
On February 25, the DASH price broke down from a descending triangle. After reaching the support area the next day, it began a reversal. However, the rally ended once the price reached the support line of the triangle, validating it as resistance twice in the form of long upper wicks. After this rejection, the most logical movement would be a drop towards the support area.
Let’s go to a shorter time-frame to see if that will occur.
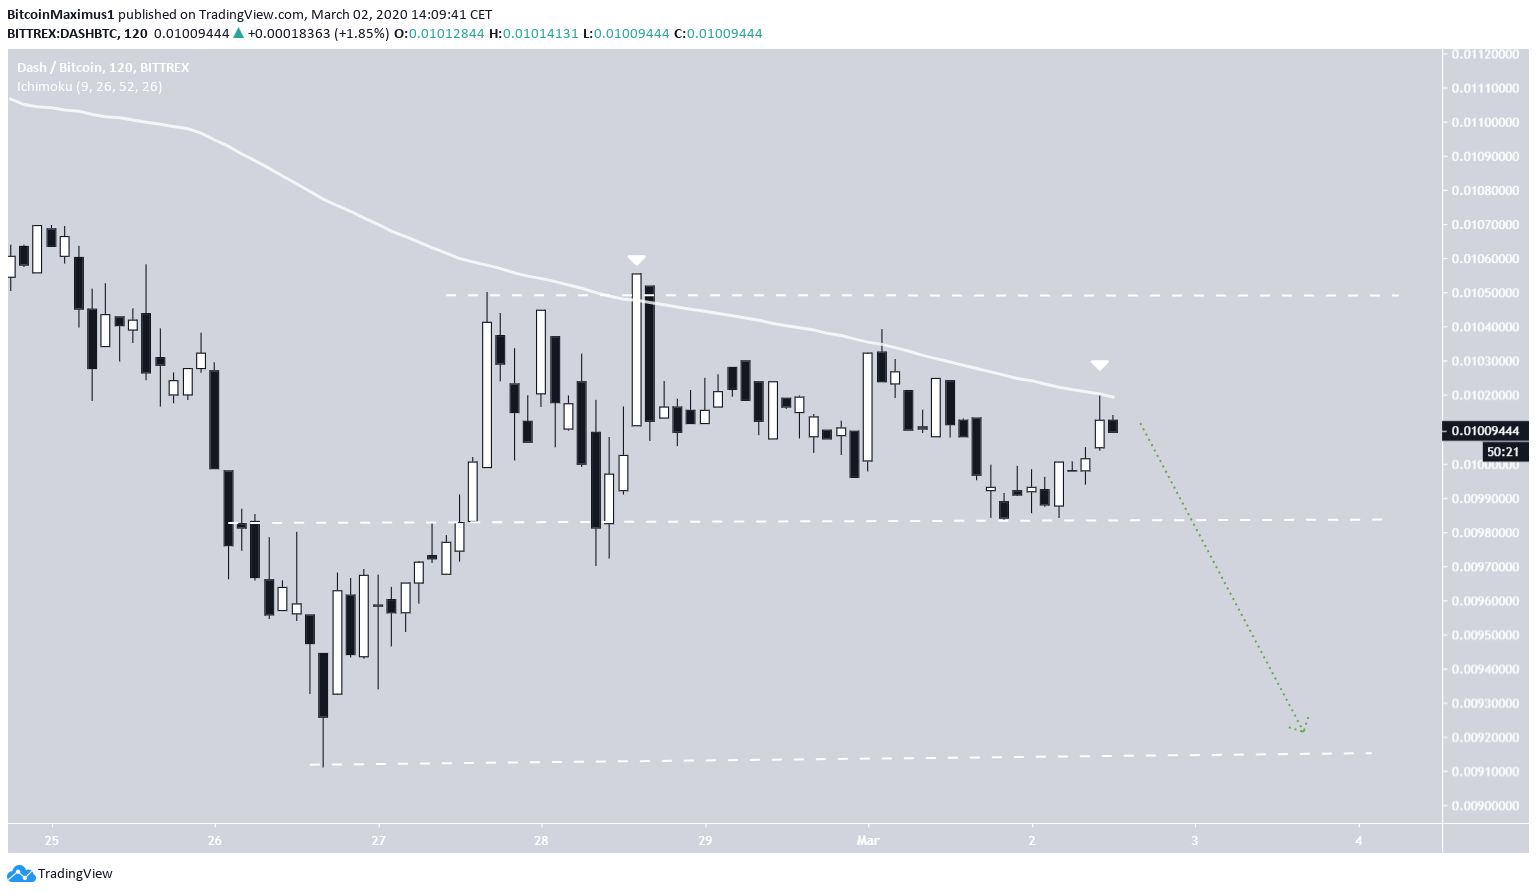
In the short-term, we can see that the DASH price is trading in a range between ₿0.0092 and ₿0.01056. While it is still trading in the upper portion of this range, the future outlook seems grim.
The price is facing very close resistance from the 200-hour MA. In addition, each successive bounce at the midpoint of the range has been weaker than the preceding one.
Therefore, this occurrence fits with the hypothesis from the previous section — indicating that the price will fall towards the range low at ₿0.0092.
To conclude, the DASH price has recently validated as resistance the pattern it previously broke down from. We believe that it will decrease until it reaches ₿0.0092 before possibly making another attempt at moving upwards.


