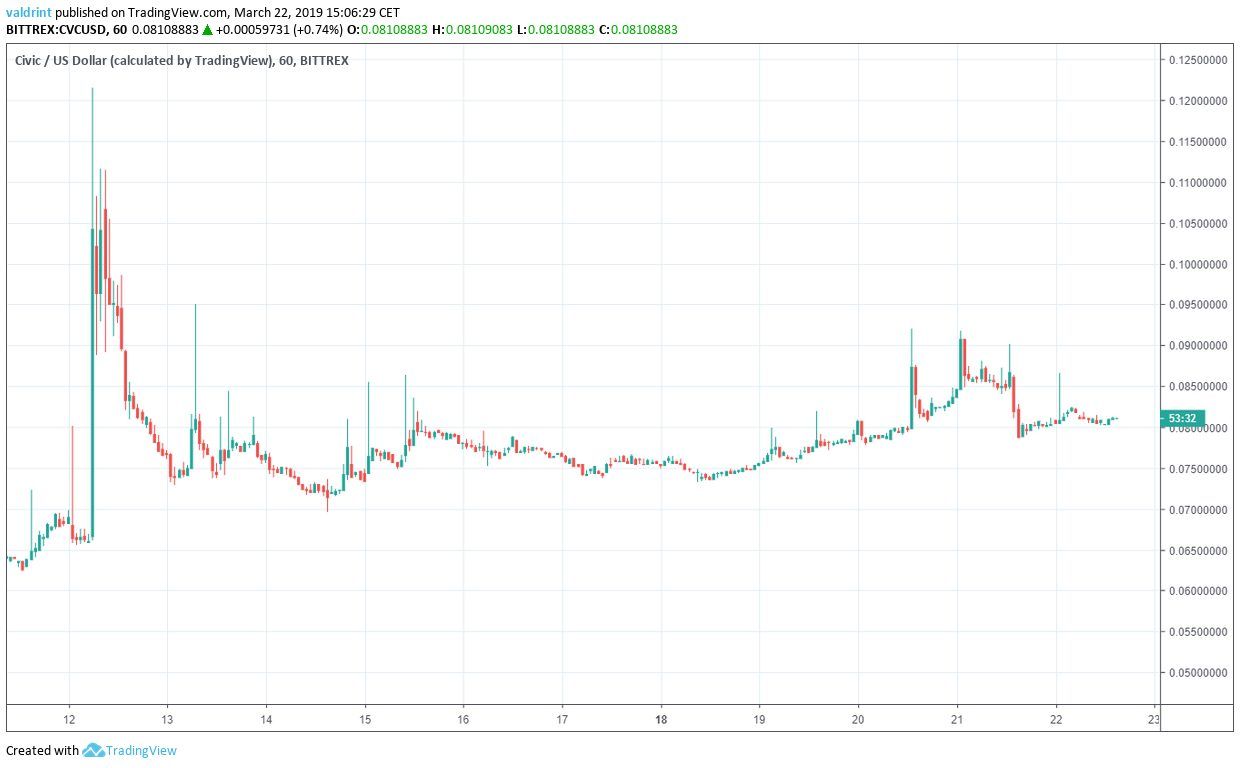
On Mar 12, 2019, the price of Civic (CVC) initiated a rapid upward move and made a high of $0.121. Price gradually dropped as a correction began. However, after making a low of nearly $0.07 on Mar 16, price has been steadily increasing.
Civic (CVC) Price Fluctuations: March 12-22, 2019
in our Mar 12 Civic price analysis we predicted that price would steadily decrease towards the support line. Since that time, the price has decreased. Furthermore, these losses have resulted in the emergence of a new ascending support line.
Based on today’s analysis, we predict slight price increases before a breakout that may initiate more rapid rises.
Civic (CVC): Trends And Highlights For March 22, 2019.
The price of Civic has been on a gradual uptrend since Mar 11.
The price of CVC on Bittrex is analyzed at one-hour intervals from Mar 12 to Mar 22.
The price made a low of $0.062 on Mar 11. It has made successively higher lows since. Tracing these lows gives us the ascending support line.
The support line can effectively act as a floor tracing the lower limits of price for a given period. It also serves to measure the rate of increase.
The price has increased at the same rate as predicted by the support line. Using the support line alone, it is also likely that the price of CVC keeps increasing at this rate.
Ascending triangle
To better determine future possible prices, we analyse the resistance lines to analyze current trading patterns.
On Mar 12, the price made an hourly low of $0.089. A rapid drop began followed by a gradual increase. Price reached a level close to $0.089 five times. Tracing these highs gives us a horizontal resistance line.
The resistance line can act as a ceiling to price in the same way support acts as a floor.
Movement above the line such as the wick highs of $0.095 and $0.091 on Mar 13 and Mar 20 respectively can be considered insignificant since they were not supported by continuous movement above the line.
The $0.089 level is chosen for the resistance and not the aforementioned highs since the drop on Mar 12 intensified after breaking down from that level. Furthermore, the close on Mar 20 was near the same level.
The resistance and support lines combine to create an ascending triangle, which is a bullish pattern, making price increases more likely.
The triangle is a better predictor of price fluctuations than support or resistance lines alone.
It is likely that the price keeps trading inside the confines of the ascending triangle until a point of convergence occurs. At that time, it is more likely that the price breaks out following price increases.
RSI Divergence
The relative strength index (RSI) is an indicator which calculates the size of the changes in price in order to determine oversold or overbought conditions in the market.
Combining RSI bullish/bearish divergence with support/resistance essentially predicts price fluctuations.
On Mar 20, the price made a high of $0.091. It revisited the same level twice on Mar 21.
Similarly, the RSI made a high on Mar 21. However, it has proceeded to generate lower values. This is known as bearish divergence and often precedes drops in price.
However, it is occurring in a bullish pattern, and a drop has already occurred. This suggests that the continued price increases we’ve predicted so far may still be forthcoming.
Future Movements
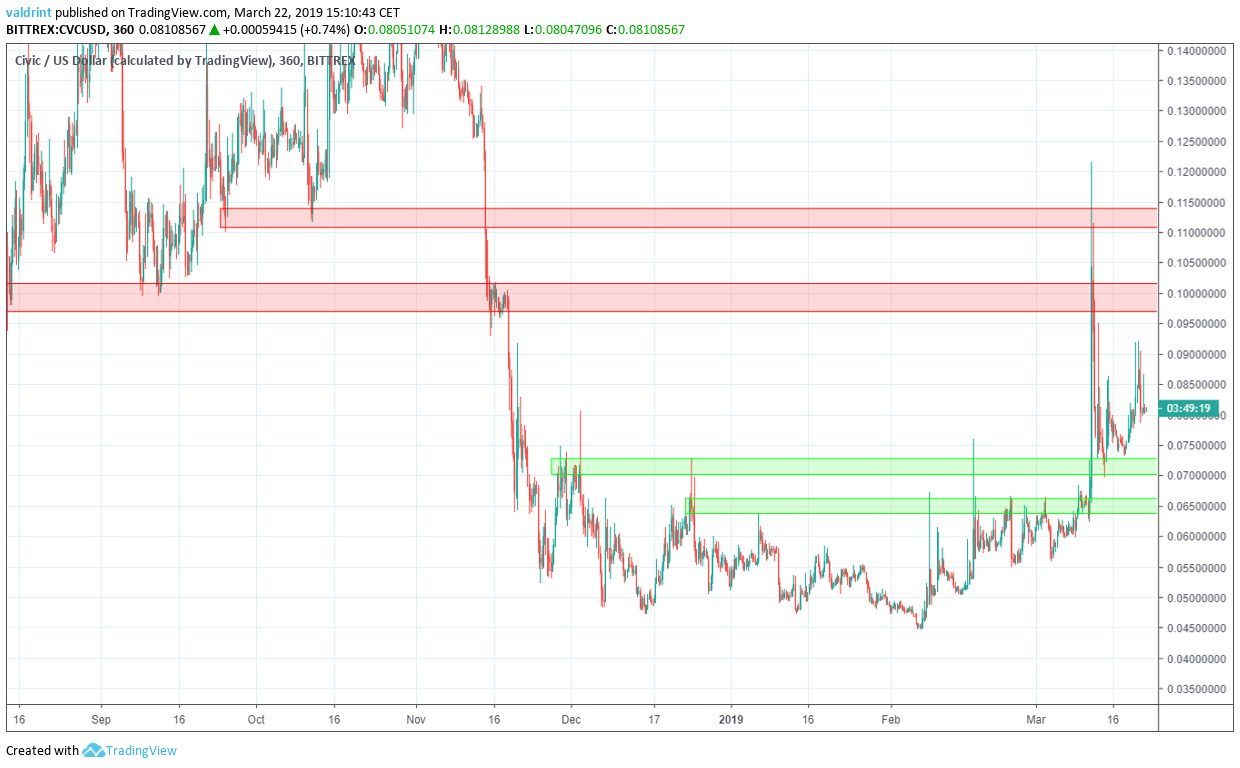
The price of CVC on Bittrex is analyzed at six-hour intervals from Aug 16, 2018 to Mar 22, 2019. This is done in order to better visualize future possible price levels.
The support areas are found near $0.071 and $0.065 respectively. These provide likely areas of reversal when the price stabilizes.
Resistance areas are found near $0.1 and $0.112. While price initially broke through both of them, the increase was not sustained and is currently trading below them. If the price initiates another upward move, these two areas would present a likely place where it could come to a stop.
Summary of Analysis
Based on this analysis, it is likely that the price keeps trading inside the triangle until a breakout occurs. If it does, the prediction will be validated. If the price breaks down below support, this prediction will be invalidated.
Do you think the price will break out of the triangle? Let us know in the comments.
Disclaimer: This article is not trading advice and should not be construed as such. Always consult a trained financial professional before investing in cryptocurrencies, as the market is particularly volatile.
In line with the Trust Project guidelines, this price analysis article is for informational purposes only and should not be considered financial or investment advice. BeInCrypto is committed to accurate, unbiased reporting, but market conditions are subject to change without notice. Always conduct your own research and consult with a professional before making any financial decisions. Please note that our Terms and Conditions, Privacy Policy, and Disclaimers have been updated.
Valdrin discovered cryptocurrencies while he was getting his MSc in Financial Markets from the Barcelona School of Economics. Shortly after graduating, he began writing for several different cryptocurrency related websites as a freelancer before eventually taking on the role of BeInCrypto's Senior Analyst.
(I do not have a discord and will not contact you first there. Beware of scammers)


 The support line can effectively act as a floor tracing the lower limits of price for a given period. It also serves to measure the rate of increase.
The price has increased at the same rate as predicted by the support line. Using the support line alone, it is also likely that the price of CVC keeps increasing at this rate.
The support line can effectively act as a floor tracing the lower limits of price for a given period. It also serves to measure the rate of increase.
The price has increased at the same rate as predicted by the support line. Using the support line alone, it is also likely that the price of CVC keeps increasing at this rate.
 The resistance line can act as a ceiling to price in the same way support acts as a floor.
Movement above the line such as the wick highs of $0.095 and $0.091 on Mar 13 and Mar 20 respectively can be considered insignificant since they were not supported by continuous movement above the line.
The $0.089 level is chosen for the resistance and not the aforementioned highs since the drop on Mar 12 intensified after breaking down from that level. Furthermore, the close on Mar 20 was near the same level.
The resistance and support lines combine to create an ascending triangle, which is a bullish pattern, making price increases more likely.
The triangle is a better predictor of price fluctuations than support or resistance lines alone.
It is likely that the price keeps trading inside the confines of the ascending triangle until a point of convergence occurs. At that time, it is more likely that the price breaks out following price increases.
The resistance line can act as a ceiling to price in the same way support acts as a floor.
Movement above the line such as the wick highs of $0.095 and $0.091 on Mar 13 and Mar 20 respectively can be considered insignificant since they were not supported by continuous movement above the line.
The $0.089 level is chosen for the resistance and not the aforementioned highs since the drop on Mar 12 intensified after breaking down from that level. Furthermore, the close on Mar 20 was near the same level.
The resistance and support lines combine to create an ascending triangle, which is a bullish pattern, making price increases more likely.
The triangle is a better predictor of price fluctuations than support or resistance lines alone.
It is likely that the price keeps trading inside the confines of the ascending triangle until a point of convergence occurs. At that time, it is more likely that the price breaks out following price increases.
 On Mar 20, the price made a high of $0.091. It revisited the same level twice on Mar 21.
Similarly, the RSI made a high on Mar 21. However, it has proceeded to generate lower values. This is known as bearish divergence and often precedes drops in price.
However, it is occurring in a bullish pattern, and a drop has already occurred. This suggests that the continued price increases we’ve predicted so far may still be forthcoming.
On Mar 20, the price made a high of $0.091. It revisited the same level twice on Mar 21.
Similarly, the RSI made a high on Mar 21. However, it has proceeded to generate lower values. This is known as bearish divergence and often precedes drops in price.
However, it is occurring in a bullish pattern, and a drop has already occurred. This suggests that the continued price increases we’ve predicted so far may still be forthcoming.
 The support areas are found near $0.071 and $0.065 respectively. These provide likely areas of reversal when the price stabilizes.
Resistance areas are found near $0.1 and $0.112. While price initially broke through both of them, the increase was not sustained and is currently trading below them. If the price initiates another upward move, these two areas would present a likely place where it could come to a stop.
The support areas are found near $0.071 and $0.065 respectively. These provide likely areas of reversal when the price stabilizes.
Resistance areas are found near $0.1 and $0.112. While price initially broke through both of them, the increase was not sustained and is currently trading below them. If the price initiates another upward move, these two areas would present a likely place where it could come to a stop.
