


On April 29, the Bitcoin price created a massive bullish engulfing candlestick, moving above several resistance levels without experiencing any retracement at all.
The candlestick had a body of $1,000, an increase of 14% from its opening price. In this article, we will analyze the price movement of Bitcoin along with nine other coins in order to determine their expected future movements.
Bitcoin (BTC)
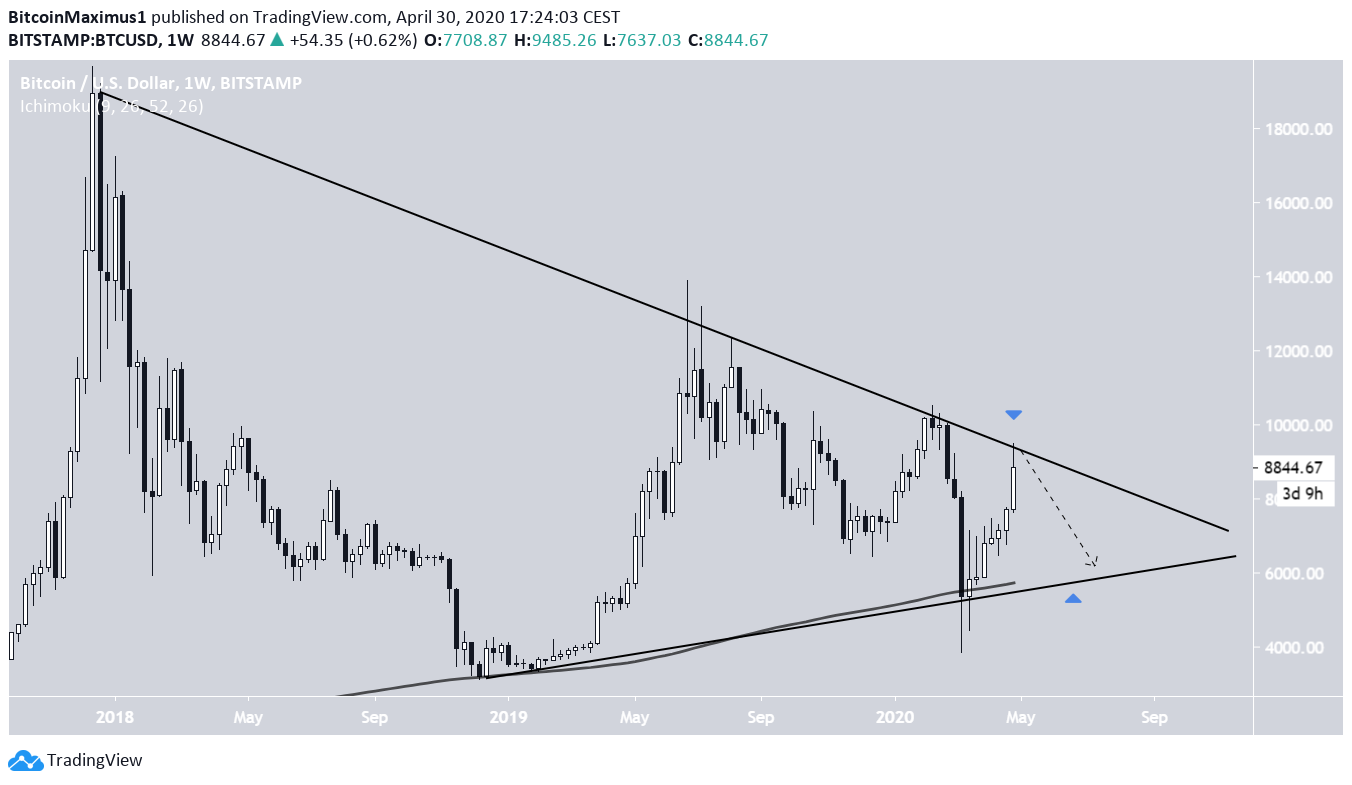
The Bitcoin price has traded inside a very long-term symmetrical triangle since it reached an all-time high price in December 2017. The price did not validate this line until July 2019, and then afterwards in March 2020, right before the rapid March 13 crash.
Yesterday’s increase has taken the price all the way to this resistance line, where it has decreased slightly. If the price does not break out soon, it is likely to decrease towards the support line of the triangle, which is found slightly above $6,000. This area is also supported by the 200-week MA.
On the other hand, a breakout would likely cause a very rapid movement towards the July highs at $14,000.
Ethereum (ETH)
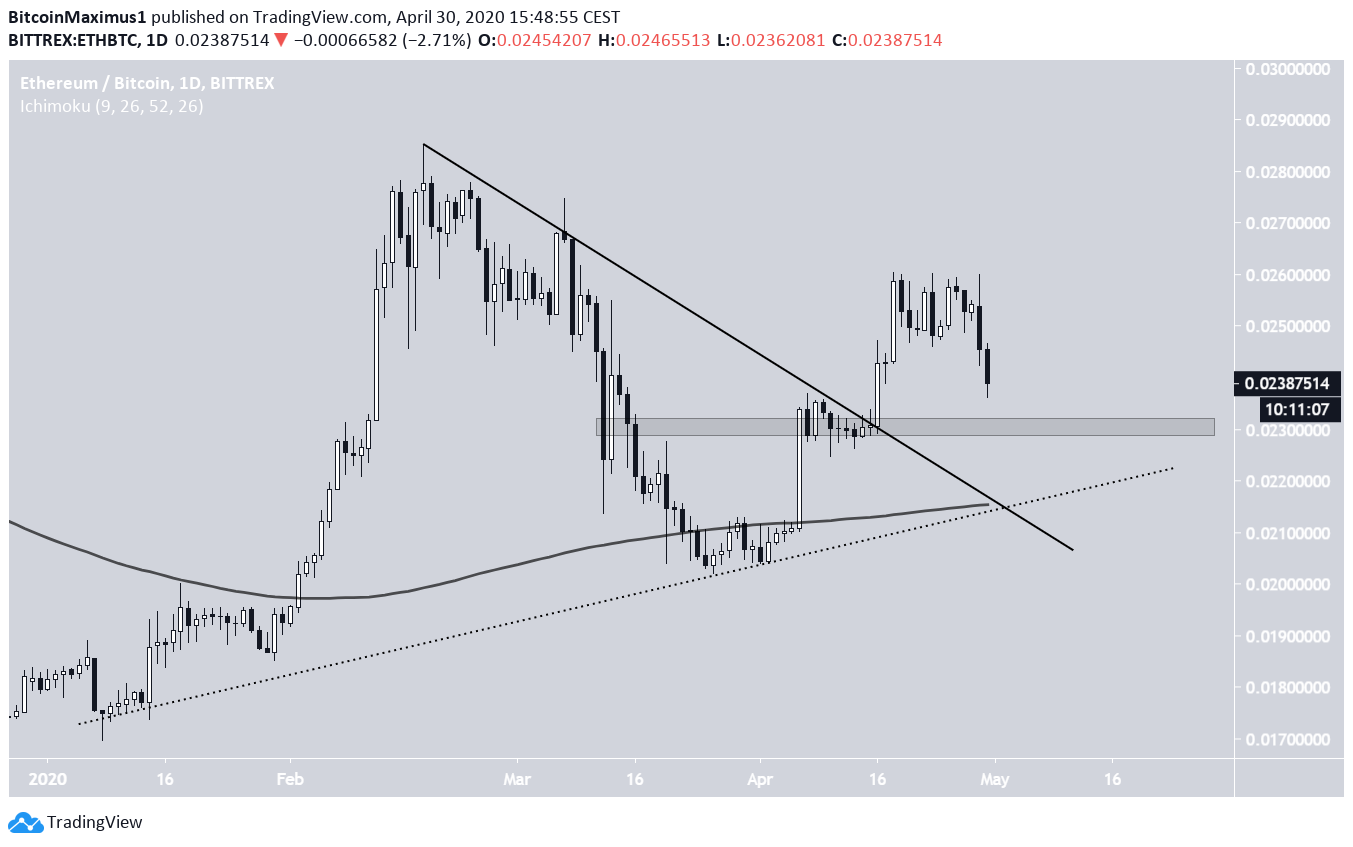
On April 16, the Ethereum price broke from a descending trend-line. The price continued to increase until April 18, when it reached a high of ₿0.026. The ETH price has been decreasing since.
While it initially consolidated near the same level, the price broke down on April 29, creating a bearish engulfing candlestick with a long lower wick.
Since the price broke out from the descending resistance line, it has yet to validate the line as support, which is a common movement after breakouts. If it were to do that, the likeliest level would be at ₿0.0205, a level supported by both the 200-day moving average (MA) and the ascending support line (dashed).
If the price reverses beforehand, the closest support area is found at ₿0.023.
XRP (XRP)
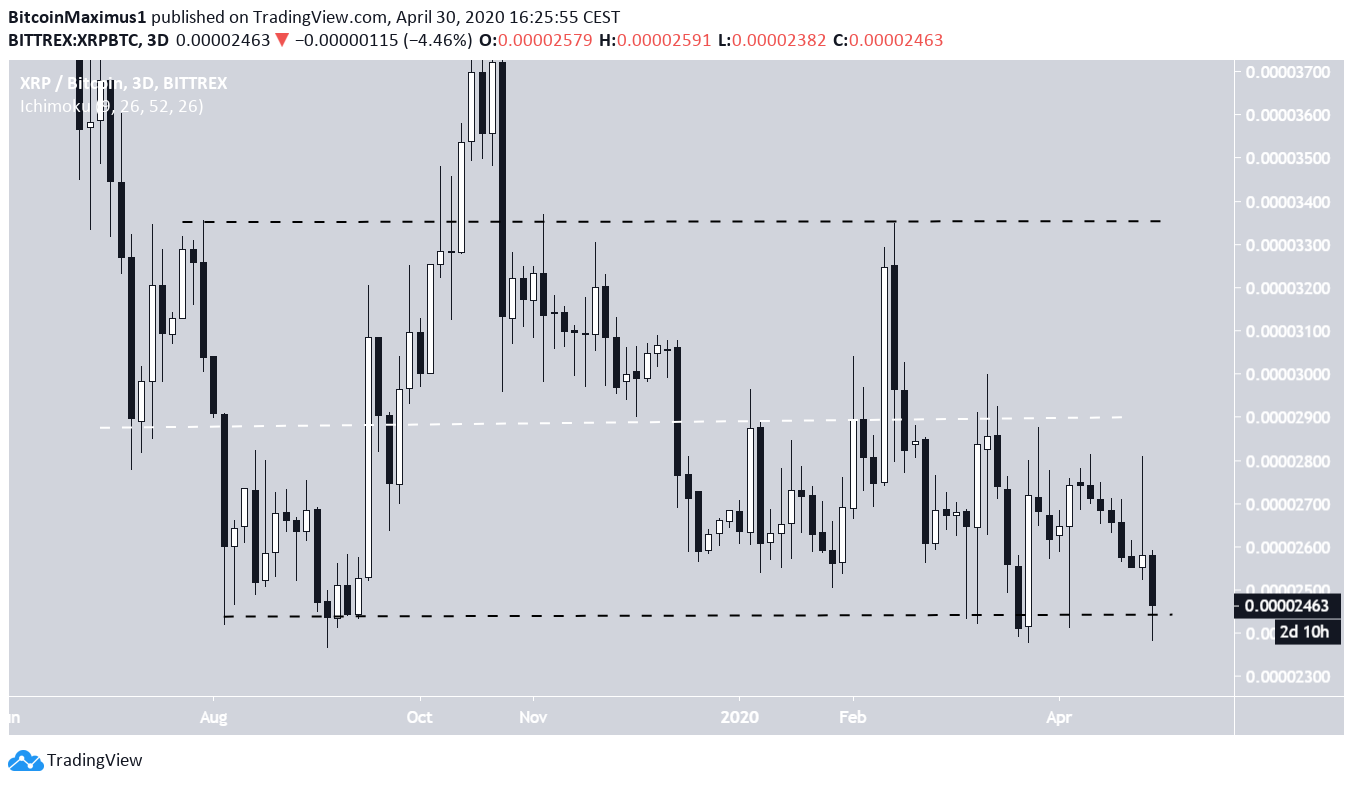
The XRP price has been trading in a range between 2,250 and 3,350 satoshis since August 2019. At the time of writing, it was trading very close to the support line of this range, having touched it for the sixth time. The price has not shown any signs of a reversal, namely in the form of bullish divergence or a bullish moving average (MA) cross.
However, until the price breaks down from this range, we are operating on the assumption that the price is likely to move upwards towards the resistance line of the range. If it begins an upward move, it is likely to first reach the EQ at 2,900 satoshis, before moving towards the range high at 3,350 satoshis.
Bitcoin Cash (BCH)
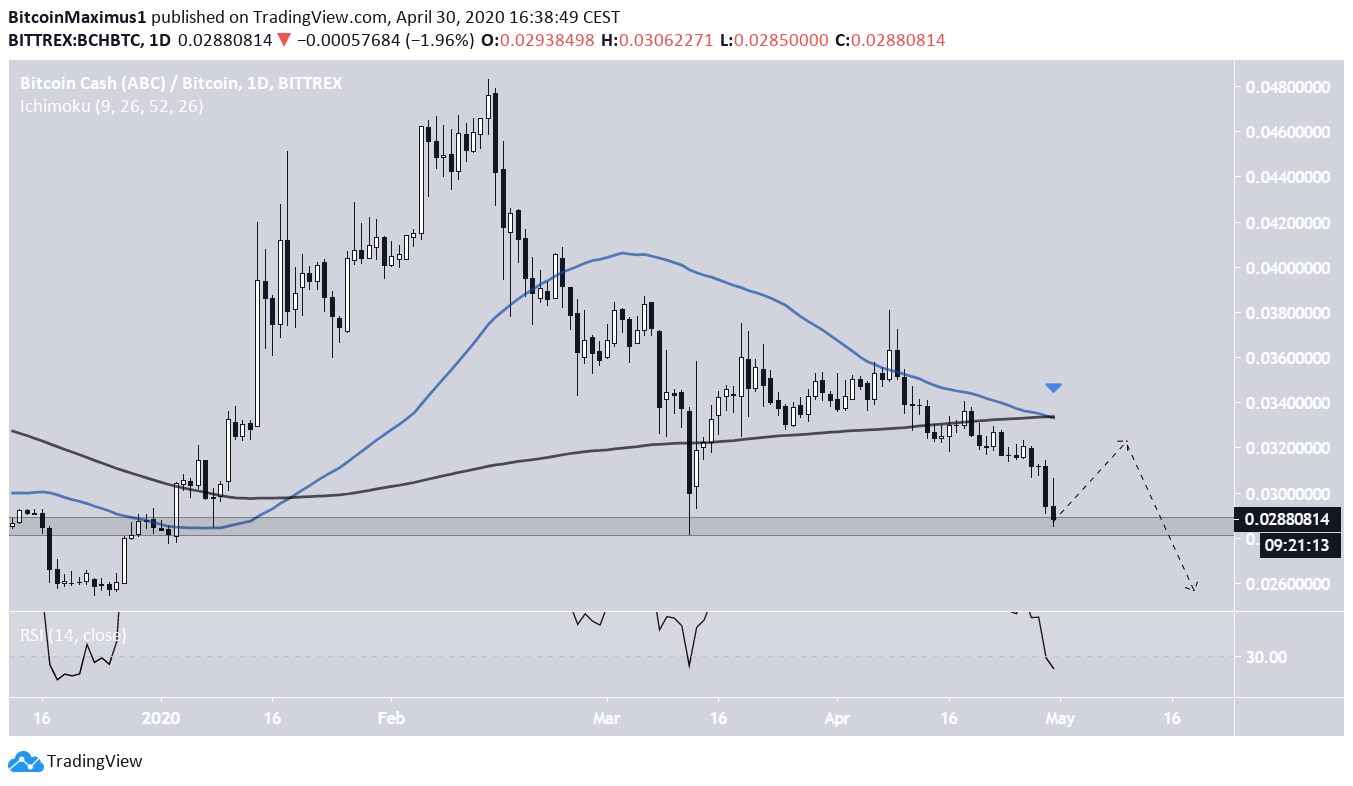
On March 12, the BCH price reached the main support area at ₿0.0285 and began an upward move that continued until April 8. The BCH price has been decreasing since, reaching the aforementioned support area once more on April 30.
Technical indicators are bearish. First, there is a bearish cross that has transpired between the 50- and 200-period MAs, both of which are offering resistance to the price. While the RSI is oversold, it has yet to generate any type of bearish divergence.
Therefore, while the price could increase and validate the 200-day MA as resistance, it is expected to decrease afterwards, possibly moving towards the original low of ₿0.026, where the price began its previous upward move.
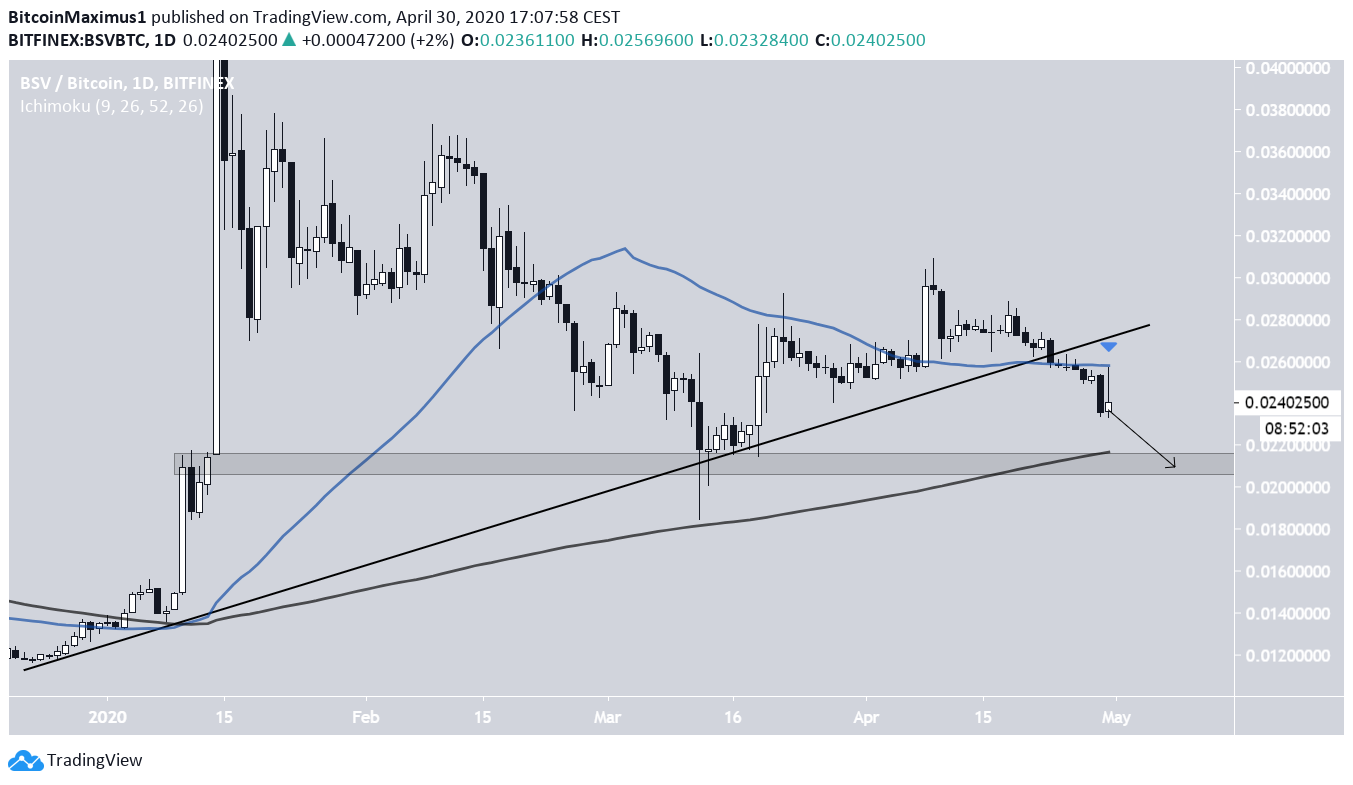
Bitcoin SV (BSV)
The BSV price had been following an ascending support line beginning from December 2019. The price touched this line numerous times, increasing at its slope until April 24, when it broke down. Since the breakdown, the price validated the 50-day MA as resistance and has been moving downwards since.
The closest support area is found at ₿0.0210, a level which is also strengthened by the 200-day MA. The price is expected to continue its descent until it reaches this level, before possibly initiating an upward move.
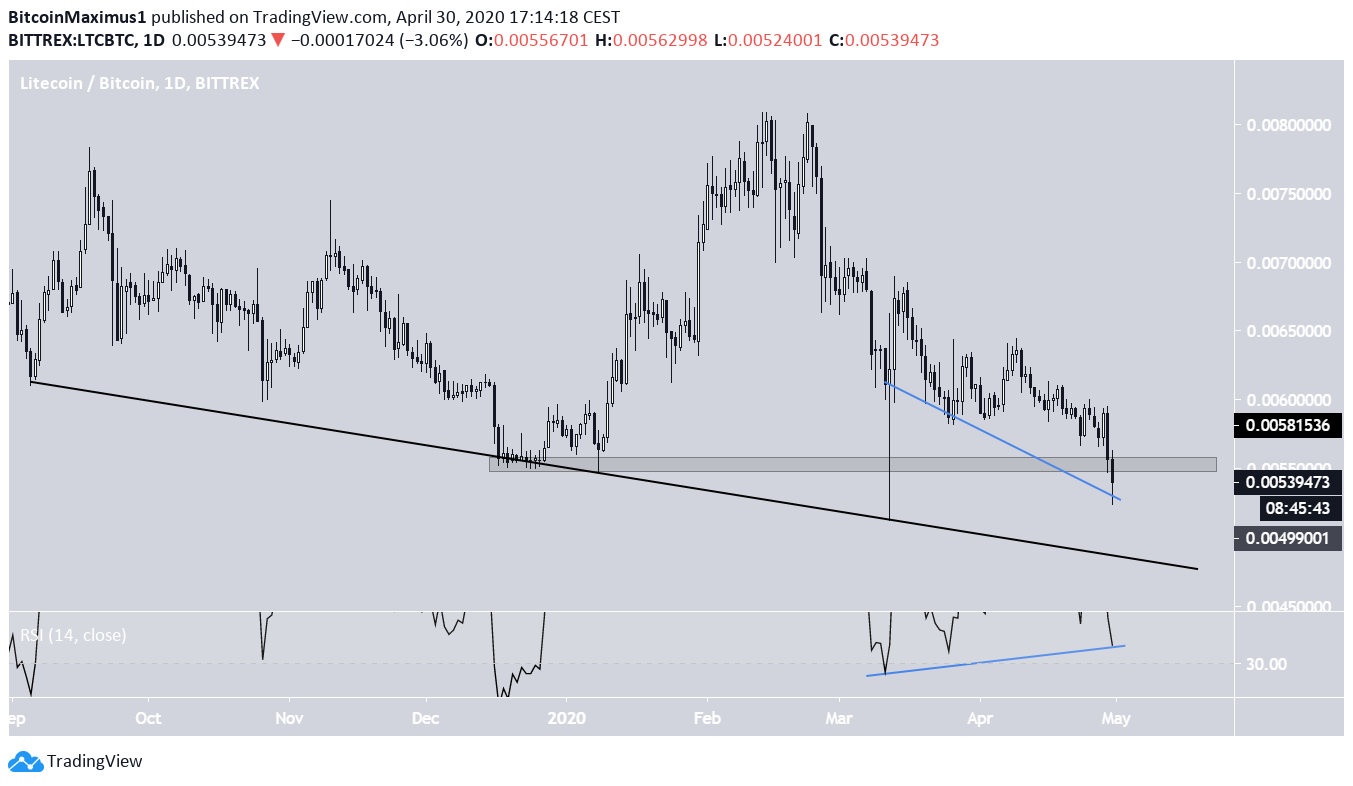
Litecoin (LTC)
The Litecoin price has been following a descending support line since September 2019. The price has touched this descending support line four times until now. At the time of writing, the price was trading the ₿0.0055 area, which offers minor support. There is a growing bullish divergence in the daily RSI, which, however, has not been confirmed yet.
If the price continues to move downwards, which seems likely, the price is expected to reach the support line once more, which is currently at ₿0.005.
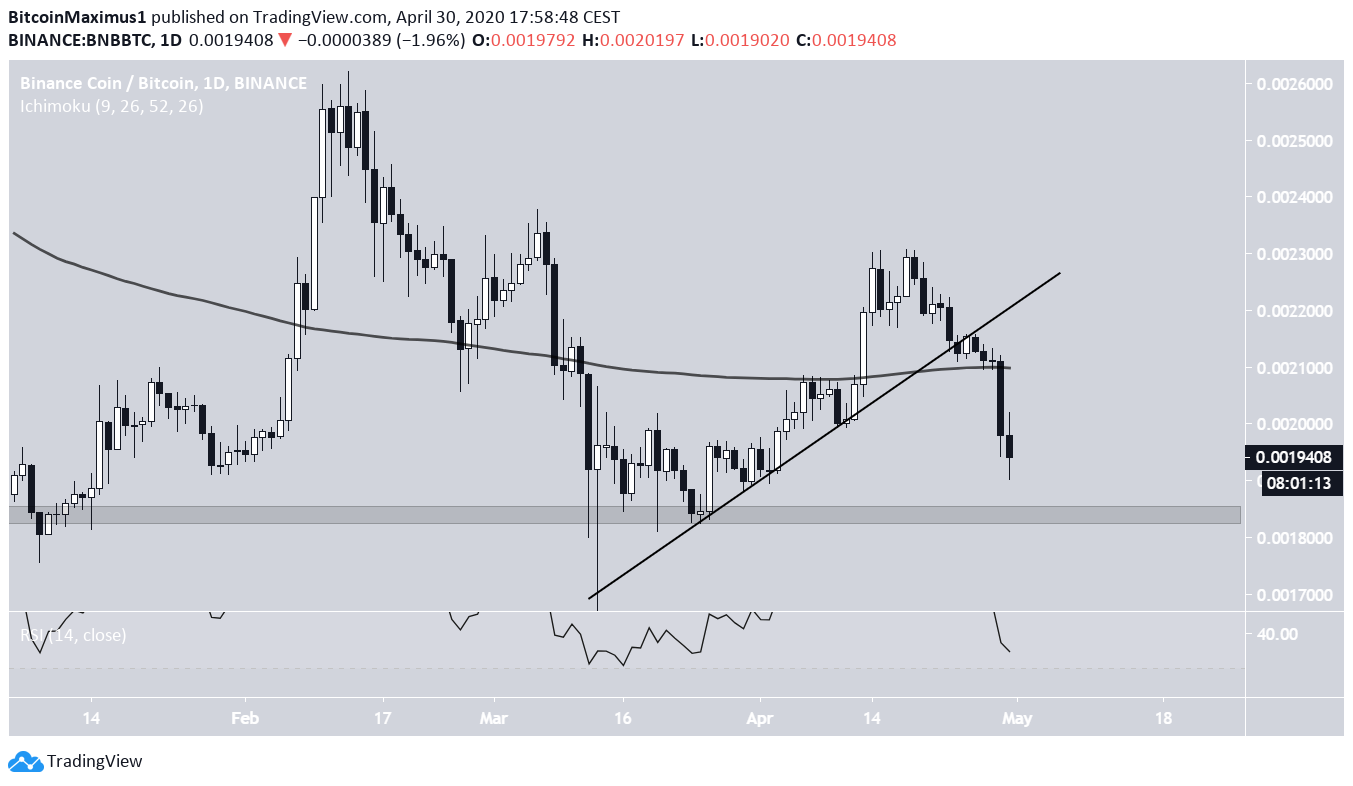
Binance Coin (BNB)
The Binance Coin price broke down from an ascending support line on April 24. It followed this decrease by another bearish engulfing candlestick on April 29, one that caused the price to lose the support given by the 200-day MA.
The price is not trading inside any support areas, and there is no bullish divergence in the RSI to suggest an impending breakout.
Therefore, the price is expected to decrease until it reaches the support area at ₿0.00285.
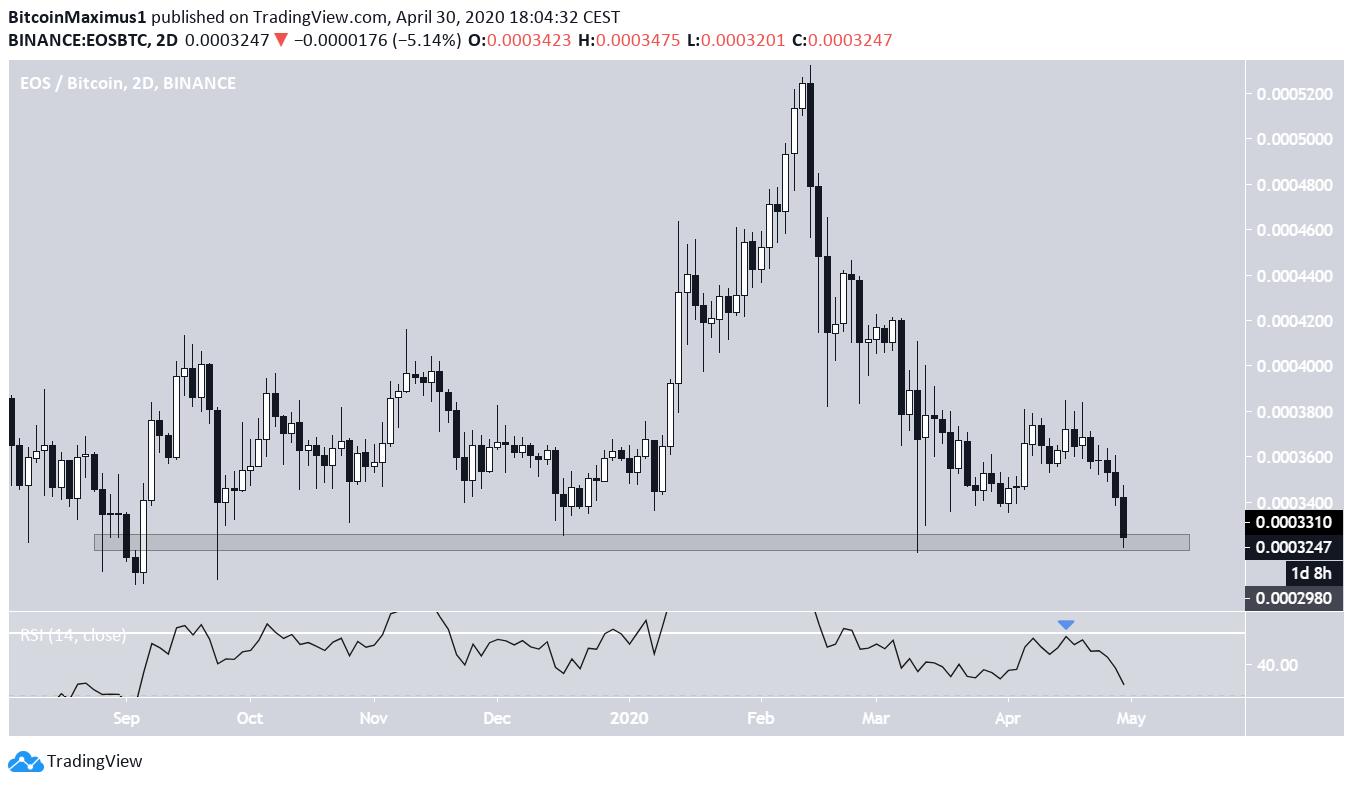
EOS (EOS)
The EOS price has been decreasing since reaching a high of 5,321 satoshis on Feb. 15. At the time of writing, the price was trading inside the 3,250 satoshi area, which has been offering support since September 2019.
While this is a crucial support area that could initiate a reversal, there are no signs that point to one. There is no bullish divergence in the RSI; to the contrary, the RSI was rejected by the 50 line and has moved downwards since.
Therefore, the price is expected to trade close to this support area. A breakdown could trigger a very rapid decrease, but that does not seem likely due to the buying pressure noted by numerous long lower wicks.
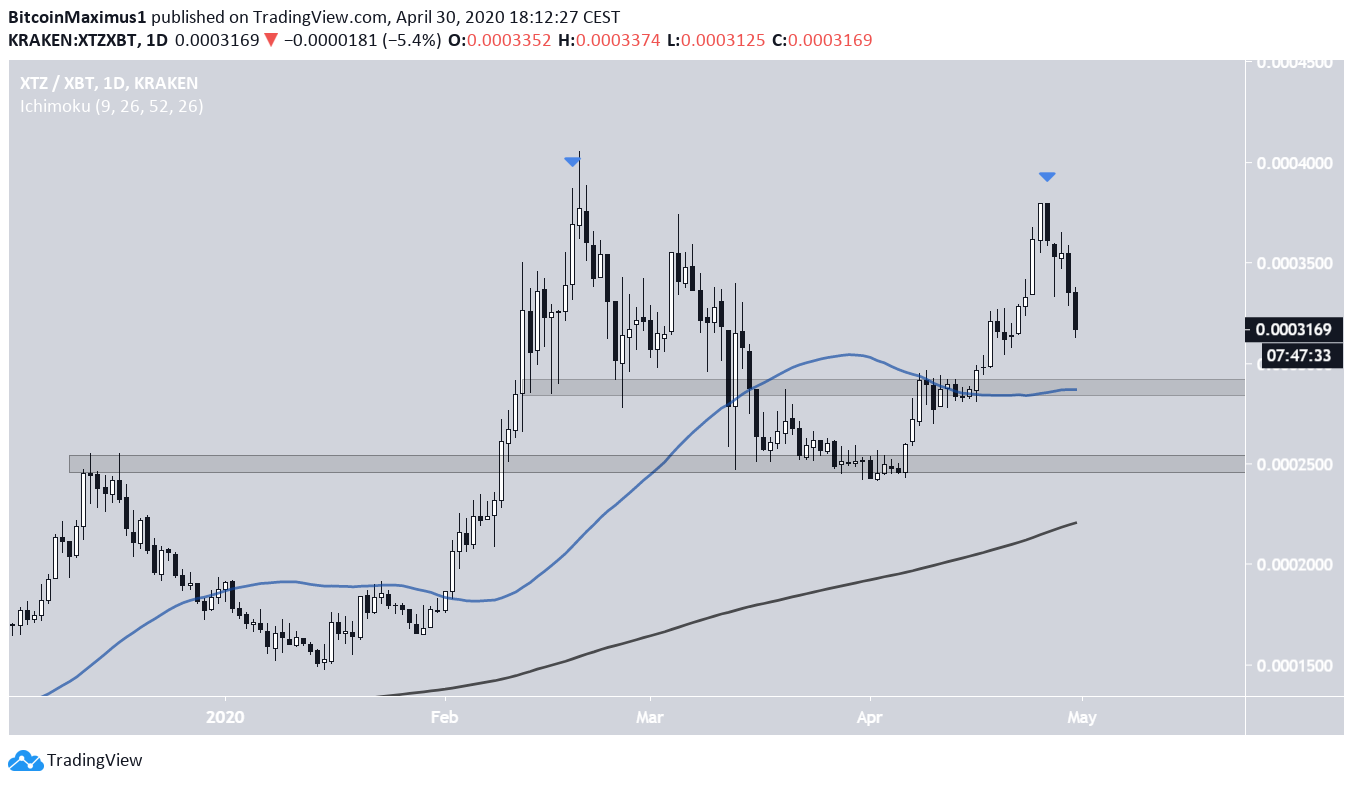
Tezos (XTZ)
The XTZ price reached a high of 37,920 satoshis on April 26. Relative to the all-time high price reached on Feb. 20, this created a double top. The price has been decreasing since then. At the time of writing, the price was trading at 31,500 satoshis.
The closest support area is found at 29,000 satoshis, strengthened by the 50-day MA. Below this, there is a major support area at 25,000 satoshis, which was the catalyst of this entire upward movement and is possibly strengthened by the 200-day MA.
The price is expected to decrease at least until it reaches the 29,000 satoshi area, and possibly the 25,000 satoshi one.
Chainlink (LINK)
The LINK price has been decreasing since April 20, when it reached a high of 52,600 satoshis. At the time of writing, it is trading at 42,000 satoshis, right above the 50-day MA.
The price is expected to bounce upwards from this level and validate the previous support area at 46,000 satoshis.
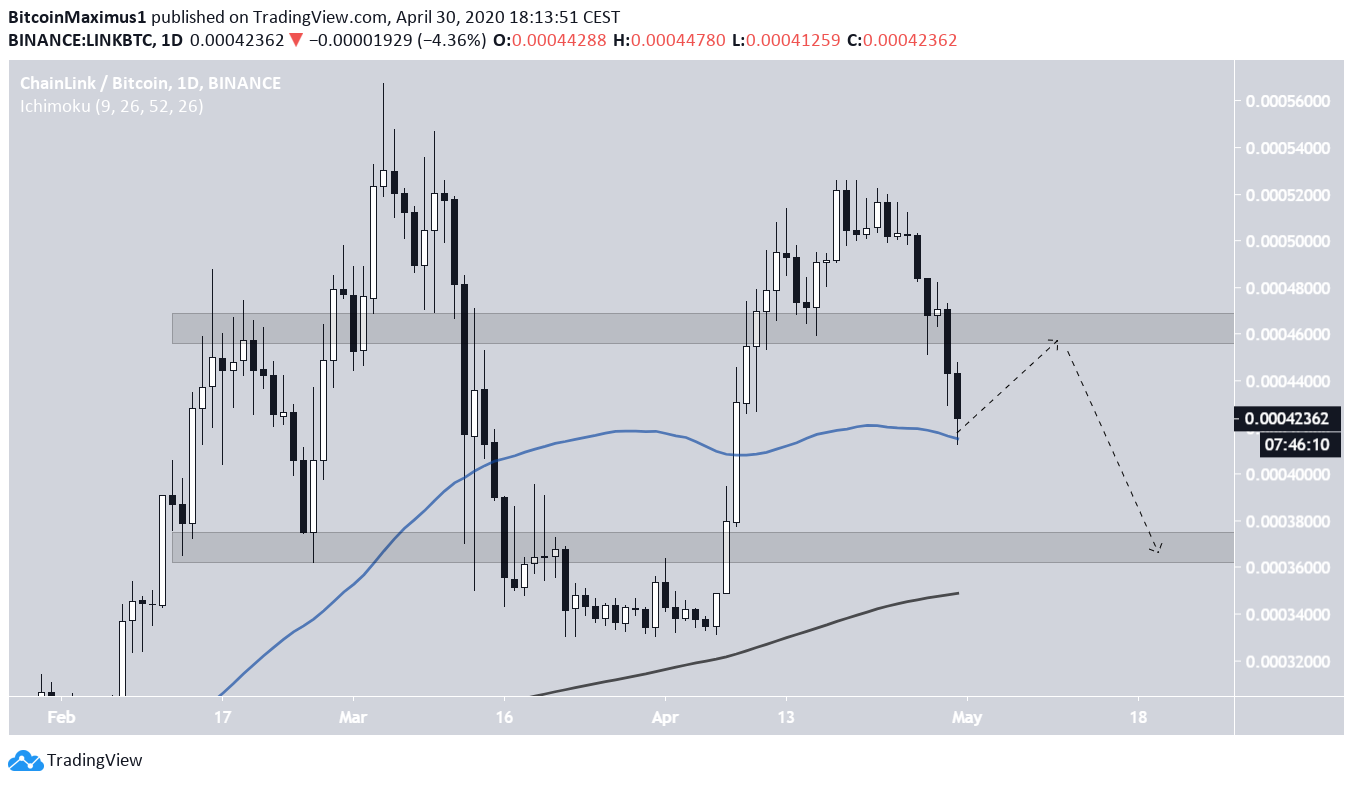
Afterwards, it is likely to decrease until 37,000 satoshis, a major support area strengthened by the presence of the 200-day MA.


