April 21 brought a new milestone to the Bitcoin (BTC) price. It was worth more than 7000 barrels of oil, significantly more than at any other point in history. However, this was not caused by an increase in the cryptocurrency’s price but rather a complete crash in the price of oil — which, at one point, had decreased by 99.99 percent within the day.
As for the Bitcoin price, it actually decreased by more than $400 throughout the day, falling back within the previous trading range. This could have continued bearish effects for the future since the price failed to sustain its previous breakout.
In this article, we will analyze ten coins individually and determine their expected future movements.
Bitcoin (BTC)
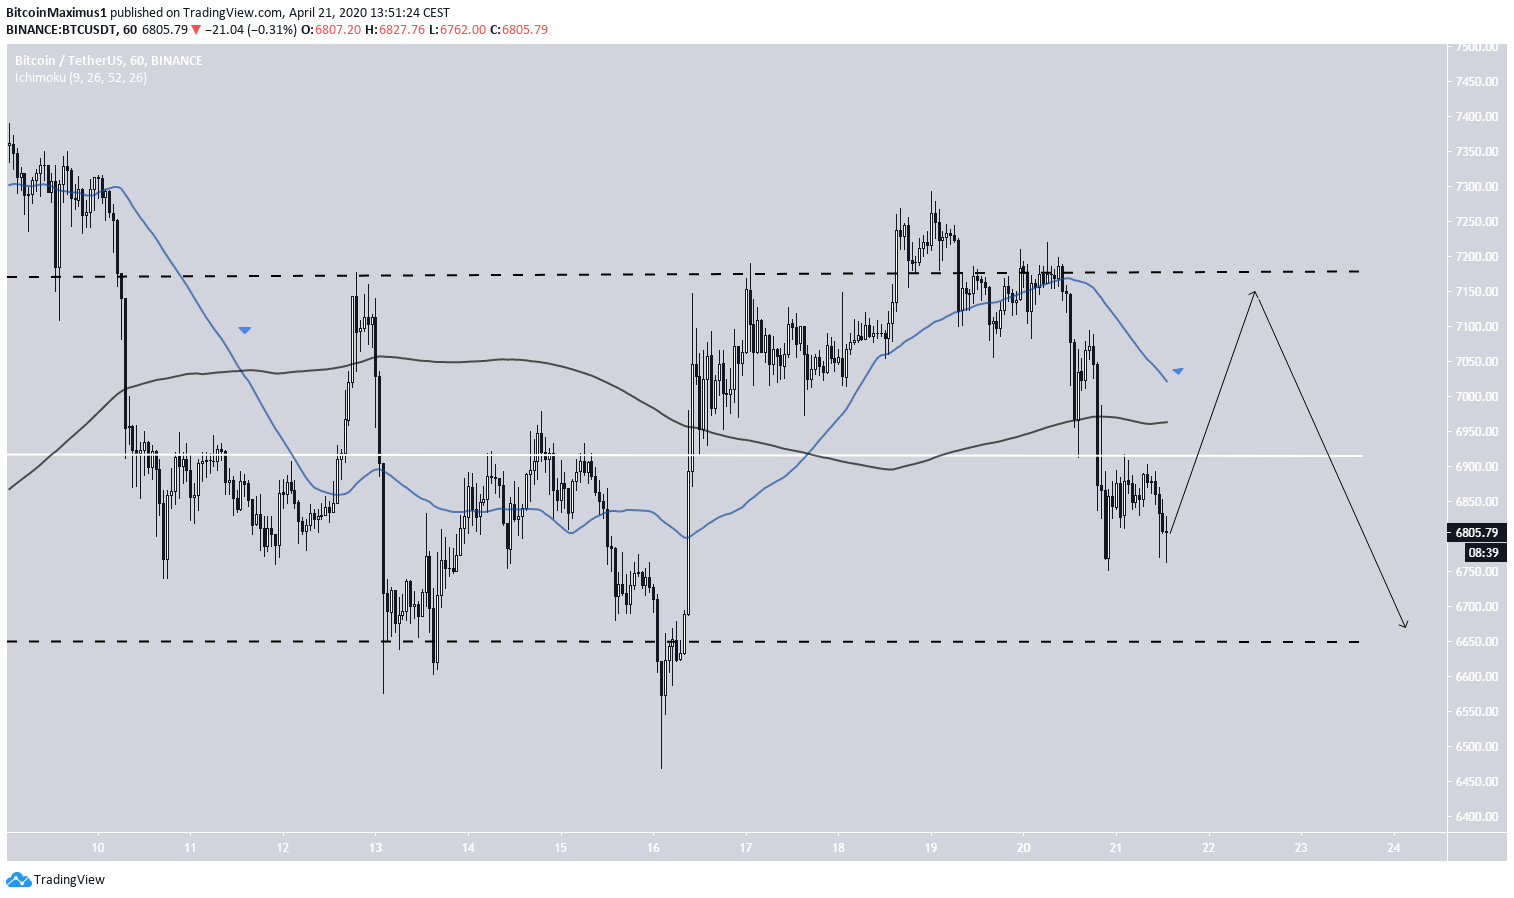
The aforementioned decrease caused the Bitcoin price to fall back inside the $6650-$7150 range. Initially, the price found support above the midpoint of the range but broke down shortly afterward.
An interesting development is the possible bearish cross between the 50- and 200-hour moving averages (MAs). The previous time this cross transpired was on April 11. At the time, the price began an upward move shortly afterward and touched the resistance of the range. A sharp drop followed.
If the same movement transpires this time around, the Bitcoin price will soon begin an upward move and reach the $7250 resistance once more before breaking down.
Ethereum (ETH)
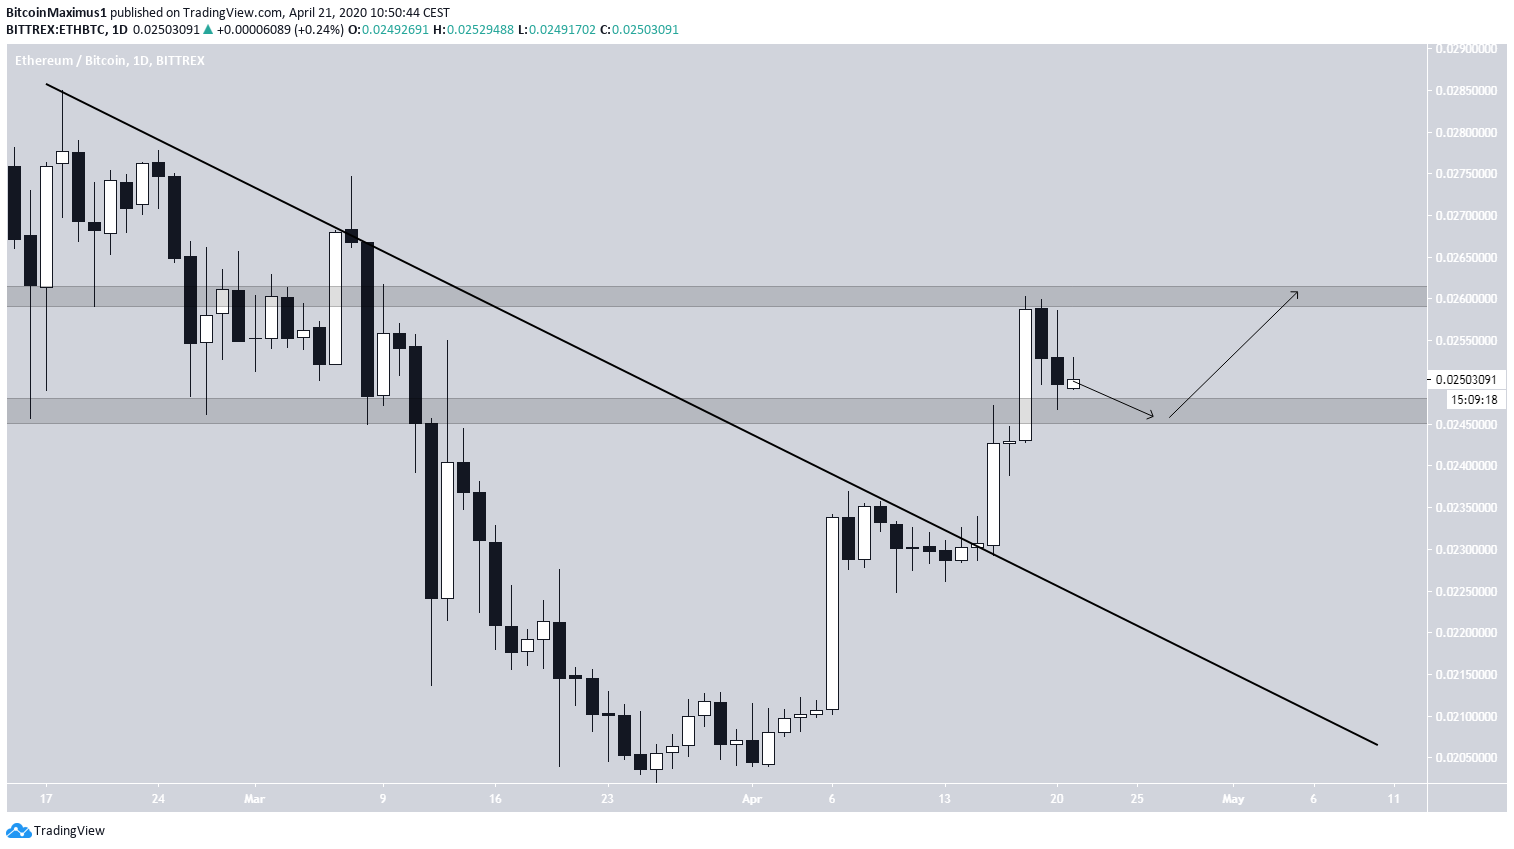
On April 16, the Ethereum price broke out from a descending resistance line. The price had previously been following this line for two months. The price continued to increase for the next two days — reaching a high of ₿0.026 on April 18 before decreasing.
The two most important levels are found at ₿0.026 and ₿0.0245, respectively. After breaking out above the latter, the price has returned to validate it as support. As long as it stays above this level, it is expected to move upward towards the resistance area and possibly break out.
The price has not yet generated any bearish divergence to suggest that it will break down. Therefore, it is possible that it continues to increase all the way to the top of the descending resistance line at ₿0.0285.
XRP (XRP)
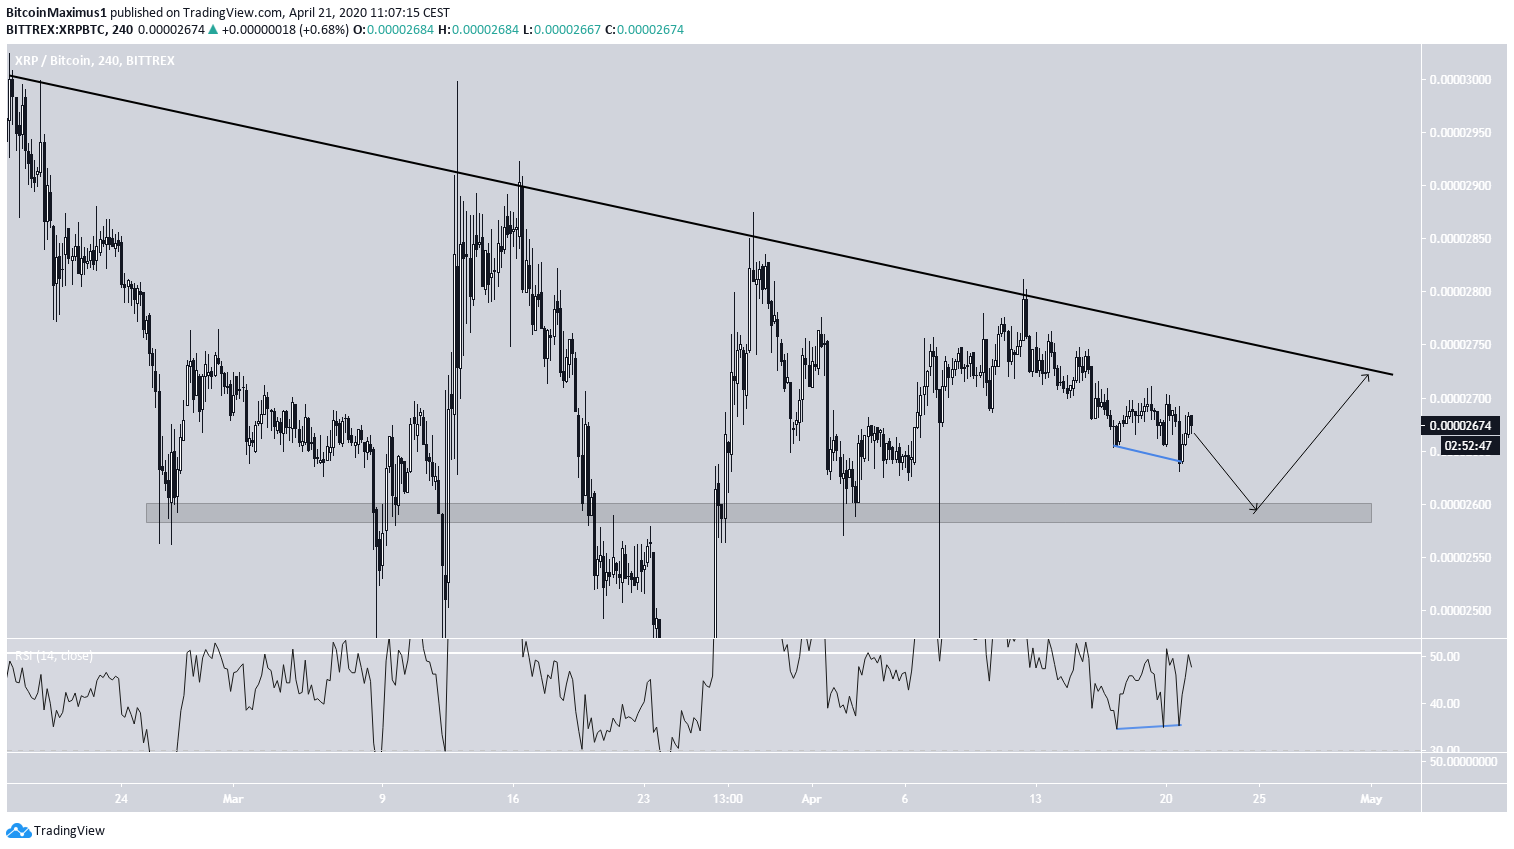
The XRP price has been decreasing along a descending resistance line since Feb. 18 and has validated it five times until now. At the time of writing, the price was trading between this descending resistance line and the 2600 satoshi support area. It has not reached either of them since April 9.
The RSI is below 50, indicating a bearish trend. However, it has also generated bullish divergence. Therefore, the price is expected to move towards the resistance line in the near future — after possibly validating the support area of 2600 satoshis once more.
Bitcoin Cash (BCH)
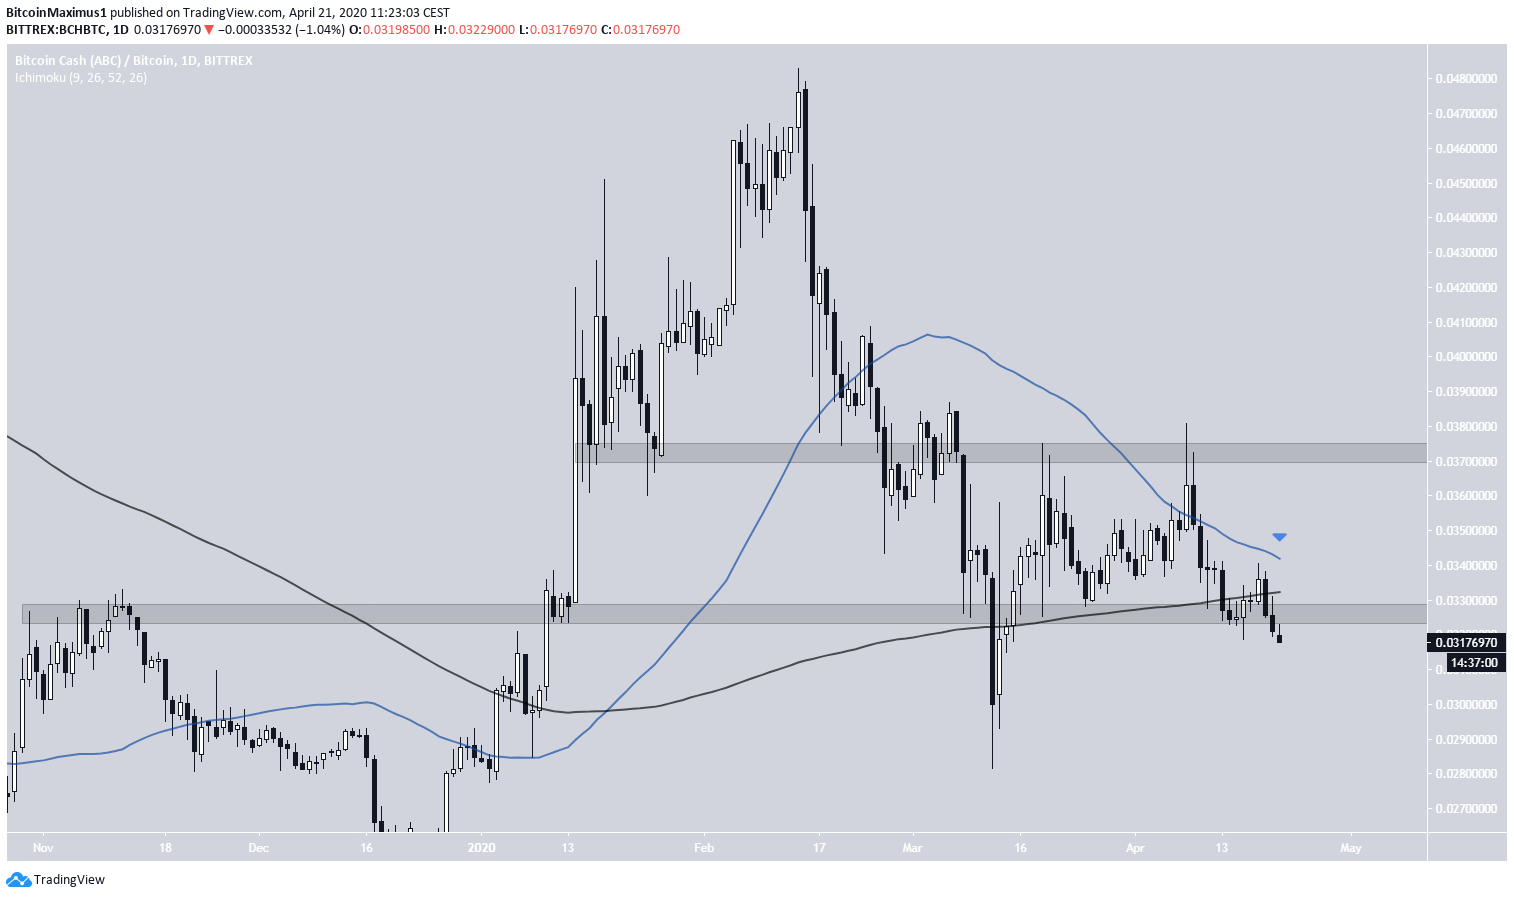
The BCH price had been trading between two important levels found at ₿0.0375 and ₿0.033 for the entirety of April. However, yesterday it decreased below the support area, even though it has yet to reach a definite close below it.
The price structure looks quite bearish. Besides the aforementioned support area, the price has also lost the support offered by the 200-day moving average (MA). In addition, a death cross is very close to transpiring — which would confirm that the BCH price is heading lower, possibly towards ₿0.03.
Bitcoin Cash SV (BSV)
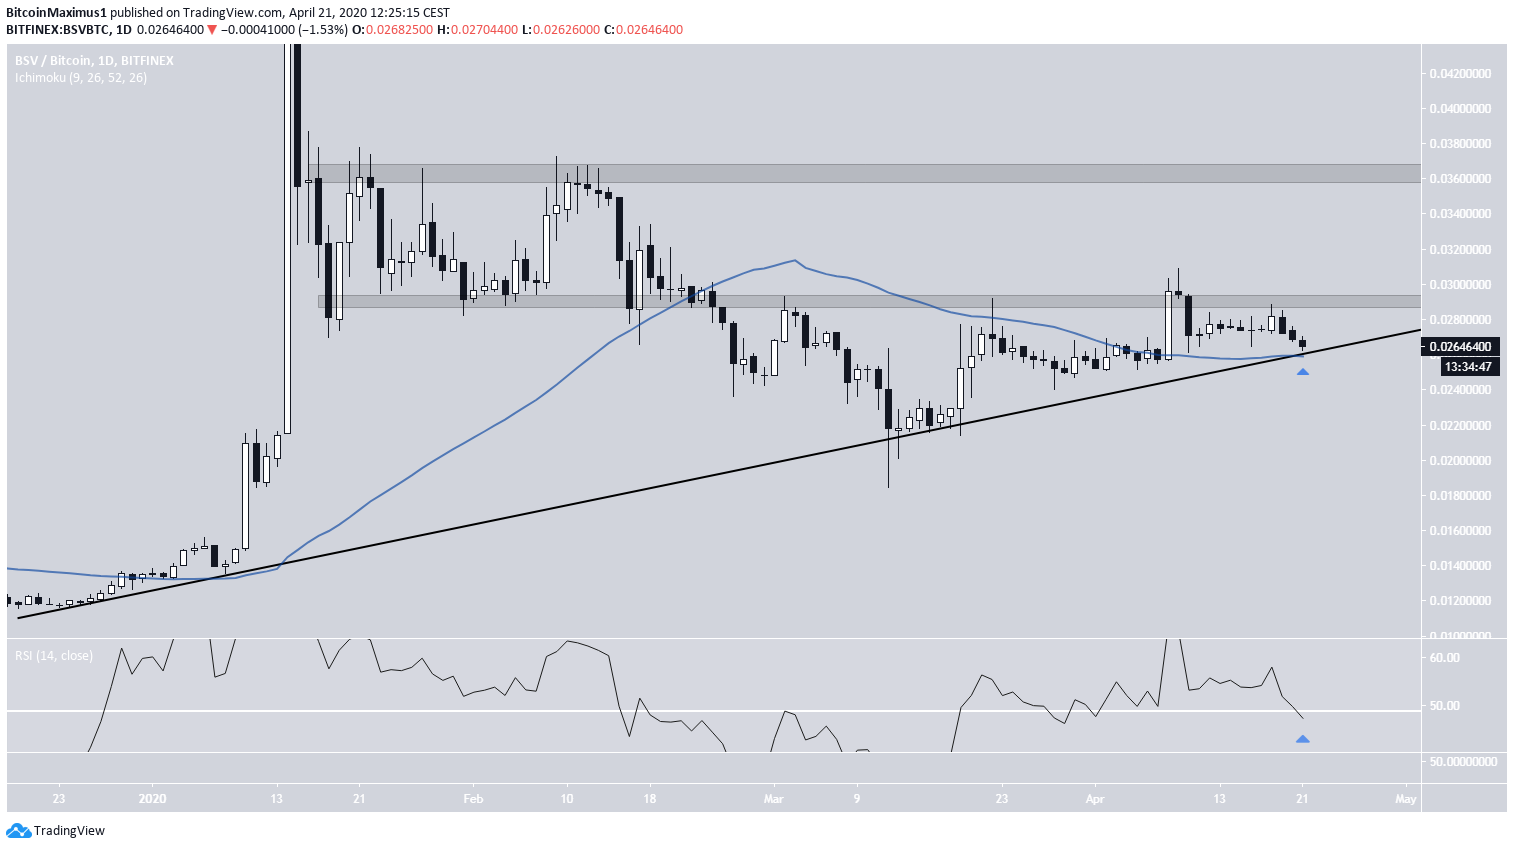
The BSV price has been gradually increasing at the rate predicted by an ascending support line since the beginning of the year. At the time of writing, the price was trading between this support line and the ₿0.0295 resistance area.
The price is not expected to decrease below this ascending support line for two reasons:
- First, the price has reached the 50-day MA which is providing support.
- Second, the RSI has reached the 50 line from above, making it an ample place for the trend to reverse.
If the BSV price breaks out above the current resistance area, it is likely to continue increasing until it reaches ₿0.036.
Litecoin (LTC)
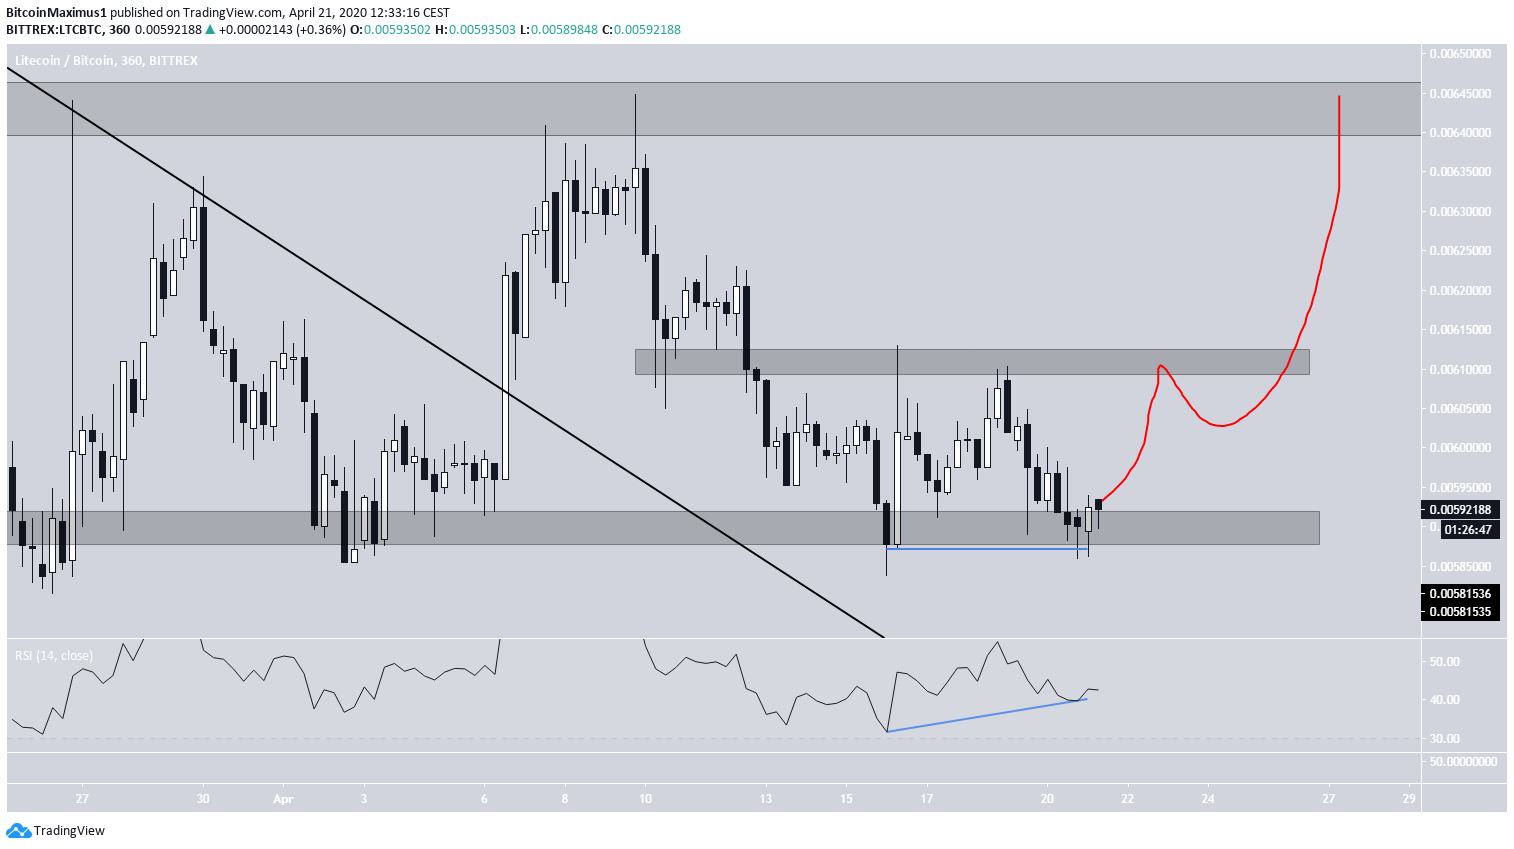
The Litecoin price broke out above a descending resistance line on April 6. The price reached a high of ₿0.00645 before decreasing considerably. On April 16, the price reached a low of ₿0.0059. It revisited the same level on April 19 — effectively creating a double bottom, which is considered a bullish reversal pattern. Furthermore, this pattern is combined with a bullish divergence in the RSI, which indicates that the price is likely to move upwards.
If it begins doing so, the first resistance area is found at ₿0.006. A breakout above this level would confirm the double bottom pattern and suggest that the price is likely to continue moving upwards, possibly towards the next resistance area at ₿0.00645.
Binance Coin (BNB)
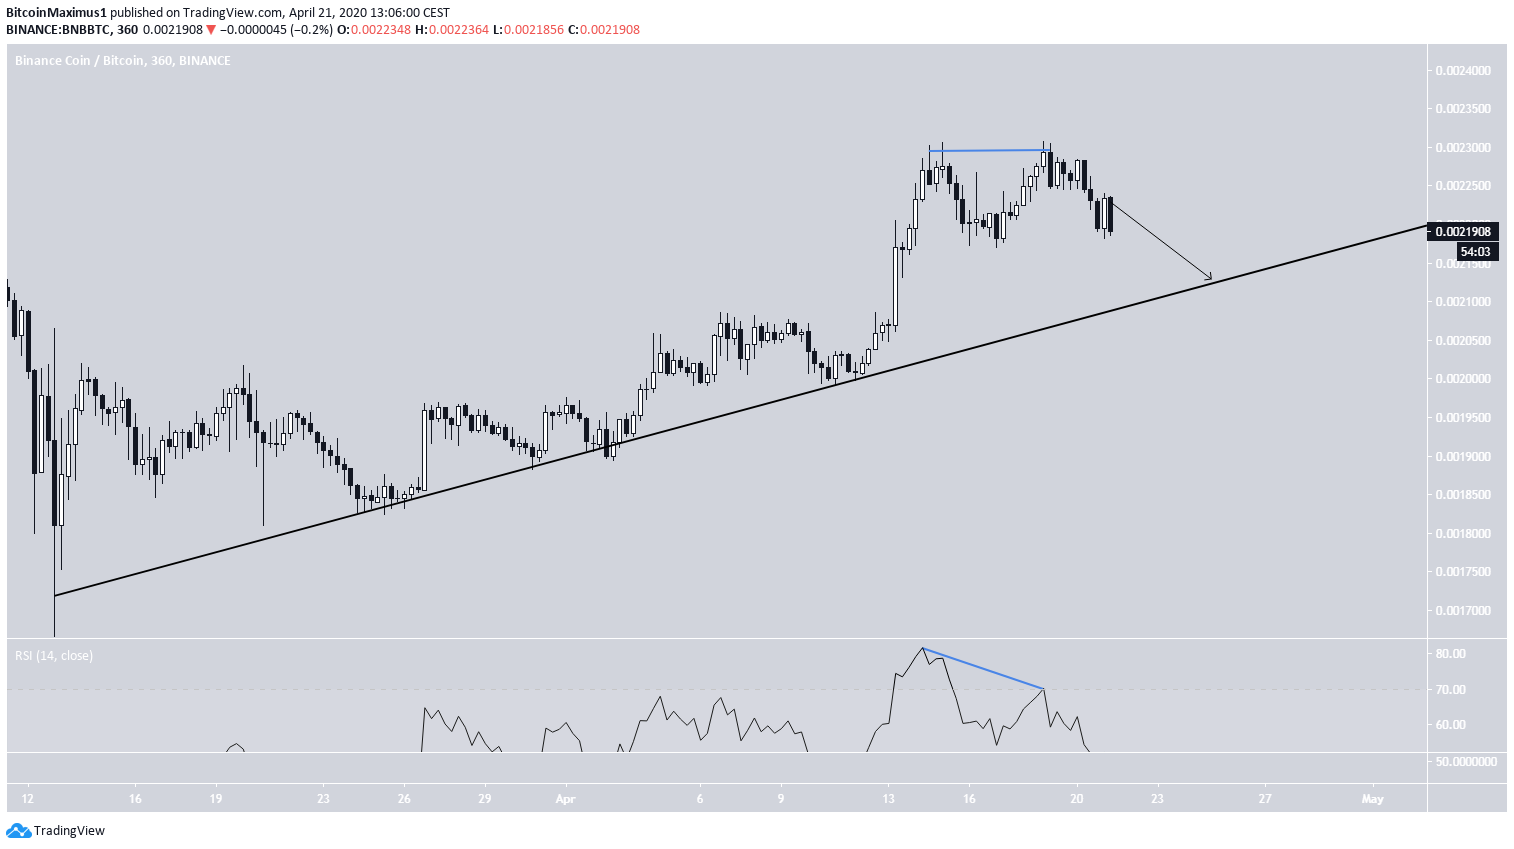
The Binance Coin price has been increasing gradually since March 13, following an ascending support line. The rate of increase accelerated on April 13 and the price increased considerably, reaching a high of ₿0.0023. It has not touched the support line since.
However, the BNB price has created a double top at the ₿0.0023 level, a pattern that is considered a bearish reversal one. In addition, this pattern is combined with a bearish divergence in the RSI. Therefore, the price is expected to move downwards and validate the ascending support line once more.
EOS (EOS)
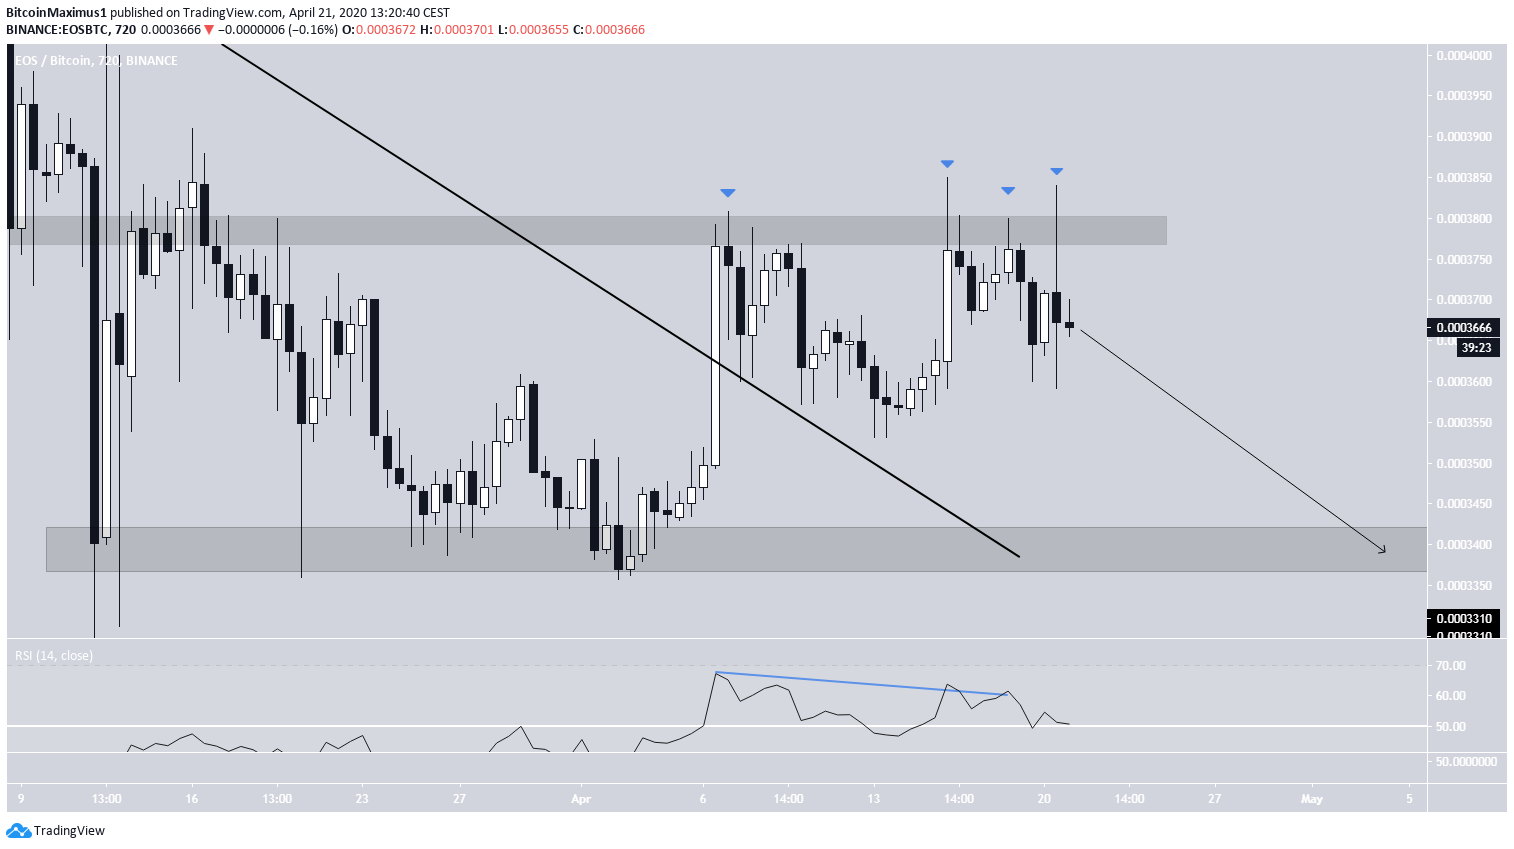
On April 6, the EOS price broke out from a long-term descending resistance line. After validating it as support, the price continued its upward movement.
However, the rally stalled at 3800 satoshis, an area inside which the price has created a double/triple top. In addition, it has created several long upper wicks — a sign of selling pressure.
Finally, this bearish reversal pattern is combined with a bearish divergence in the RSI, suggesting that the price will decrease. If it does so, the closest support area is found at 3400 satoshis.
Tezos (XTZ)
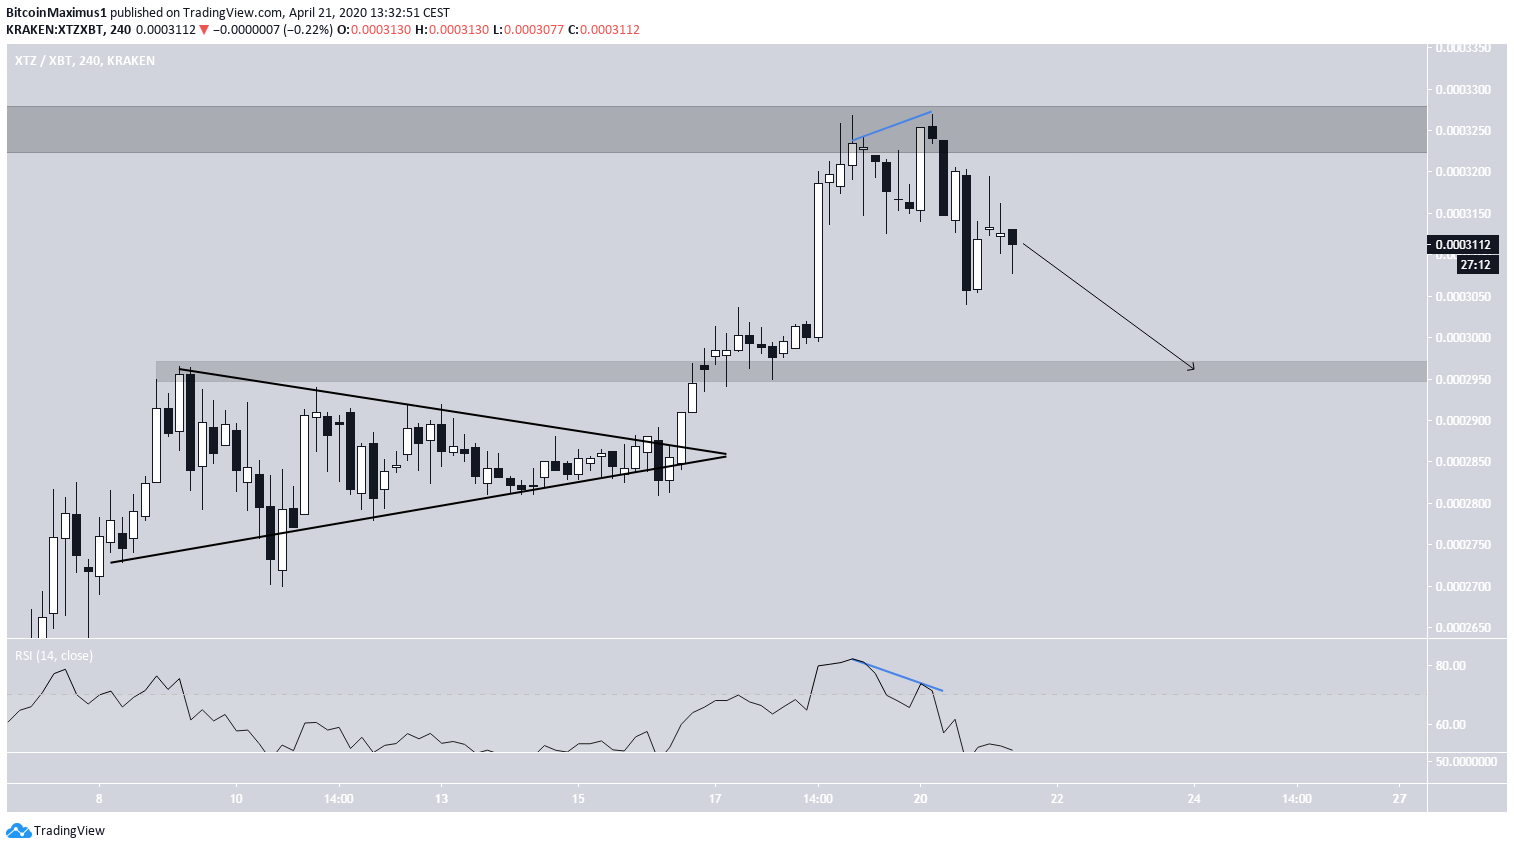
The XTZ price had been trading inside a symmetrical triangle in the period from April 8 to April 13. After breaking out, the price continued to increase until it reached the 32,500 satoshi area, where it found resistance.
Inside it, the Tezos price created a double top, which is considered a bearish reversal pattern. The pattern was also combined with a bearish divergence in the RSI. The price has been decreasing since and is expected to continue decreasing until it reaches the 29,500 satoshi support area.
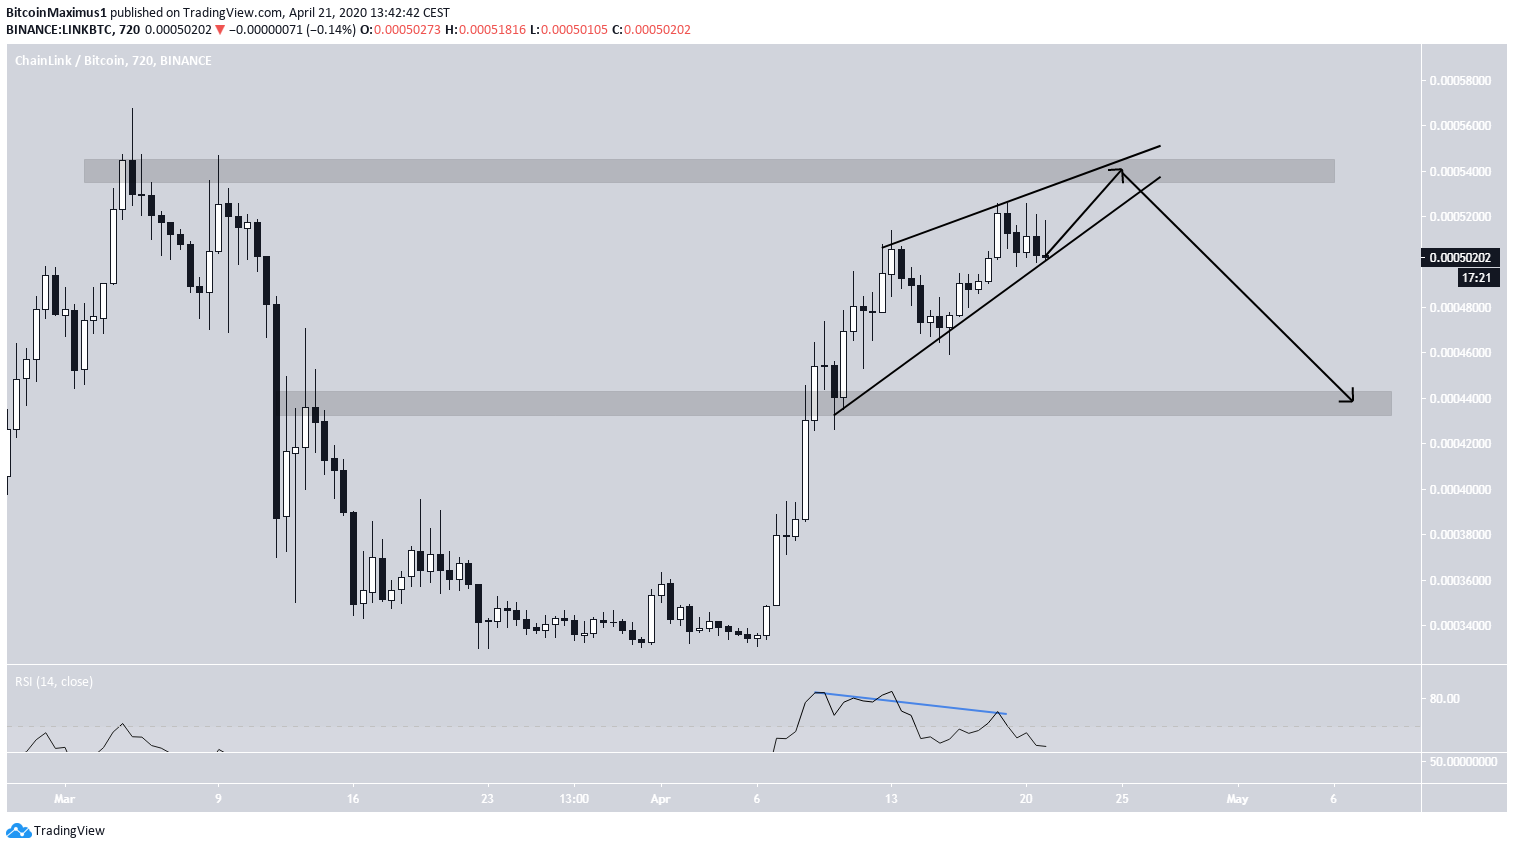
ChainLink (LINK)
The LINK price began a rapid upward move on April 7 and has been increasing since. After flipping the 34,000 satoshi area as support, the price continued its increase in the form of an ascending wedge, which is considered a bearish reversal pattern. The resistance line of the wedge has only been validated twice, allowing for the possibility of a slightly different slope being followed.
The closest resistance level is found at 54,000 satoshis. Therefore, it would make sense for the price to create a high inside it before breaking down. This possibility is also supported by the bearish divergence that has developed in the RSI.
If the price breaks down, it is likely to reach the support area at 44,000 satoshis.