


In the early hours of April 16, the BTC price reached a low of $6,461. However, it immediately reversed its trend and has reached a high of $7,147 within the same day.
This increase could have been caused by the printing of $120 million Tether (USDT), which occurred slightly prior to the price beginning its rapid upward movement. In addition, indicators are looking normal again, as evidenced by the return of the realized volatility to its previous levels. Without further ado, let’s take a look at some Bitcoin and altcoin charts to try and figure out where the markets will be moving.
Bitcoin (BTC)
The Bitcoin price is in the process of creating a bullish engulfing candlestick in the six-hour time-frame. However, it has already begun to decrease prior to reaching a close and has created a long upper wick.
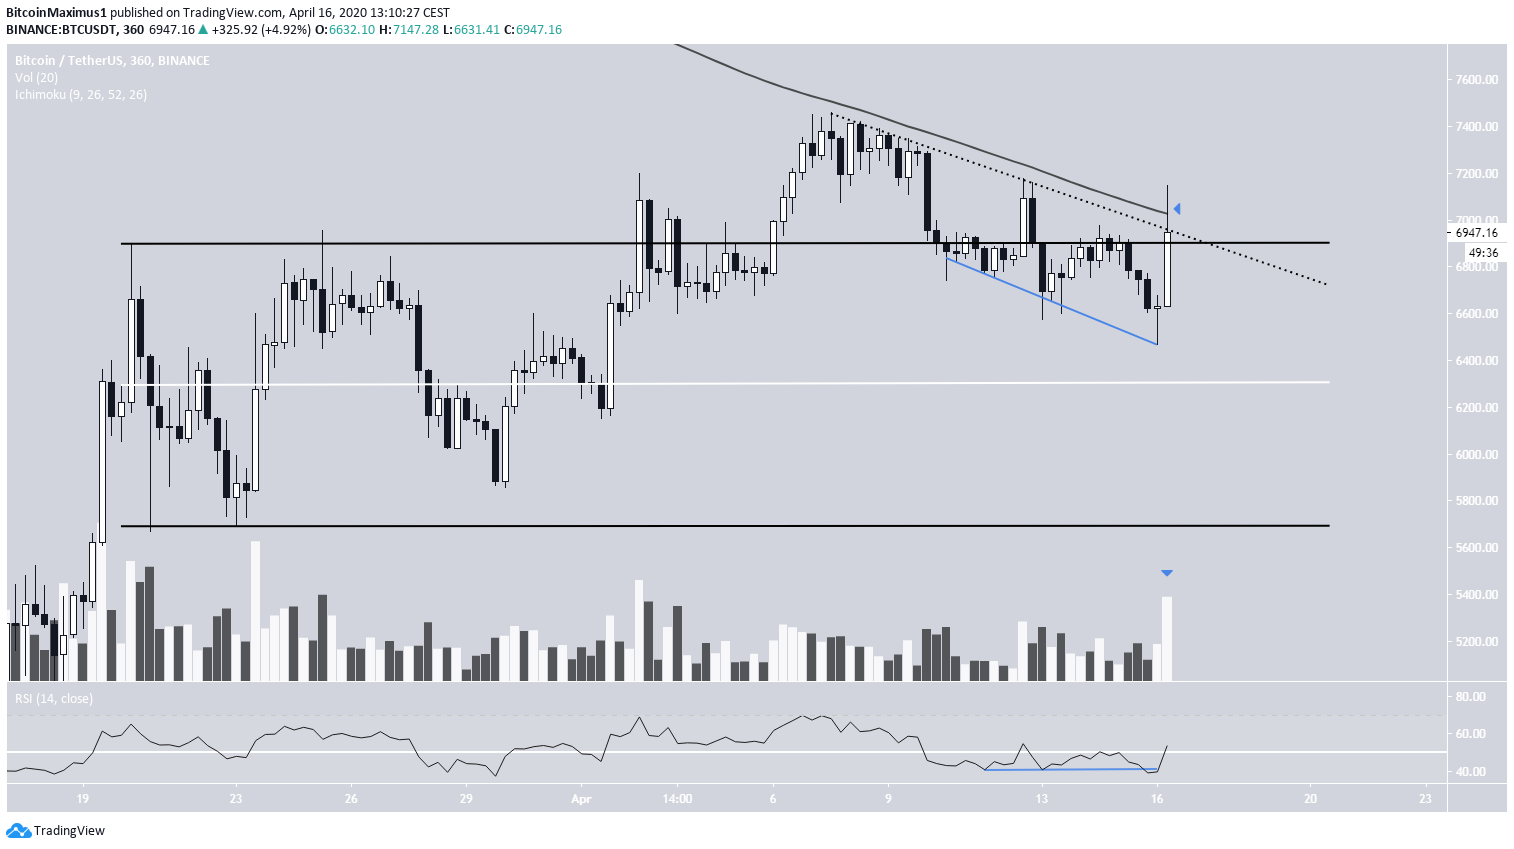
The Bitcoin chart still looks bearish. The price is sitting at a confluence of resistance levels.
First, there is the descending resistance line in place since April 6. While in lower time-frames the price has already broken out above this resistance, it is still intact in higher ones, since the breakout only took the form of a wick.
Second, there is the horizontal resistance line of the trading range between $5,700-$6,900. The price has yet to reach a close above this area.
Finally, there is the 25-day moving average (MA), which has been offering very close resistance to the price.
While there is some bullish divergence developing in the RSI, and volume has been significant, these are not enough to offset the dominating bearish characteristics.
Outlook
The BTC price is expected to decrease towards the midpoint of the range at $6,300.
Ethereum (ETH)
On April 16, the Ethereum price broke out from a descending resistance line that had been in place for two months. It has been increasing ever since, with the current daily candlestick shaping up to be a bullish engulfing one.
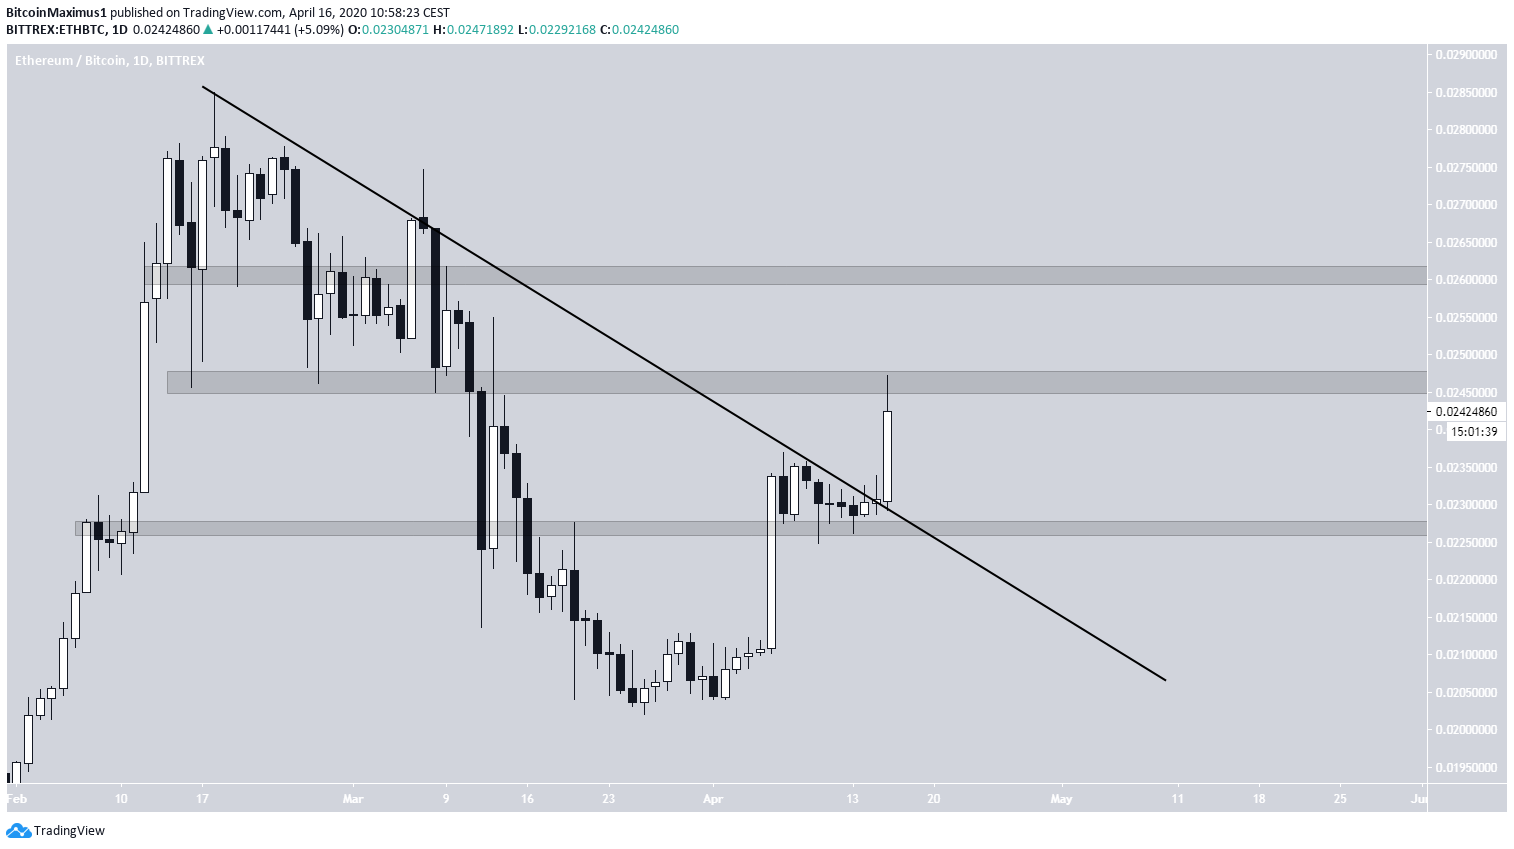
A breakout from such a long-term trend-line often means that a bullish trend has begun.
Currently, there are two resistance areas right above the price, found at ₿0.0245 and ₿0.028. The price has reached the first area and decreased slightly.
The most likely movement from the current level would be a decrease towards the support level of ₿0.0225, which would initiate a period of consolidation between ₿0.0225-₿0.0245, until the price eventually breaks out and heads higher.
Outlook
The price could decrease towards the ₿0.0225 support and then gradually increase towards resistance.
XRP (XRP)
The XRP price has been following a descending resistance line since Feb. 18, having validated it four times until now. The price movement is quite unusual due to the lack of a support line. While there is a support area found at 2,550 satoshis, the price has broken down below it multiple times, only to reclaim it shortly afterwards.
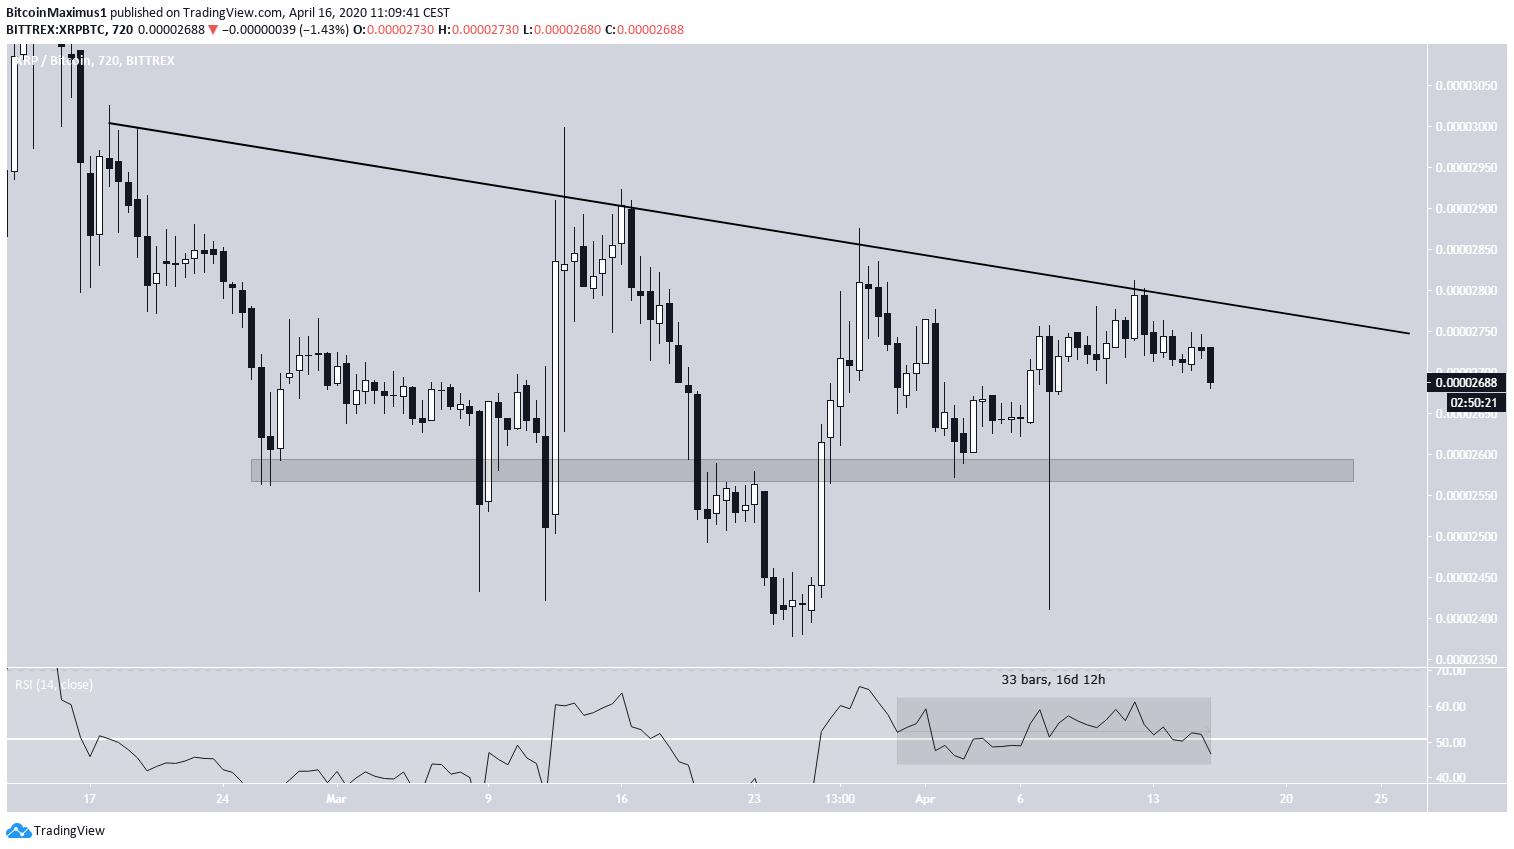
The current indecision in the direction of the movement is also seen in the RSI, which has been freely moving above and below the 50 line, a sign that there is no dominant trend rather than the price is consolidating.
Outlook
Until the price breaks out/down from the resistance/support levels outlined, we are maintaining a neutral outlook for XRP.
Bitcoin Cash (BCH)
The BCH price is trading inside a very important support area that is found at ₿0.033, being very close to its 200-day moving average (MA). While the price briefly decreased below this support level yesterday, it has rallied quickly to reclaim it since.
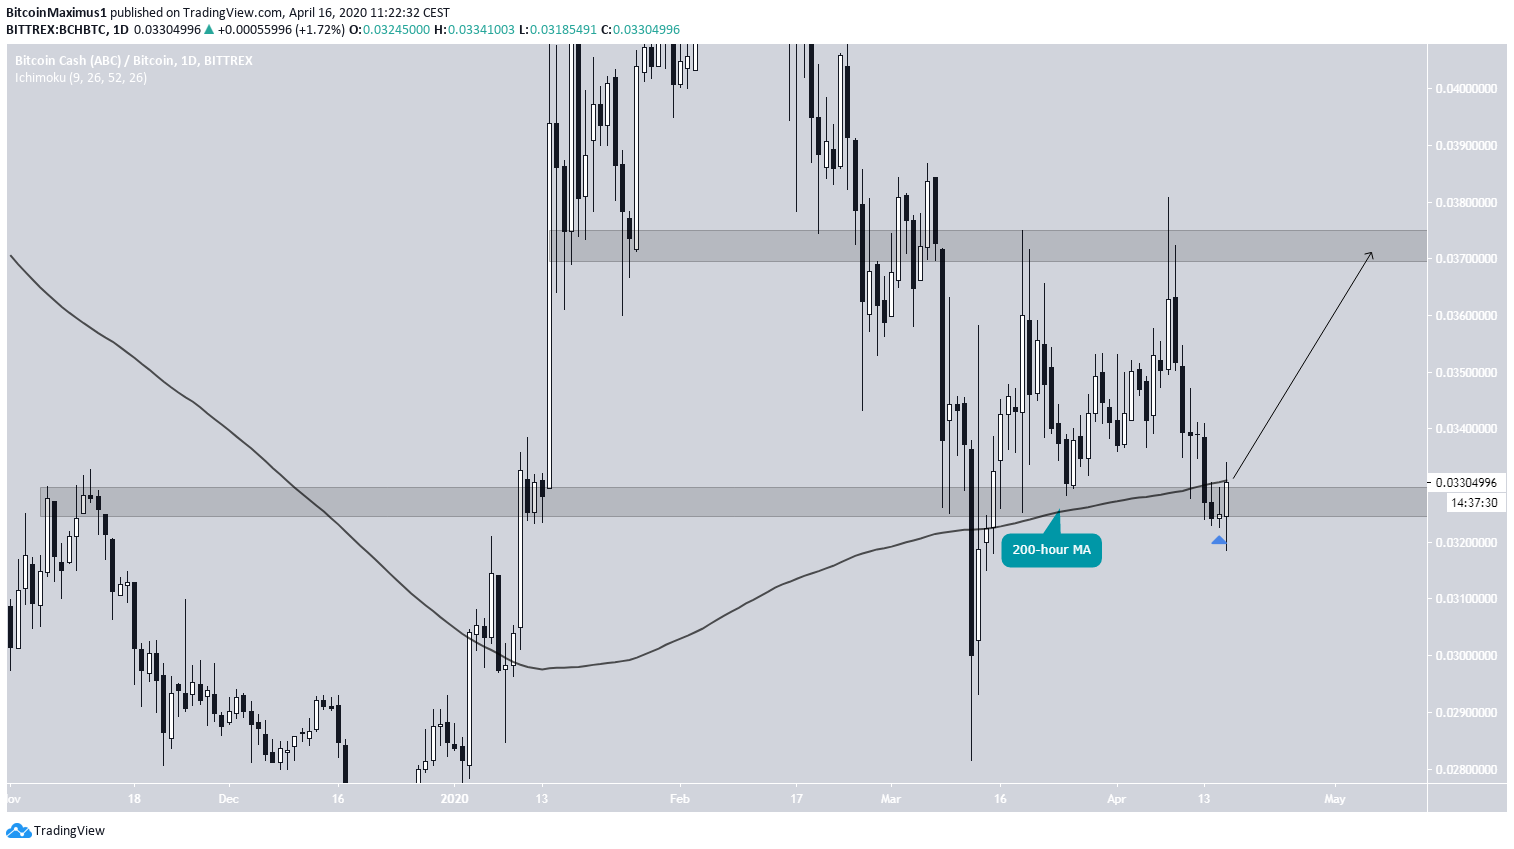
As long as the BCH price stays above this ₿0.033 level, its price movement can be considered bullish. A reclaim of the 200-day MA would likely accelerate the upward movement and cause the price to reach the next resistance level, which is found at ₿0.0375.
Outlook
The BCH price is expected to move towards the closest resistance area at ₿0.0375.
Bitcoin Cash SV (BSV)
The BSV price has been following an ascending support line since the beginning of the year. On March 19, the price broke out above its descending resistance line and has been gradually increasing at the slope predicted by the support line since.
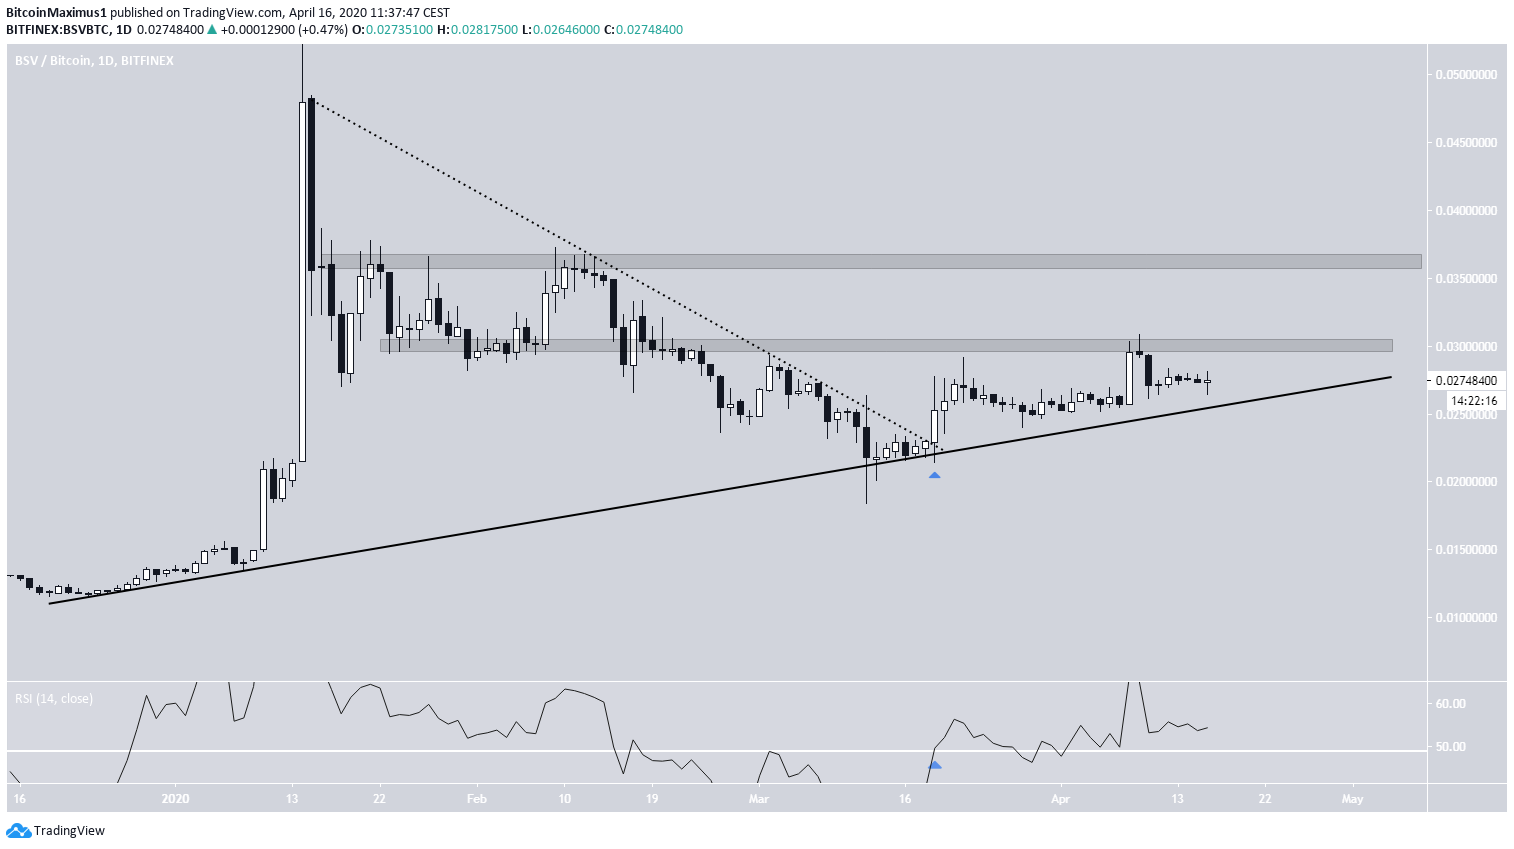
At the time of writing, the BSV price was trading inside the ₿0.03 resistance area. Even though it’s trading inside resistance, its outlook remains bullish. The daily RSI moved above 50 on March 19, the day of the breakout, and has stayed above since, a bullish sign.
Also, the ascending support line is very close to the current price, allowing for the possibility of cutting losses in case the price breaks down. A breakout above the current resistance would likely take the price towards ₿0.036.
Outlook
The price is expected to gradually increase until it breaks out above ₿0.03. The rate of increase is likely to accelerate afterward.
Litecoin (LTC)
On April 6, the Litecoin price broke out from a descending wedge that had been in place since March 11. It reached a high inside the ₿0.00645 resistance area three days later and has been decreasing since.
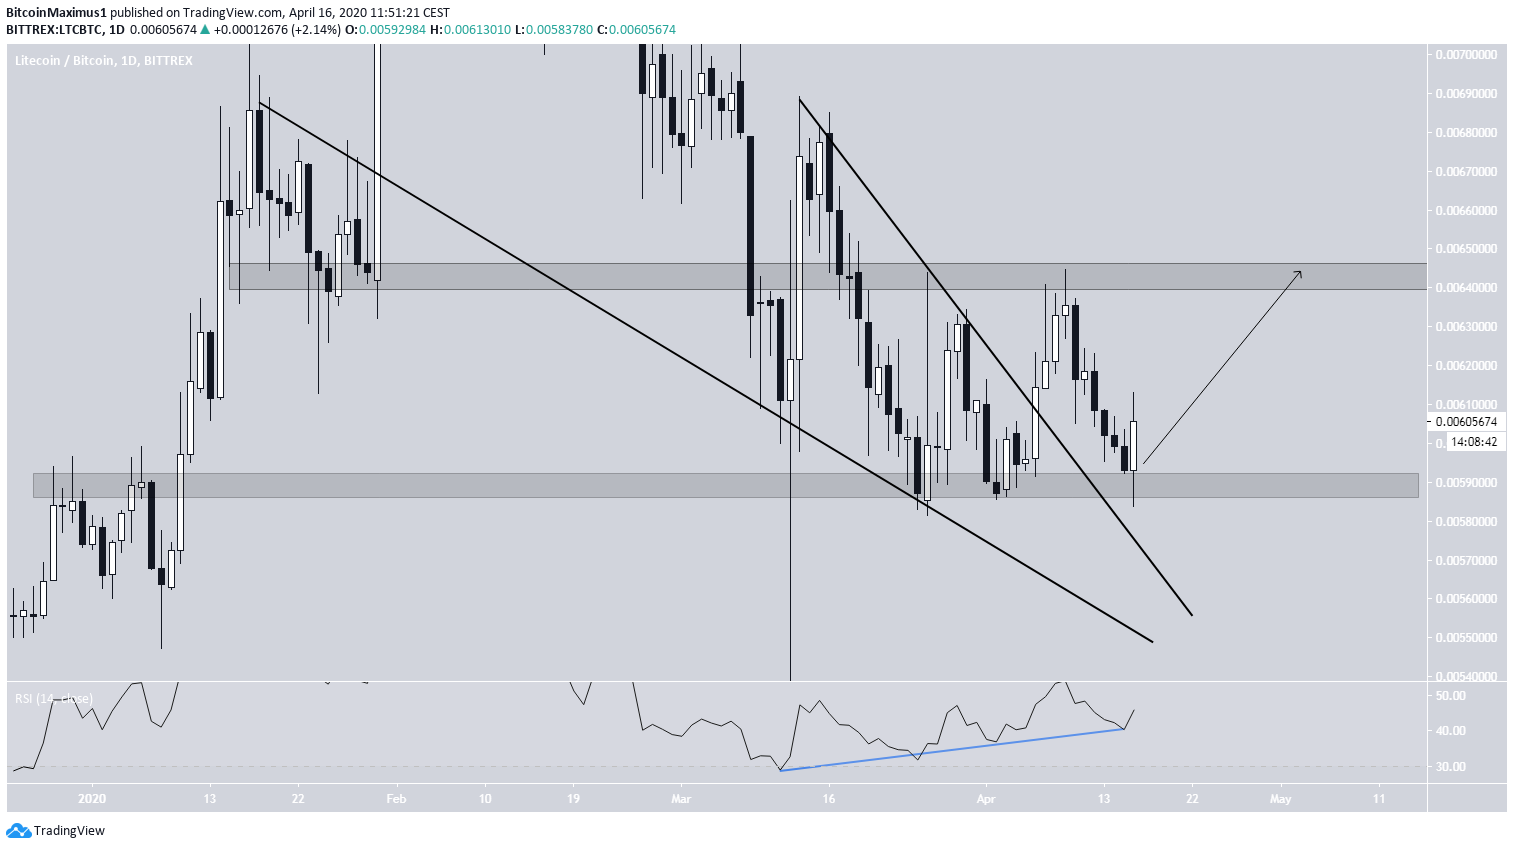
On April 16, the LTC price reached the support area at ₿0.0059. From this level, the LTC price is expected to increase towards the resistance area once more. This possibility is strengthened by the ongoing bullish divergence in the daily RSI, which has created four higher lows until now.
The bullish outlook would be invalidated by a decisive close below the current support level, which seems unlikely.
Outlook
The LTC Price is expected to increase towards the resistance area at ₿0.00645.
Binance Coin (BNB)
On April 6, the BNB price broke out from a descending resistance line that had been in place since Feb. 11. It followed this with another breakout on April 13, this time from the 200-day MA.
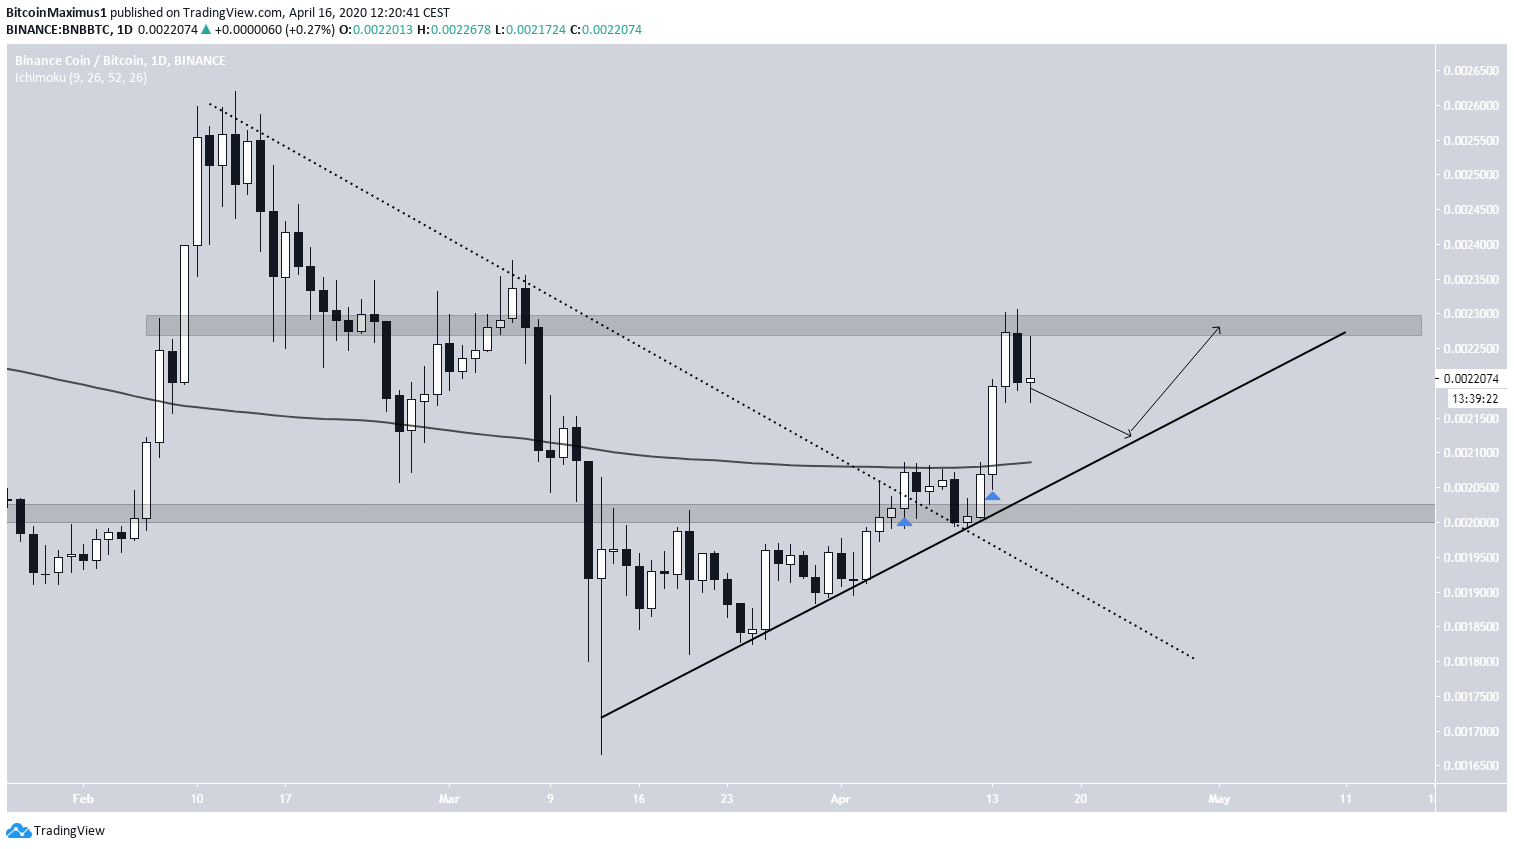
Prior to the breakout, the BNB price reached a low on March 13. Since then, it has been following a steep ascending support line, which it has not validated since the breakout above the MA. At the time of writing, the price was rejected by the ₿0.0023 resistance area and has begun its descent towards the ascending support line. As long as the support line holds, the BNB outlook is considered bullish.
Outlook
The BNB price is expected to drop and validate the ascending support line once more. Afterward, a move towards the resistance area of ₿0.0023 is anticipated.
EOS (EOS)
On April 6, the EOS price broke out from a descending resistance line that had been in place since Feb. 18. The price has been gradually increasing since, most notably on April 16.
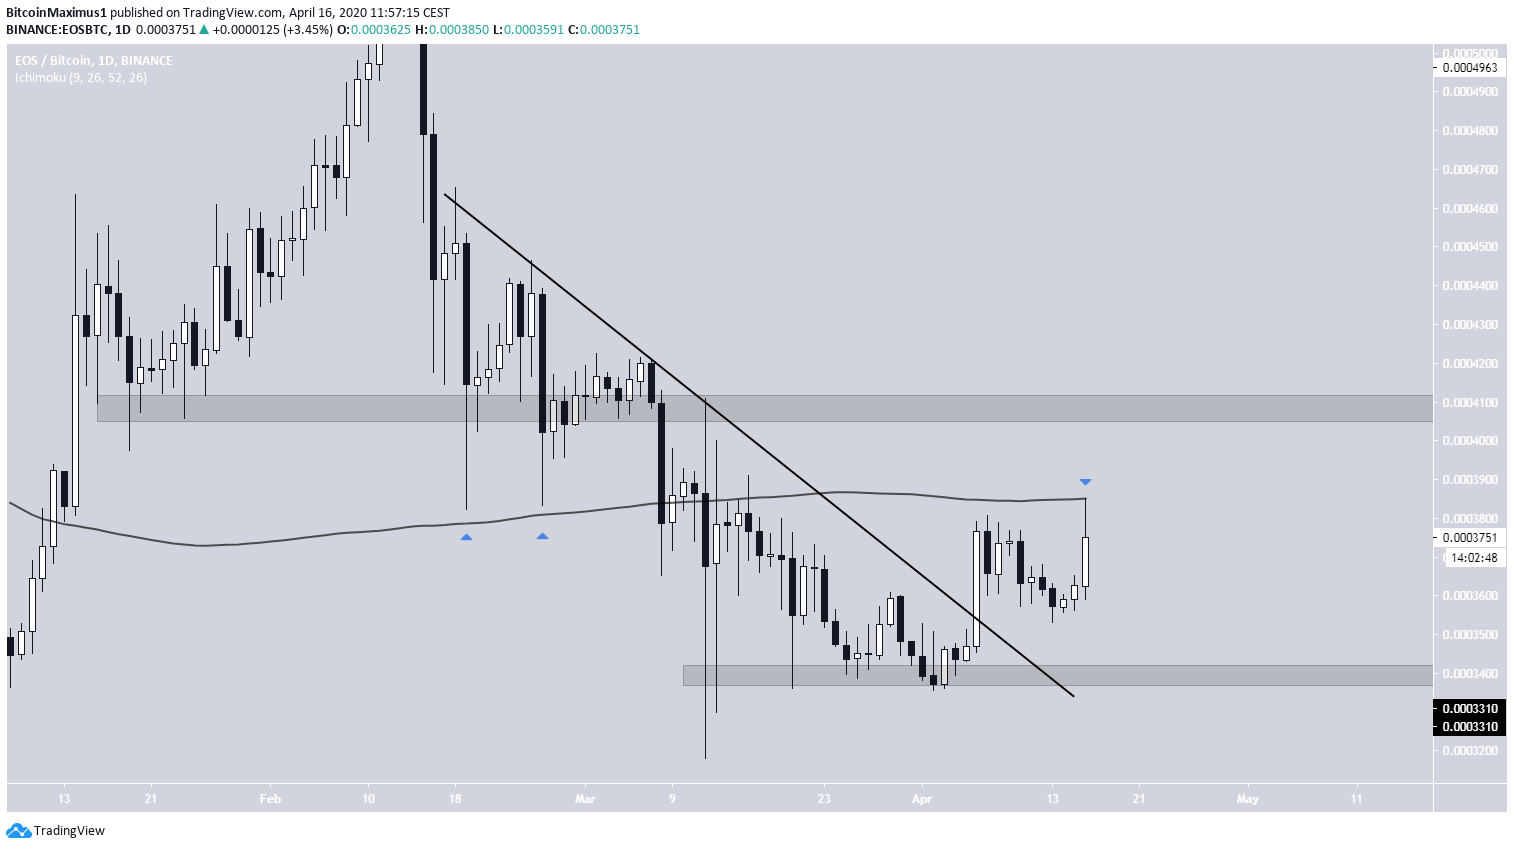
The closest support and resistance areas are found at 3,400 and 4,100 satoshis, respectively. In addition, the price is facing resistance from its 200-day MA. This makes it likely that the price will decrease towards the 3,400-satoshi support area once more, before eventually beginning another upward move towards resistance. This view is supported by the bearish divergence in lower time-frames, which, however, have yet to be confirmed.
A flip of the 200-day MA would likely accelerate the rate of increase.
Outlook
The price is expected to drop towards the support area of 3,400 satoshis. Afterward, an upward move towards the resistance area seems likely.
Tezos (XTZ)
On April 7, the XTZ price began an upward move. It broke out above the main resistance area at 0.0002750 shortly afterward and validated it as support. The price has created a symmetrical triangle.
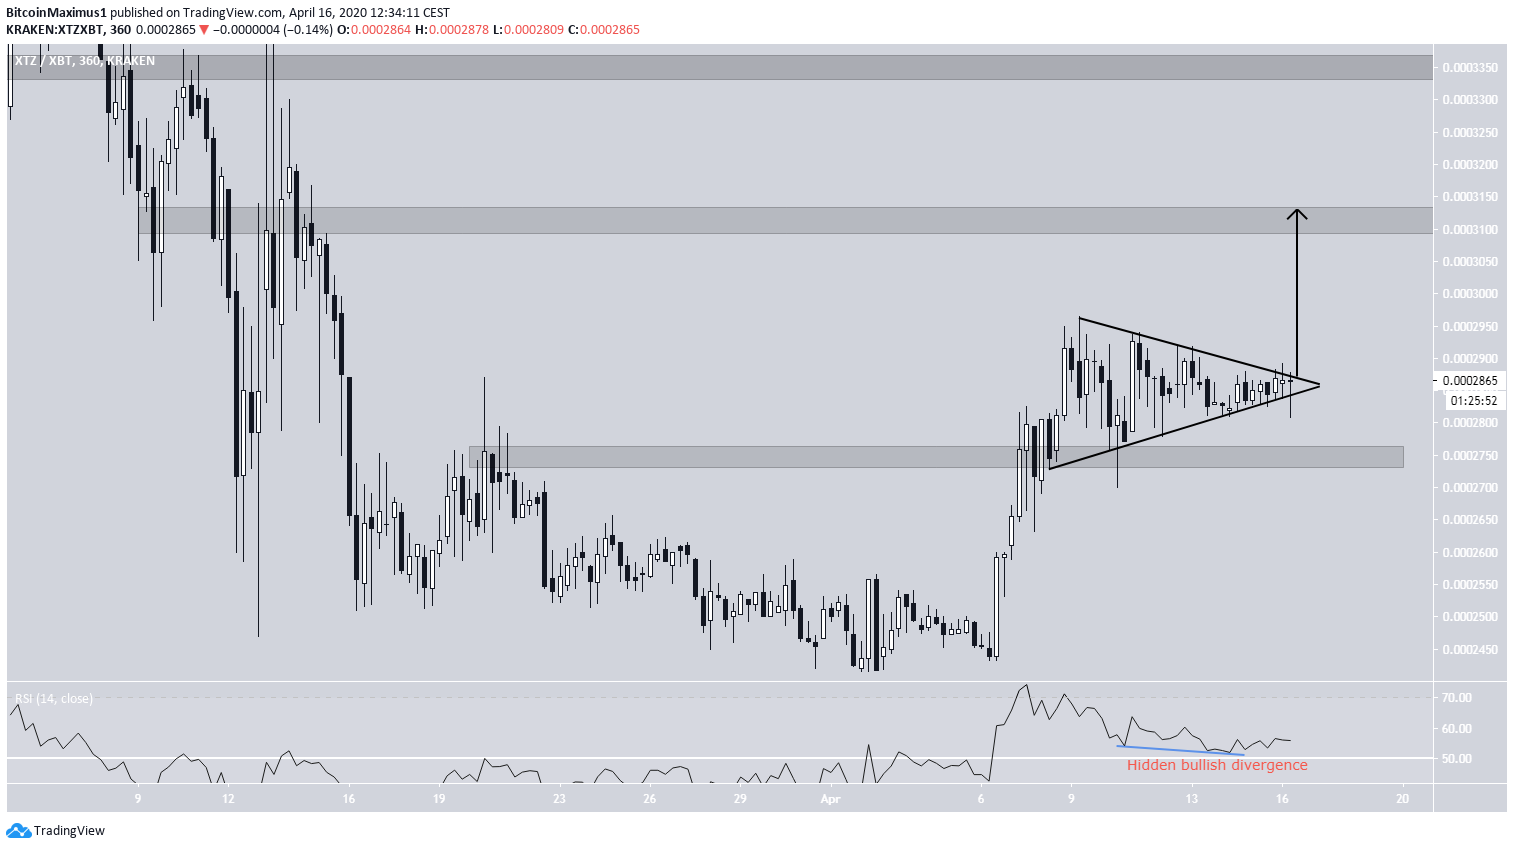
The symmetrical triangle is considered a neutral pattern, meaning that it often acts as a continuation pattern. Since the pattern is coming after an upward move, a breakout is expected. This is also supported by the developing hidden bullish divergence in the RSI.
If a breakout transpires, the closest resistance areas are found at ₿0.0003120 and ₿0.000335, respectively.
Outlook
The XTZ price is expected to break out from the symmetrical triangle and move towards the resistance areas outlined above.
ChainLink (LINK)
On April 7, the LINK price broke out from a descending wedge. The price continued to increase until April 13, when it reached a high of 51,379 satoshis.
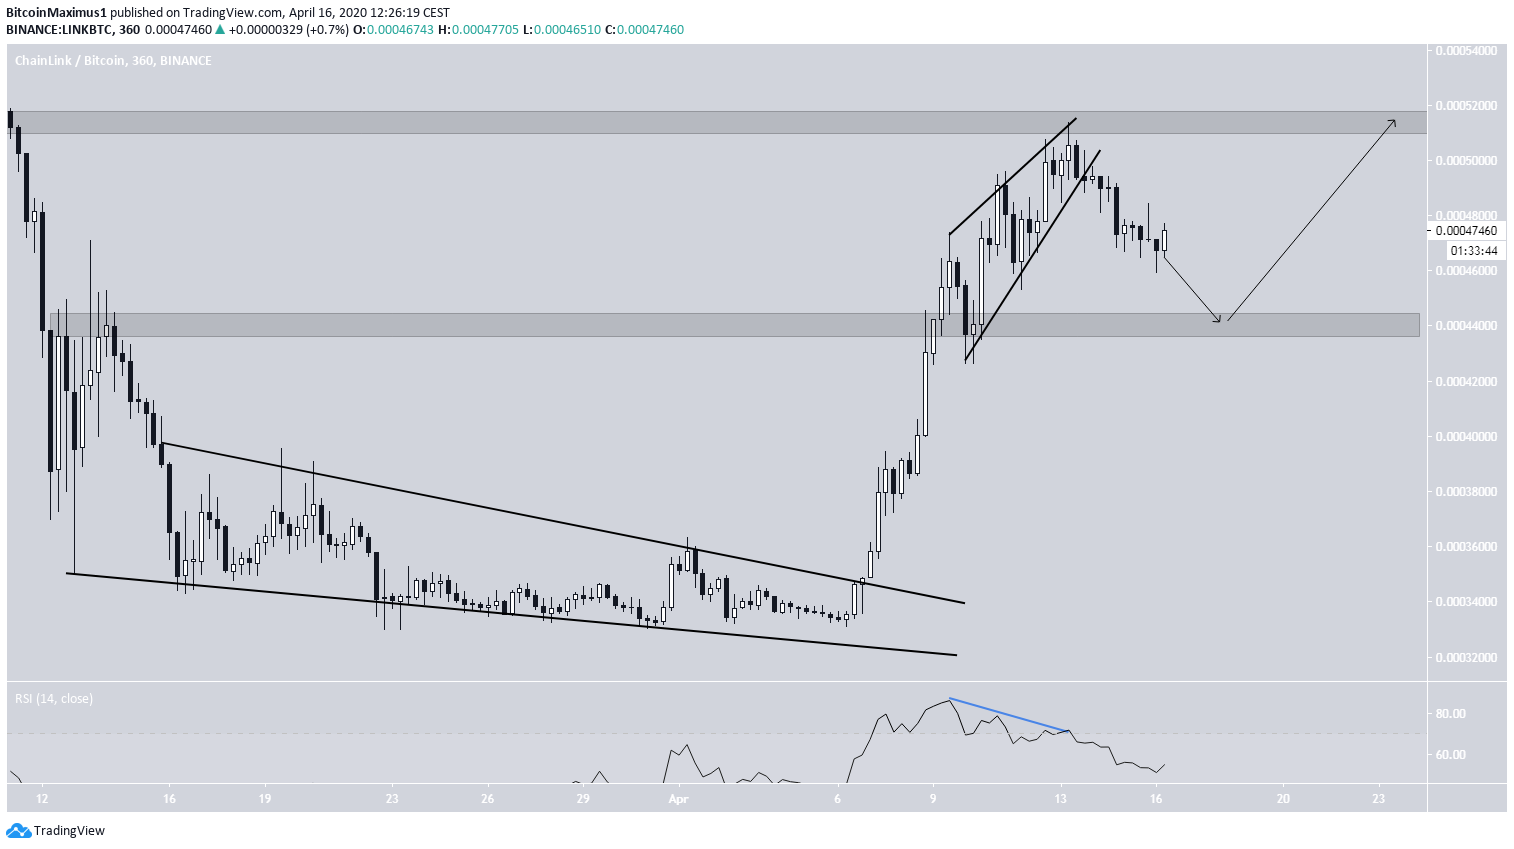
The decrease from the April 13 high was preceded by two bearish characteristics:
- An ascending wedge, which is known as a bearish reversal pattern.
- Bearish divergence in the RSI, which often precedes trend reversals.
The closest support area is found at 44,000 satoshis. Since the decrease ensuing from the breakdown has yet to reverse, it would make sense for the price to fall to this level and attempt to find support.
Outlook
The price is expected to find support at 44,000 satoshis and begin an upward move towards the resistance at 52,000 satoshis.


