


The Cosmos (ATOM) price began an upward movement after generating bullish divergence. An increase above $10.6 would go a long way in indicating that the trend is still bullish.
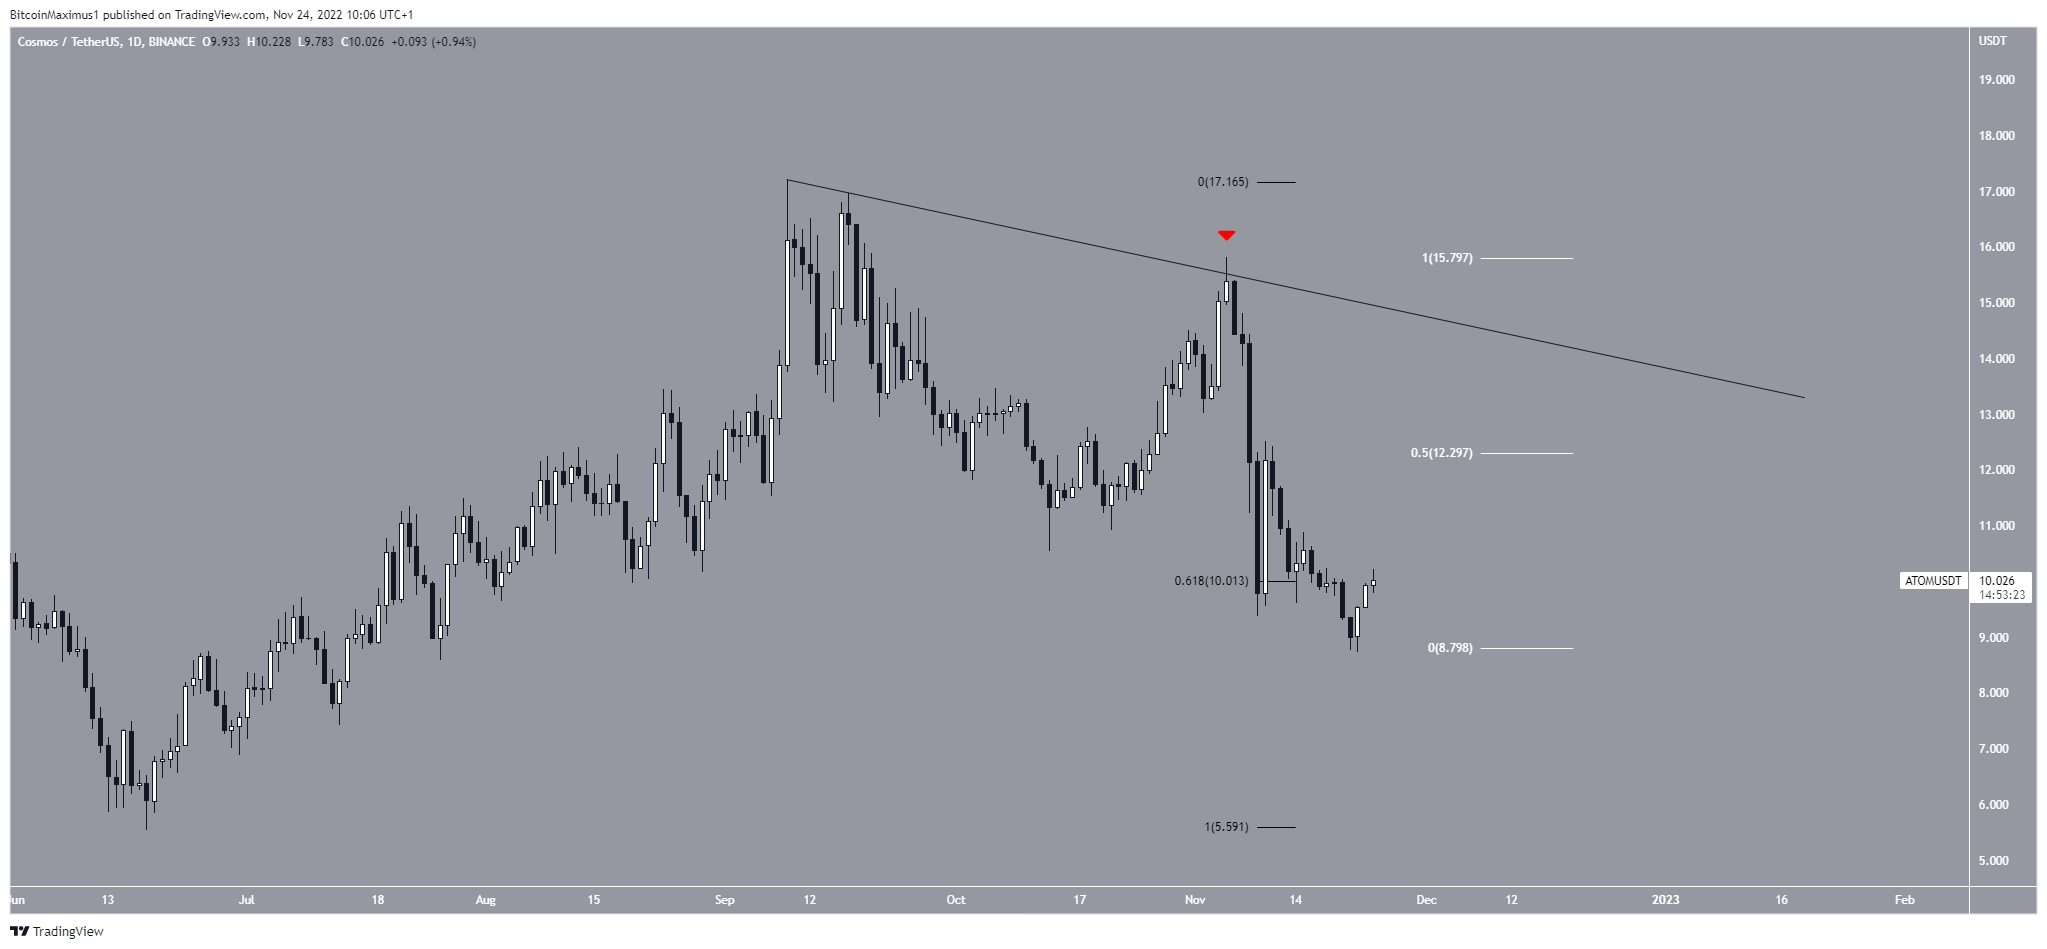
The ATOM price has fallen below a short-term descending resistance line since reaching a high of $17.2 on Sept. 9. More recently, the line caused a rejection on Nov. 5, accelerating the downward movement. A similar decrease was seen throughout the crypto market.
The Cosmos price reached a low of $8.80 on Nov. 24 before bouncing. Currently, it is attempting to reclaim the 0.618 Fib retracement level at $10. Its reclaim would make the Cosmos price forecast bullish, since the preceding breakdown would be considered a deviation.
In that case, the next resistance areas would be at $12.30 and $14.30, created by the 0.5 Fib retracement resistance (white) and the resistance line, respectively.
Cosmos Price: Will Bullish Divergence Lead to Rally?
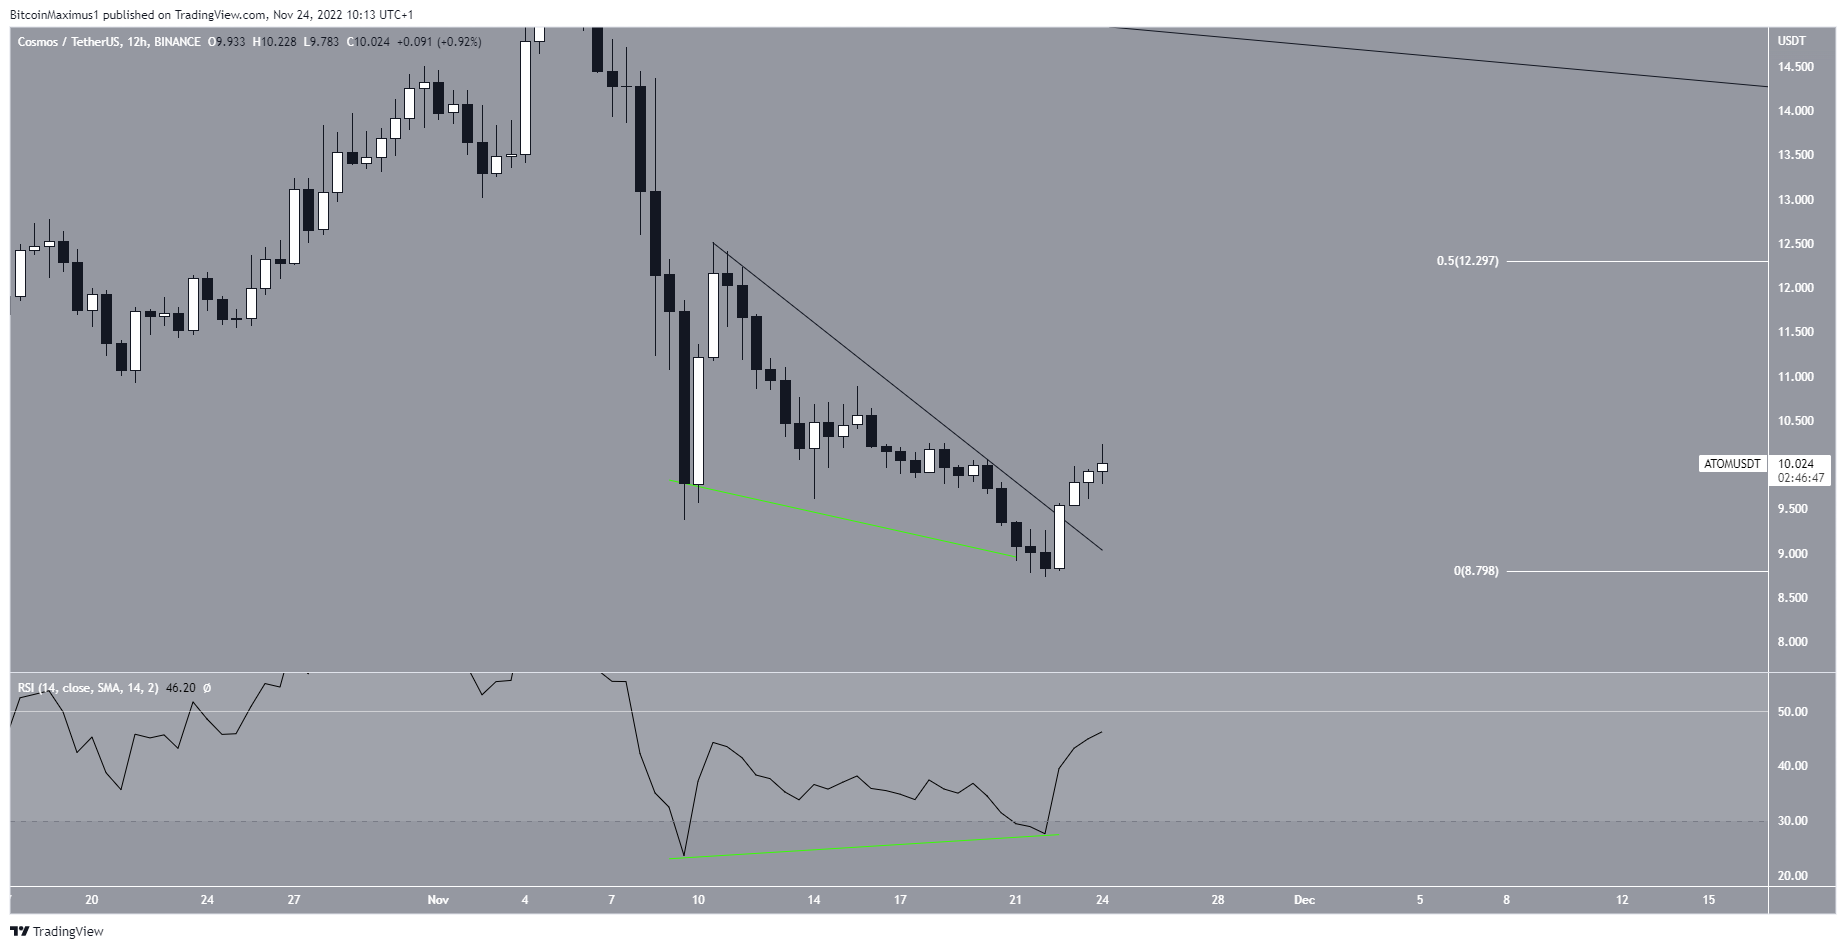
A closer look at indicators from the 12-hour technical analysis supports the continuation of the upward movement. The main reason for this is the bullish divergence in the daily RSI (green line). Such divergences often precede upward movement.
An RSI increase above 50 would go a long way in suggesting the upward movement has started.
Moreover, the ATOM price has broken out from a descending resistance line during the past 24 hours, further supporting the hypothesis of an upward movement.
Wave Count Support Increase
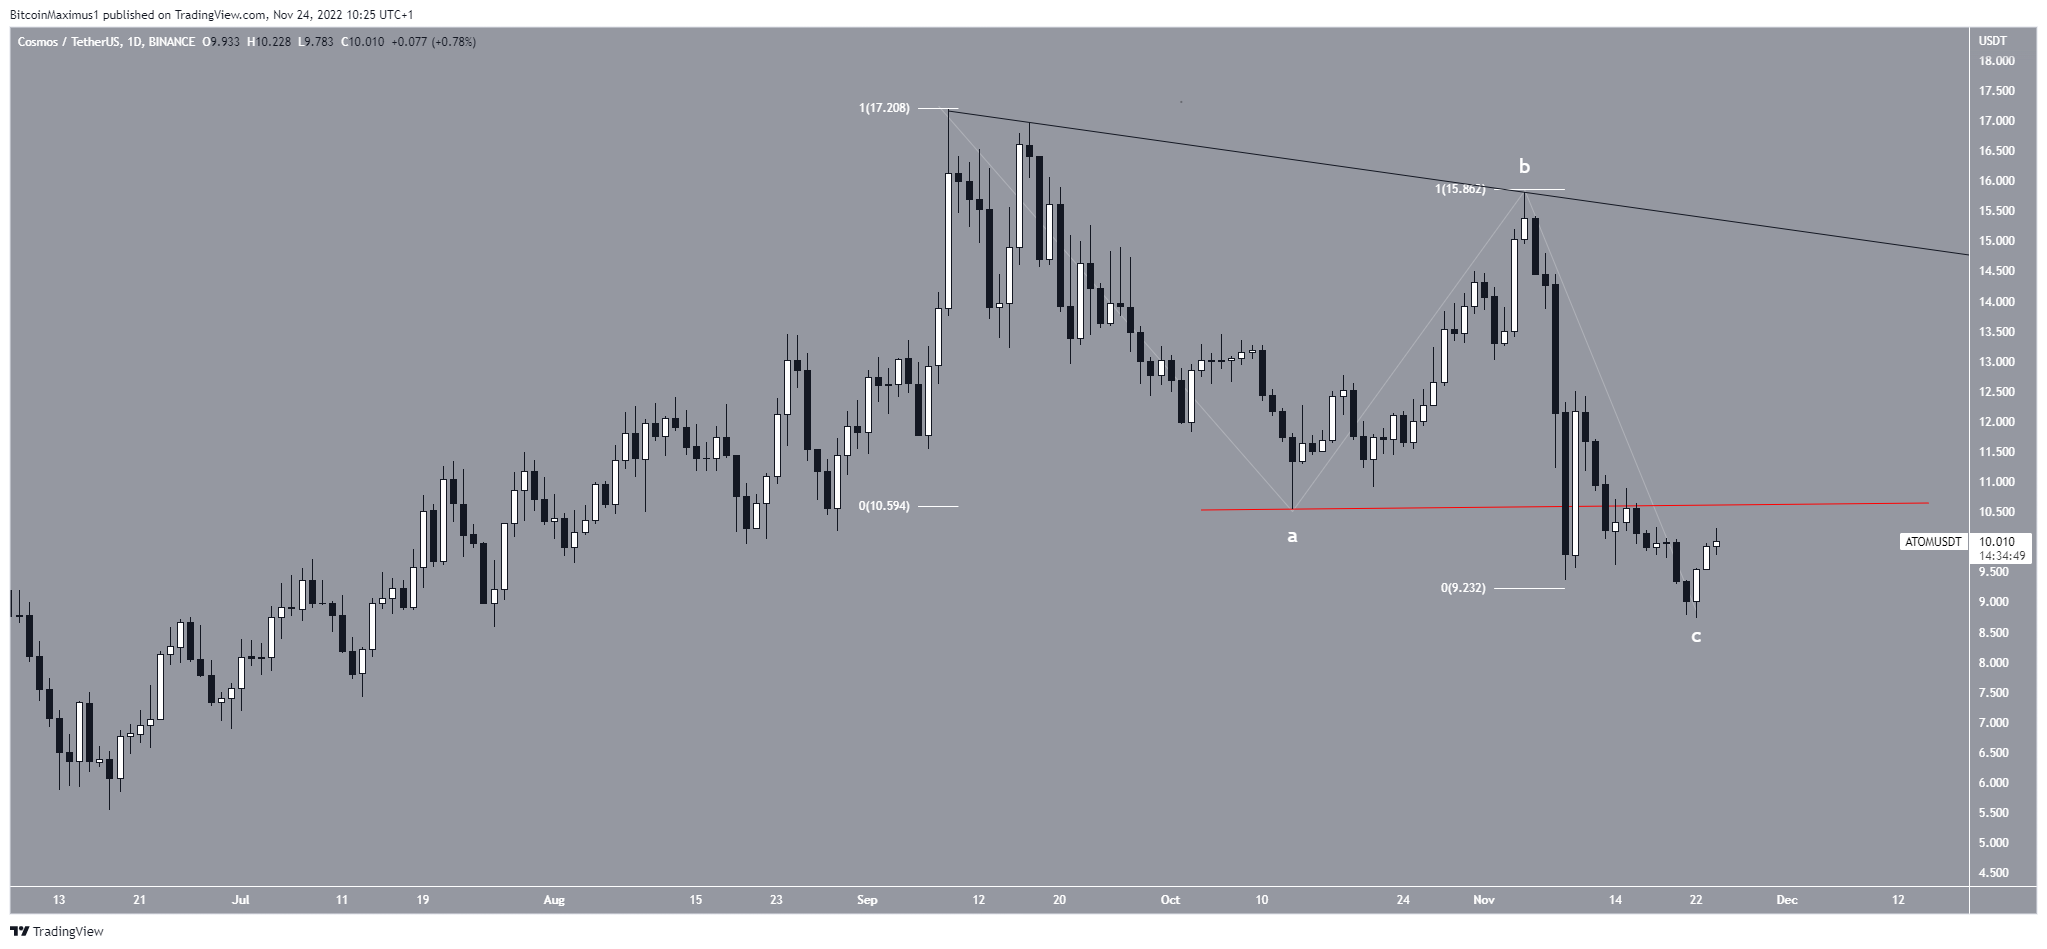
Finally, the wave count is also leaning bullish. The decrease since Sept. 7 resembles an A-B-C corrective pattern, in which waves A:C have a 1:1 ratio (white). An increase above the wave A low (red line) of $10.6 would confirm this count. In this case, an eventual breakout from the long-term resistance line would be likely.
Conversely, a drop below the wave C low of $8.7 would invalidate this particular count.
For BeInCrypto’s latest crypto market analysis, click here.
Disclaimer: BeInCrypto strives to provide accurate and up-to-date news and information, but it will not be responsible for any missing facts or inaccurate information. You comply and understand that you should use any of this information at your own risk. Cryptocurrencies are highly volatile financial assets, so research and make your own financial decisions.


