


In this article, we will take a look at the price movement for Ethereum (ETH) in the 2015-2018 bullish cycle and compare it to the current one.
While both upward movements have continued for a similar amount of time, the 2020 movement had a much smaller magnitude than the movement preceding it.
First bullish cycle
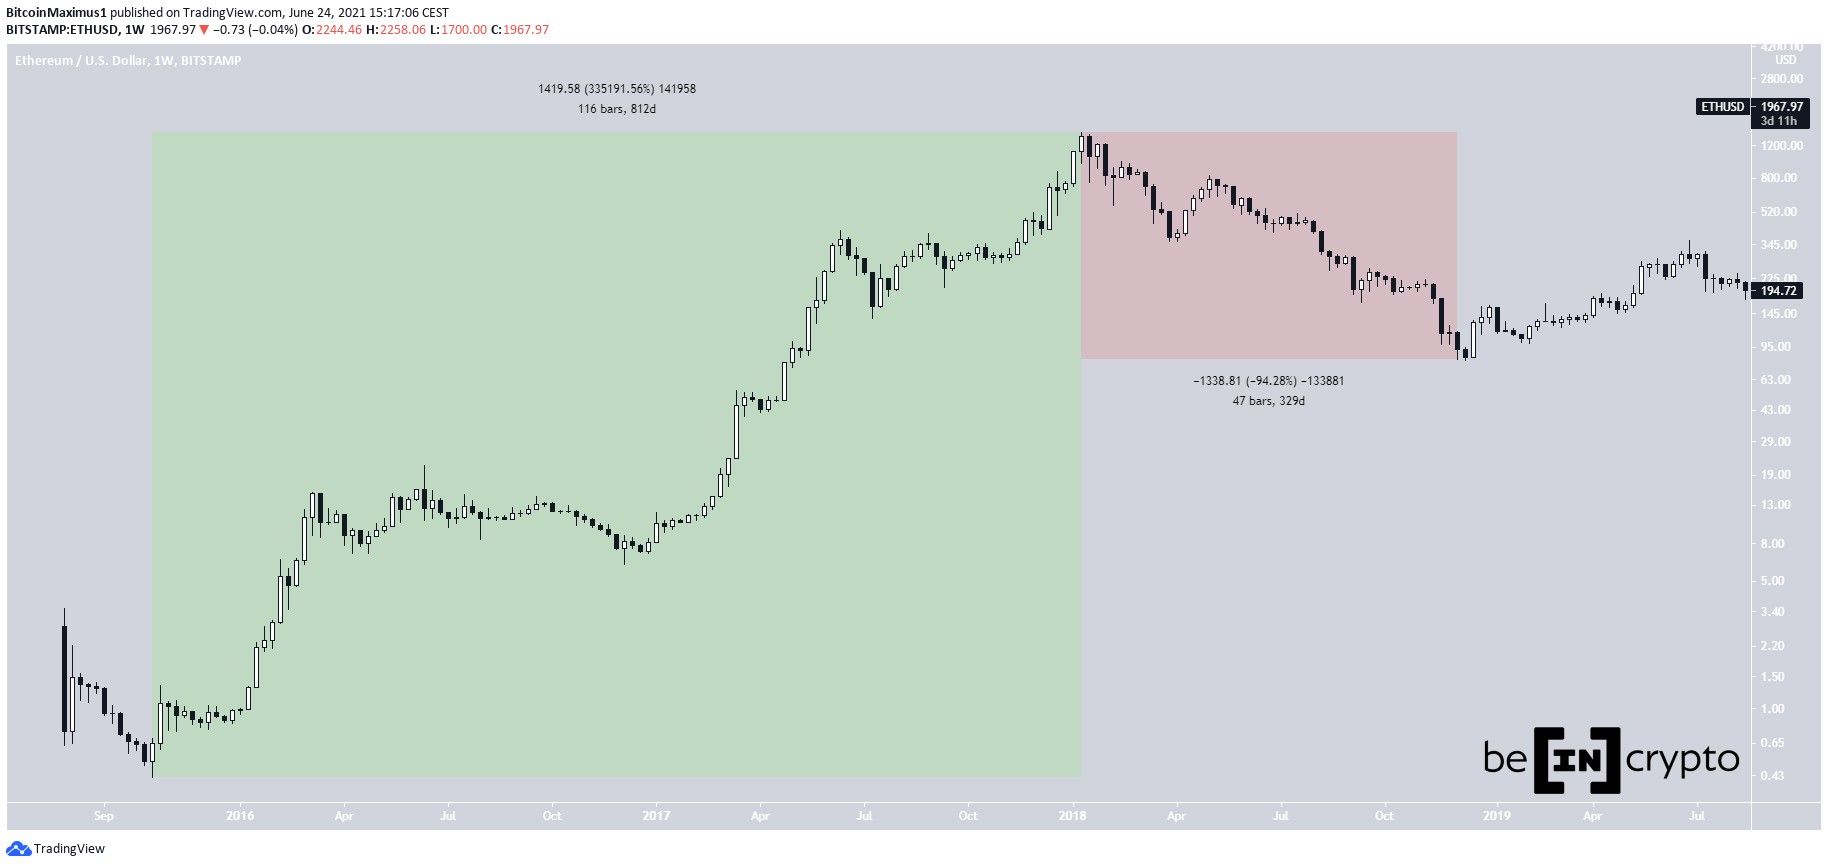
The first upward movement for ETH began on Oct. 2015. At the time, the token was trading at a low of only $0.42.
The upward movement continued for 812 days, leading to a then all-time high price of $1,420, reached in Jan. 2018. Throughout this period, ETH increased by a massive 335,191%.
Afterwards, a corrective period ensued, which continued for 329 days. It was roughly 2.5 times shorter than the upward movement. It culminated with a low of $81.19, which was reached on Dec. 2018. These two movements completed the first market cycle for Ethereum.
Since then, ETH has been on an upward trend.
Current ETH movement
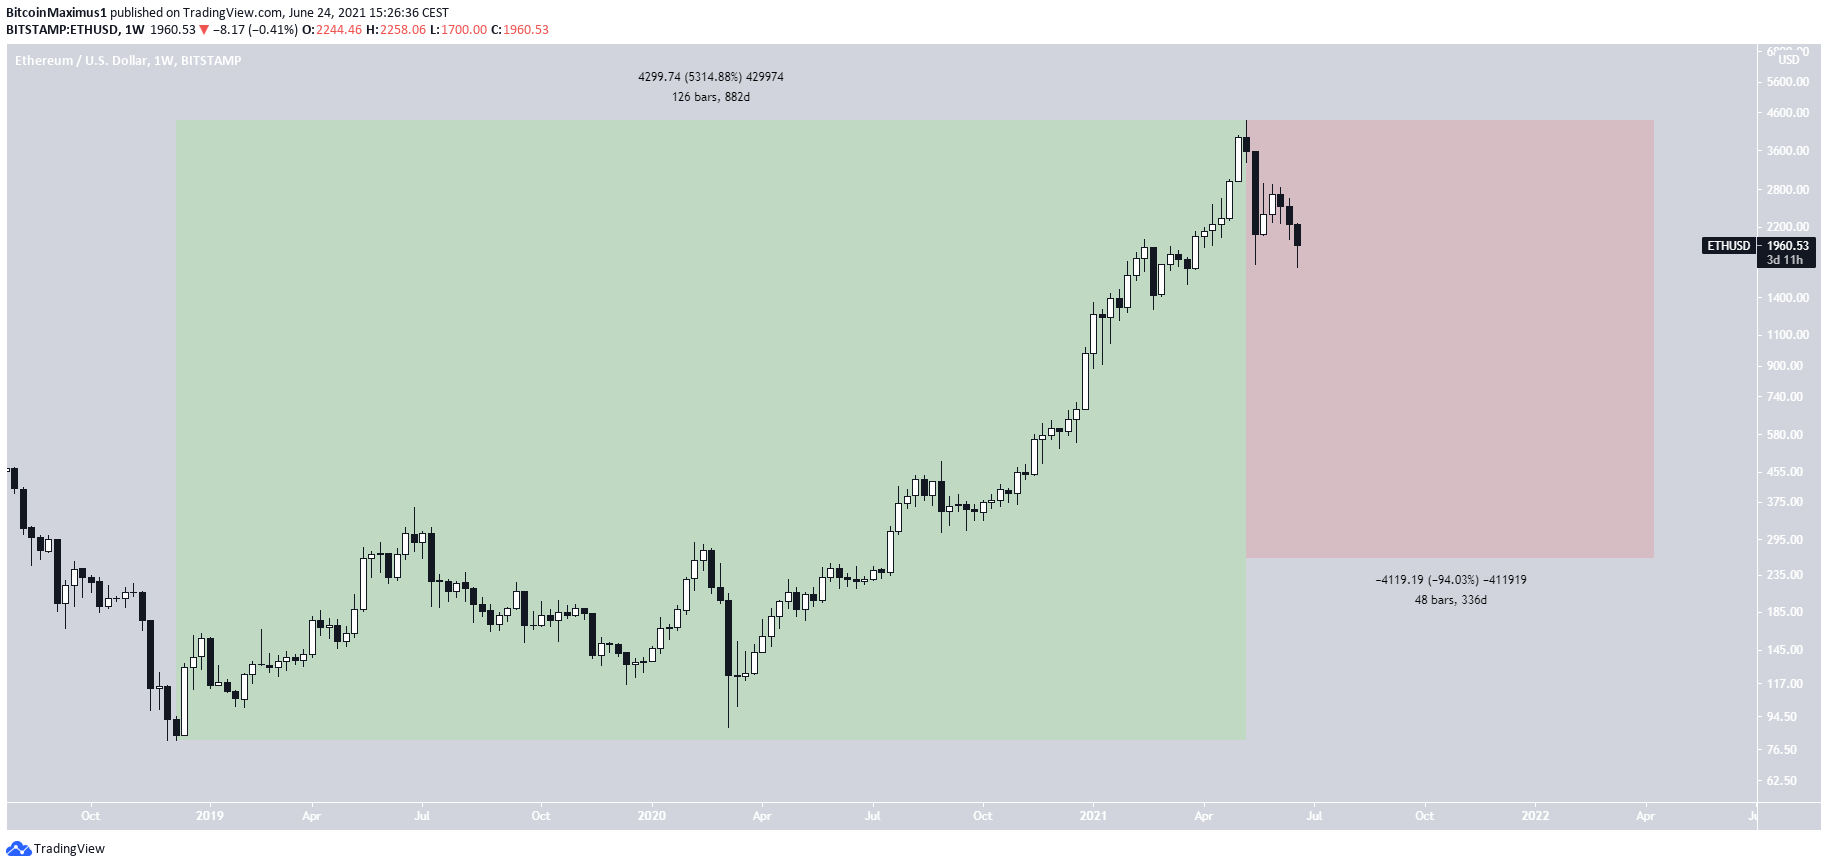
After the Dec. 2018 low, ETH began an upward movement that lasted for 882 days. It led to an all-time high price of $4,380 being reached in April 2021. The length of time was nearly identical to the preceding bull run of 2015-2018.
However, relative to the 2015-2018 movement, the rate of increase was significantly smaller. ETH increased by 5,314%, which is 60 times less than the magnitude of increase in 2015-2018.
If a similar 94% decrease were to follow, it would take the price to a low of $260. In addition, if the ratio of length between upward and downward movement remains the same, the low would be reached sometime in April 2022.
Nevertheless, it is not certain that the upward movement for ETH has ended, nor that it will follow a similar path as previously if it has in fact ended.
For BeInCrypto’s latest bitcoin (BTC) analysis, click here.



