


Throughout April 29 and 30, the Bitcoin (BTC) price increased by about 25 percent. The upward move has some similarities with a move which occurred on October 2019.
This similarity was outlined by well-known trader @CryptoCapo_, who tweeted a Bitcoin chart while comparing the recent price movement to that on October 2019 — otherwise known as the ‘Xi Pump.’
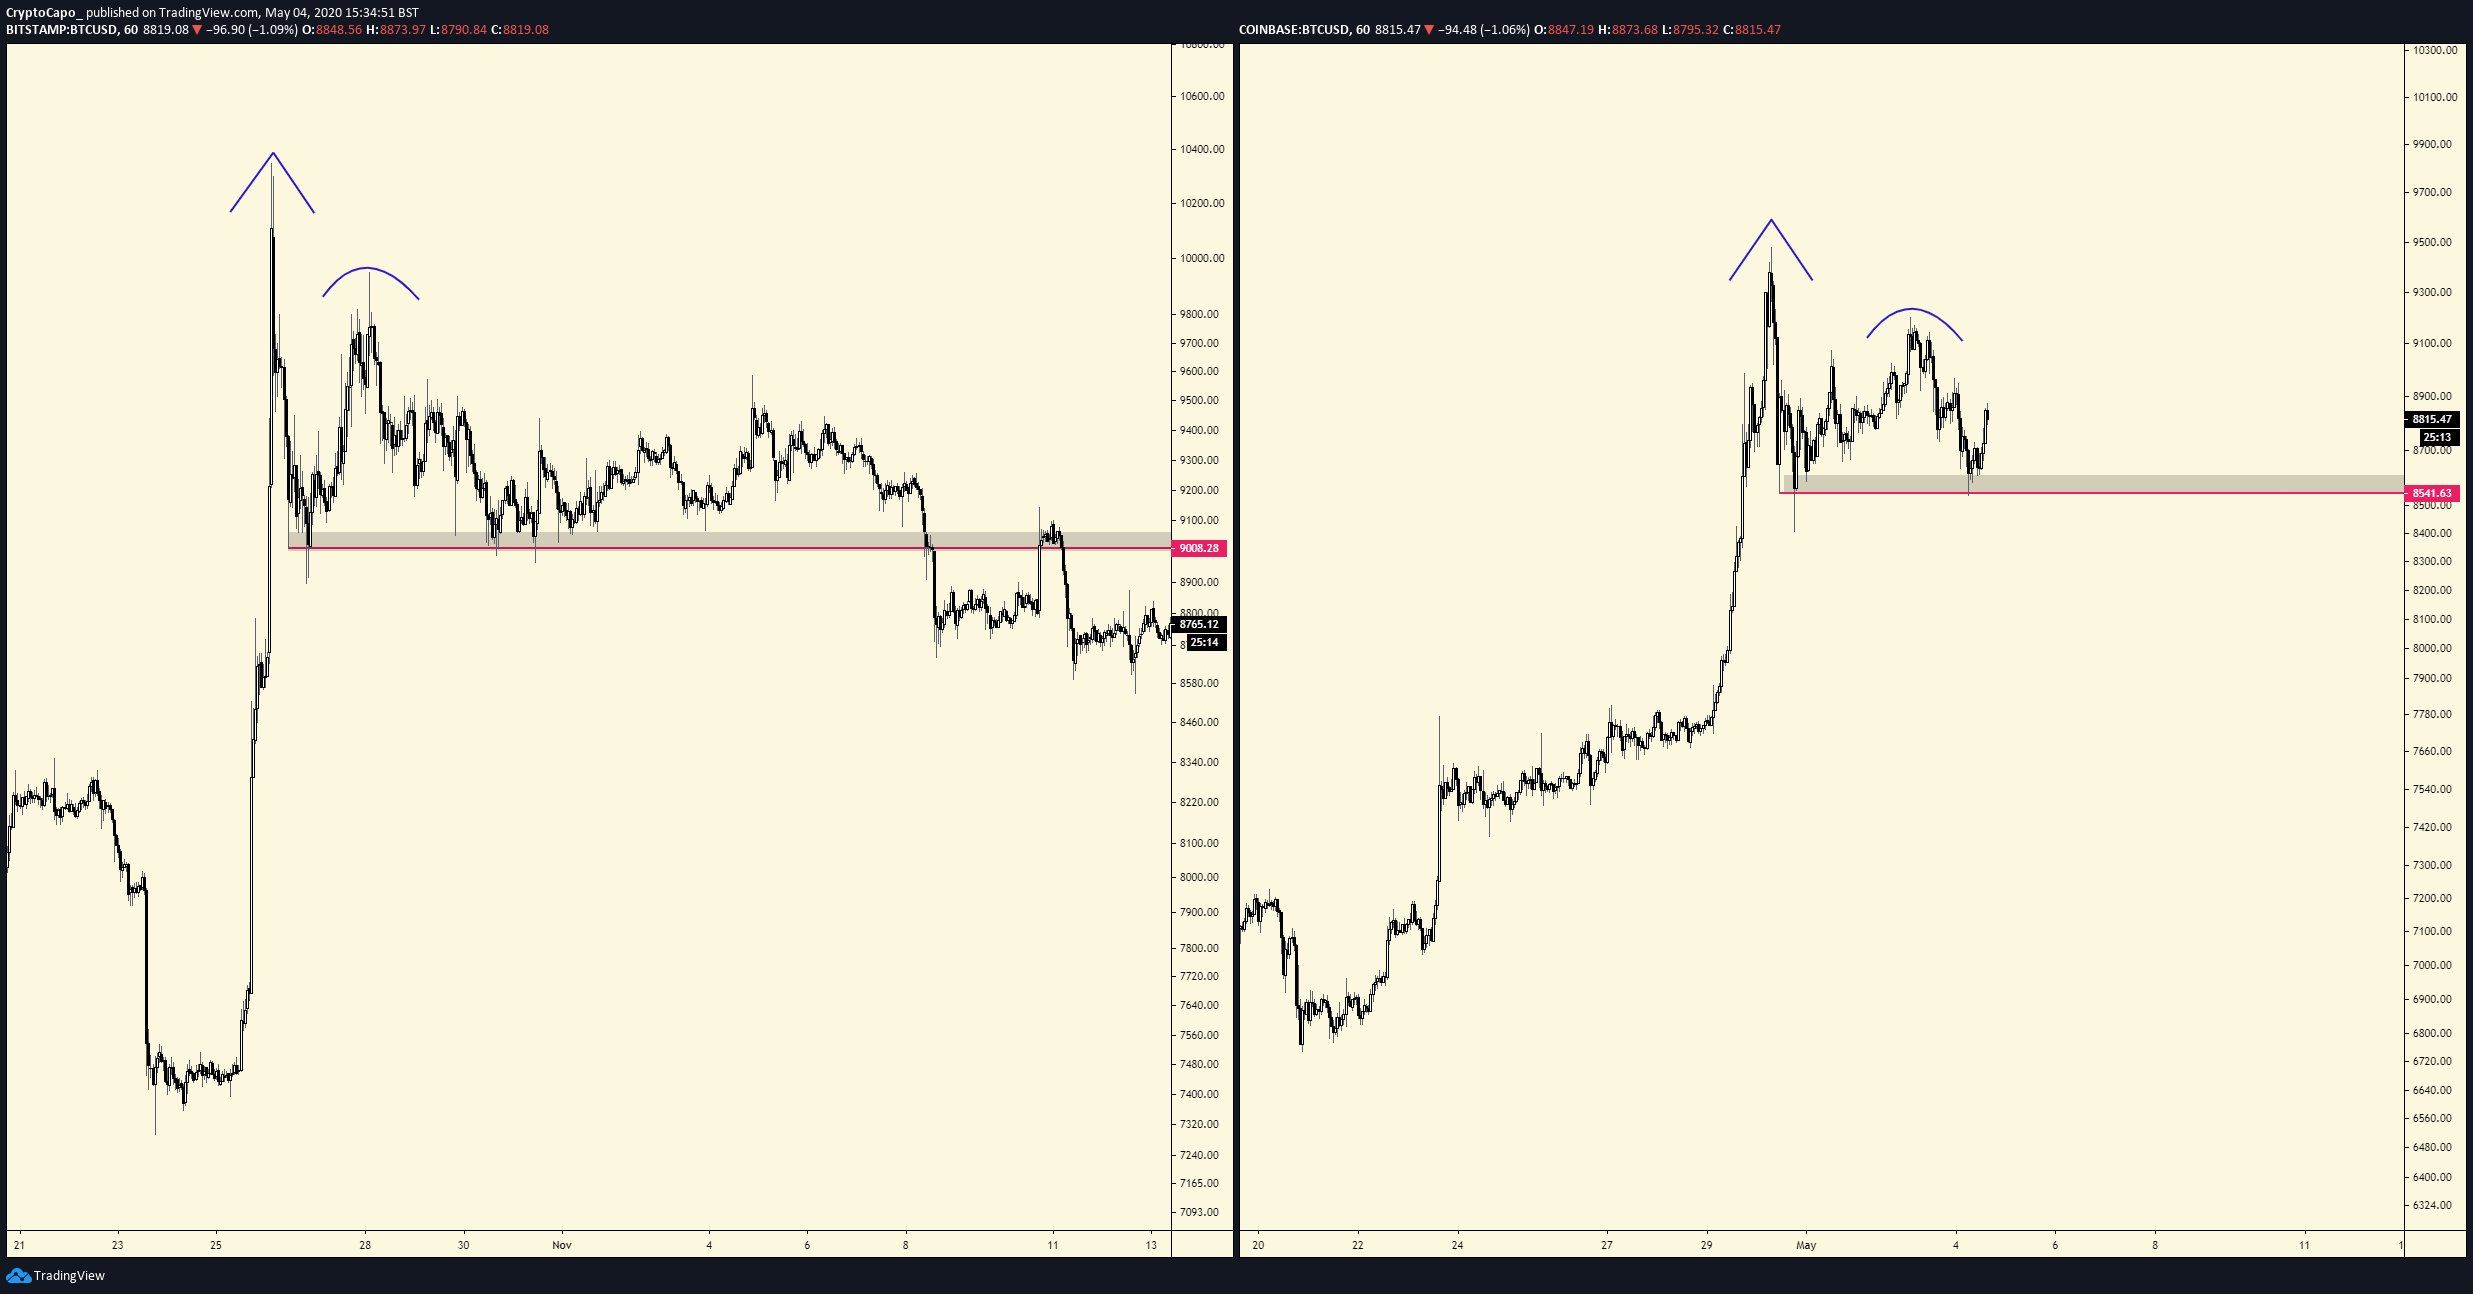
He stated that a very similar double top has been created, which could lead to a similar decrease.
Another distribution / Adam & Eve top pattern spotted by a follower, comparing the current PA with the ”Xi pump” top.
In this article, we will take a closer look at both movements and determine how similar they are and if the price will decrease in a way that resembles the October 2019 decrease.
Comparison
Both movements are shown in the image below, with the October 2019 one being in the upper portion of the chart while the current one in the lower.
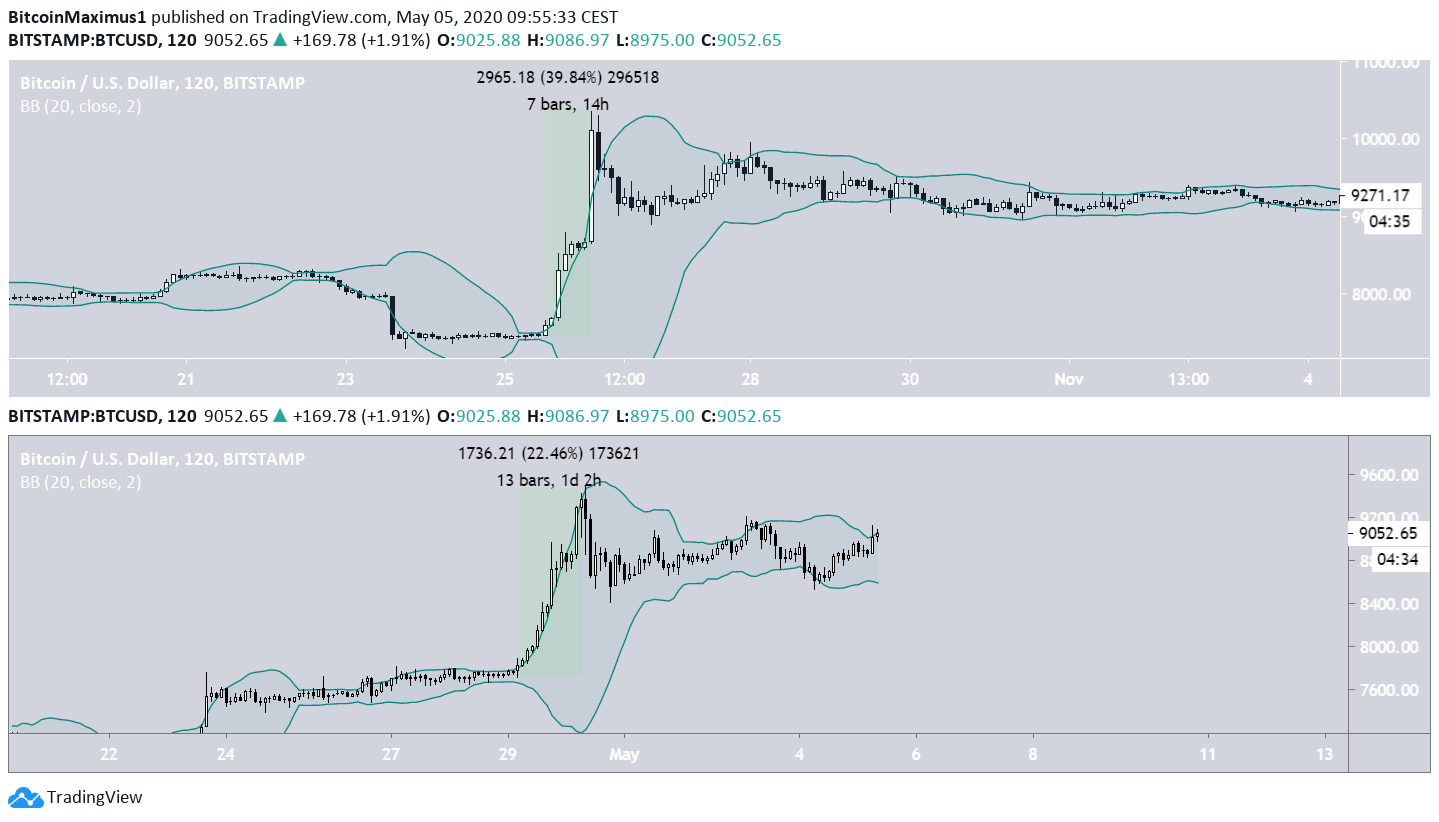
The biggest difference between the two charts is the upward move that preceded them. In the 2019 movement, the BTC price increased by a massive 40 percent in only 14 hours. This was also highlighted by the price moving way above the upper limit of the Bollinger Bands.
To the contrary, in the current movement, the price increased by ‘only’ 22 percent in 26 hours, causing the price to reach the upper Bollinger Band but not significantly move above it.
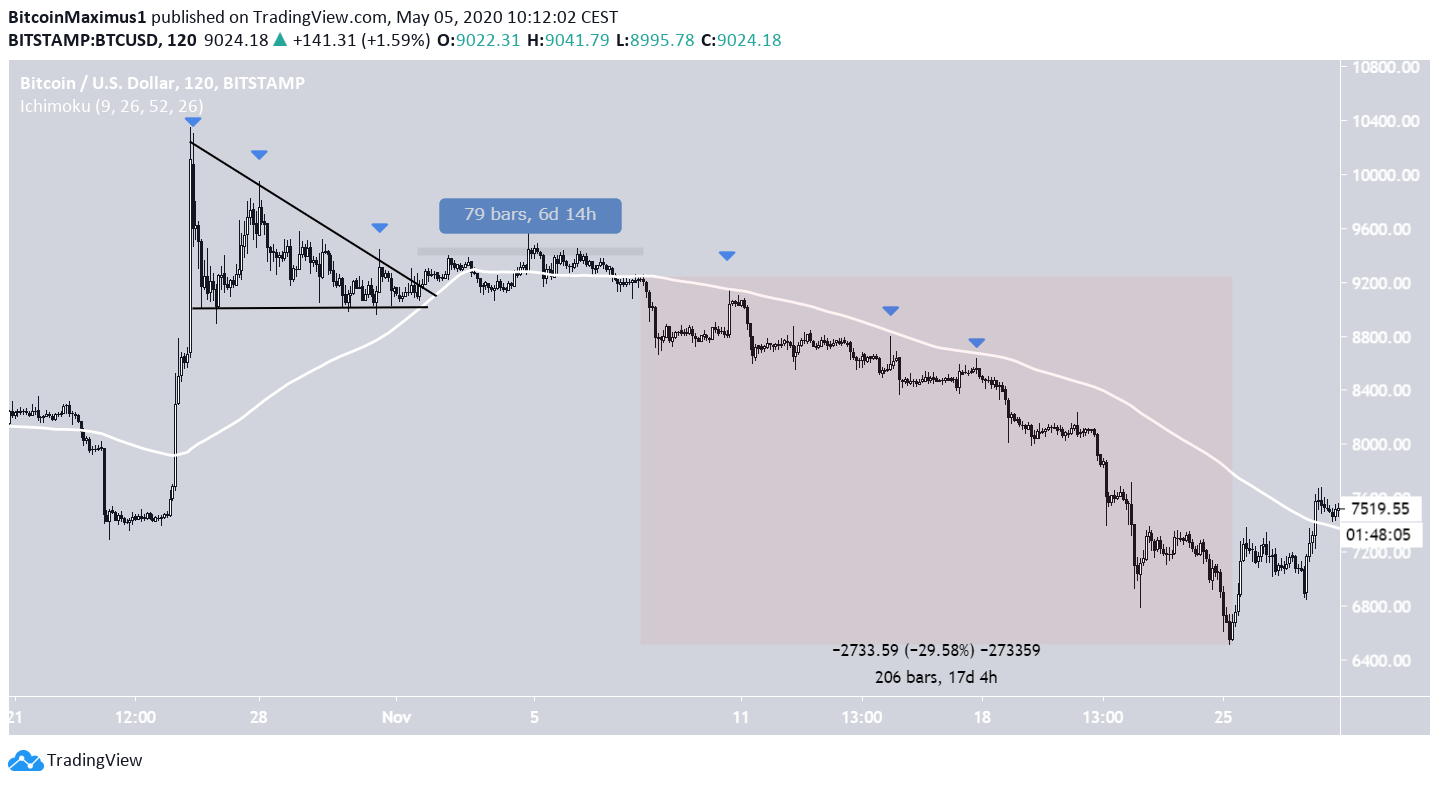
October 2019
After reaching a high on October 26, the Bitcoin price began to decrease in the form of a descending triangle. It validated the resistance line thrice before a very weak breakout transpired. The price consolidated for six days, before eventually breaking down.
During the downward move, the 200-hour moving average (MA) served as resistance. The BTC price decreased by 30 percent over 17 days.
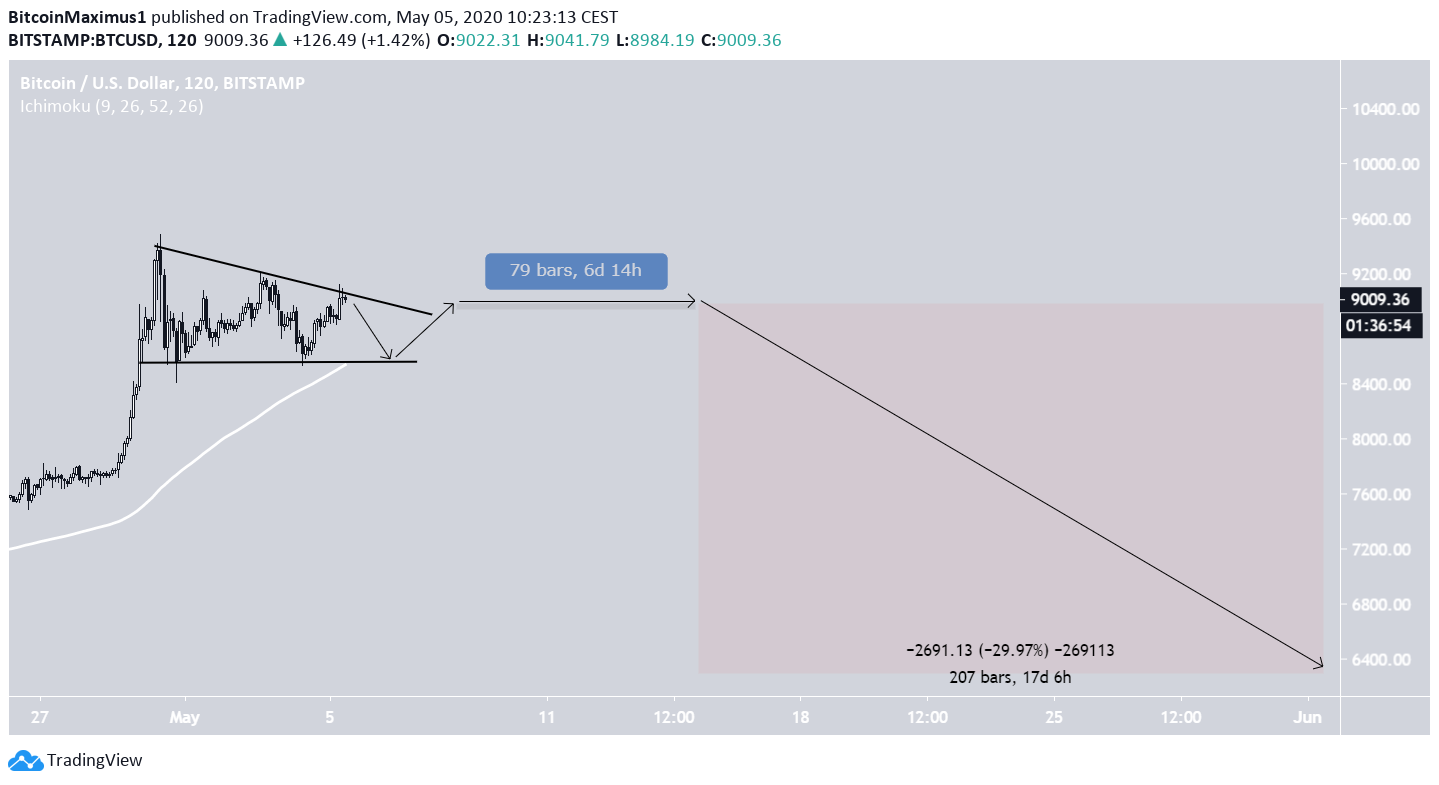
Current Bitcoin Price Movement
In the current movement, the Bitcoin price is trading inside a descending triangle,having just validated its resistance line for the third time. The position of the 200-hour MA is very similar to the October movement. If the fractal keeps being followed, the price will soon break out, consolidate until around May 15, and then begin a downward move.
Afterwards, if the fractal is followed in its entirety, the price will reach a low of $6300 in the beginning of June. However, in the first section we found out that the rate of magnitude has not been the same for both movements, especially during the initial upward move — so the target is just a rough outline of what might occur.
To conclude, the Bitcoin price is possibly following a fractal from October 2019. The fractal suggests that Bitcoin will eventually break out from its current pattern, begin a period of consolidation, and then initiate a significant downward move.
In our previous article dealing with corrections, we have outlined several paths the price might take if it begins a downward move.


