


Chiliz (CHZ) is nearing the end of a neutral pattern that has been in place since March. Therefore, a decisive movement is expected in the near future.
CHZ has been moving upwards since May 23, when the token was trading at a low of $0.164. The upward movement has been gradual so far.
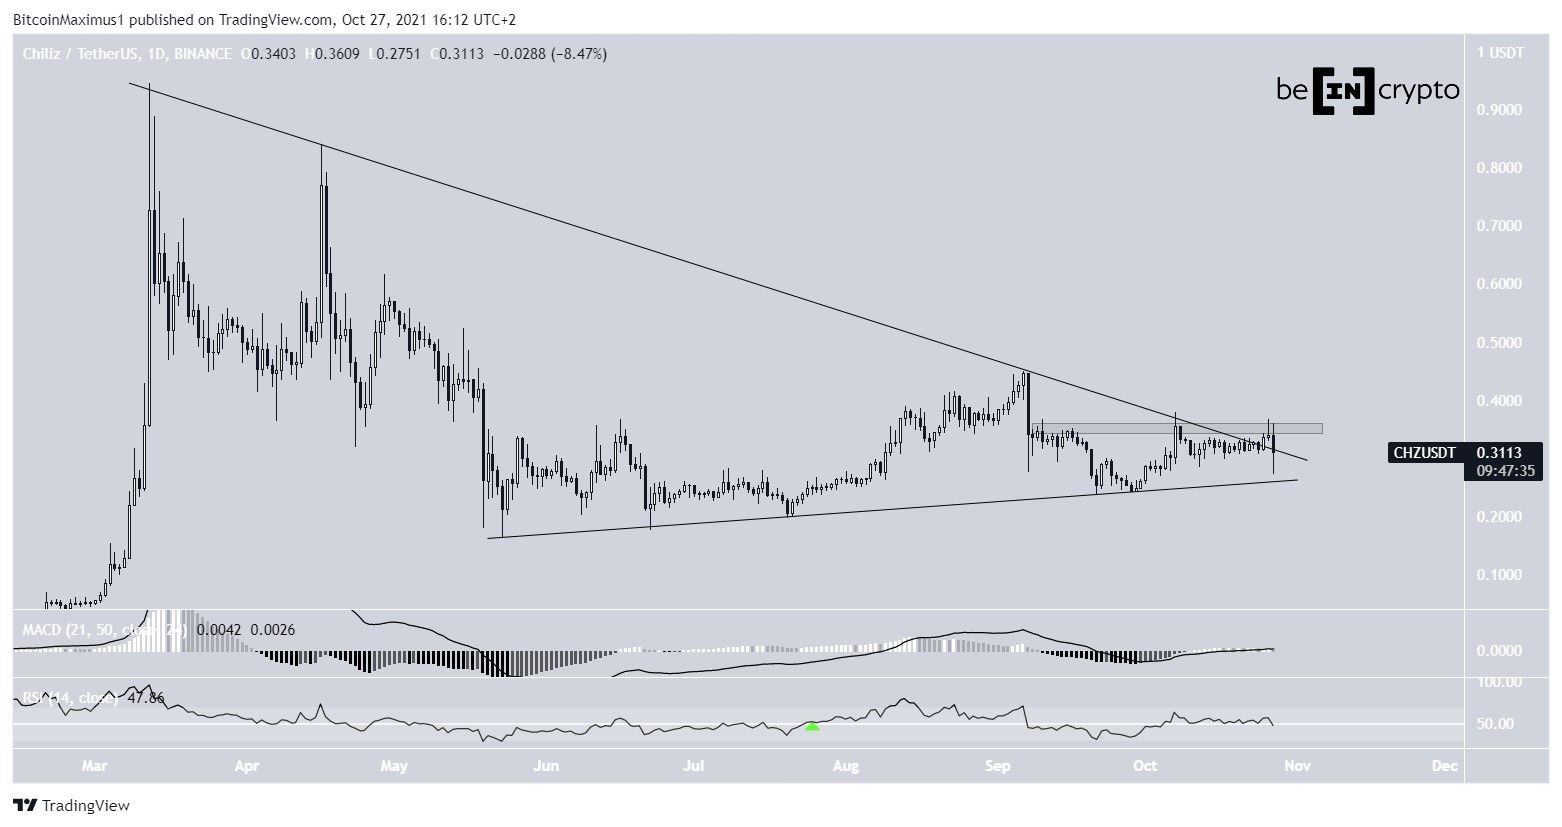
Since the beginning of Sept, the token has thrice attempted to move above the $0.355 horizontal area. However, it has been rejected each time, validating the area as resistance.
More importantly, CHZ is nearing the end of a symmetrical triangle pattern, which is created by the aforementioned ascending support line and a descending resistance line in place since the March all-time highs.
Still, the triangle is considered a neutral pattern. In addition to this, both the MACD and RSI are giving a neutral reading.
The MACD, which is created by a short- and a long-term moving average (MA), is right at the 0 line. This means that the short-term MA is moving at the same speed as the long-term one. Furthermore, the RSI is right at the 50 line. This is a sign that momentum is neutral.
Therefore, more data is required in order to determine if CHZ will break out or down.
Future movement
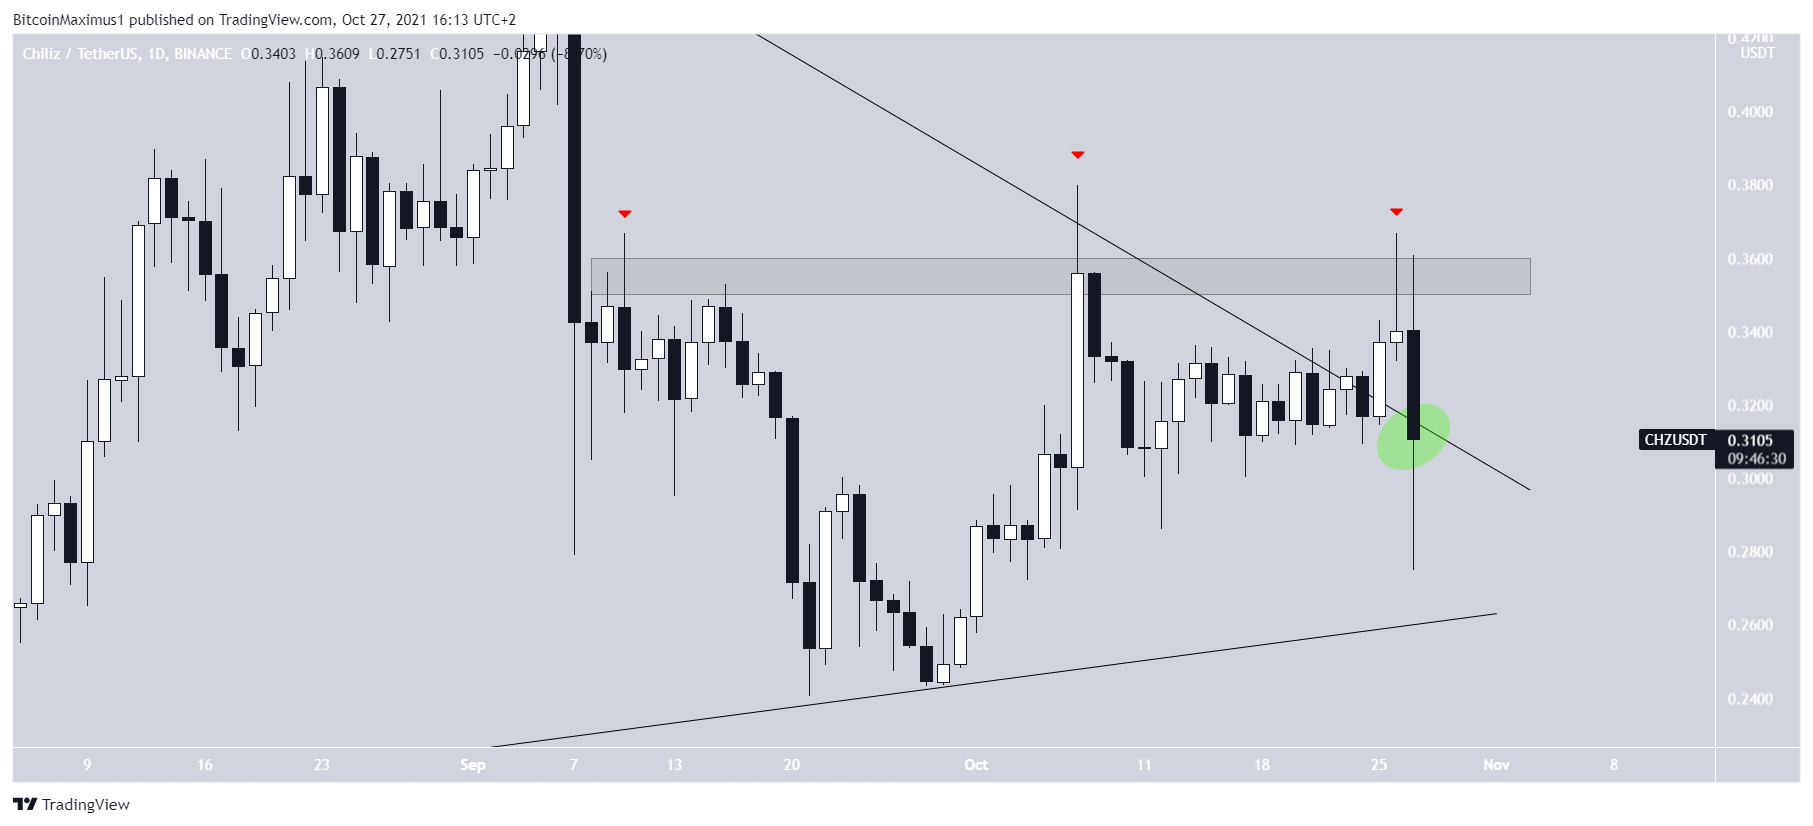
A closer look shows that CHZ has actually broken down from the pattern, but could be falling back inside it.
Today’s close is extremely important, since if CHZ manages to hold on above the resistance line of the triangle and create a long lower wick, it would be a sign that the breakout is legitimate and CHZ will move higher.
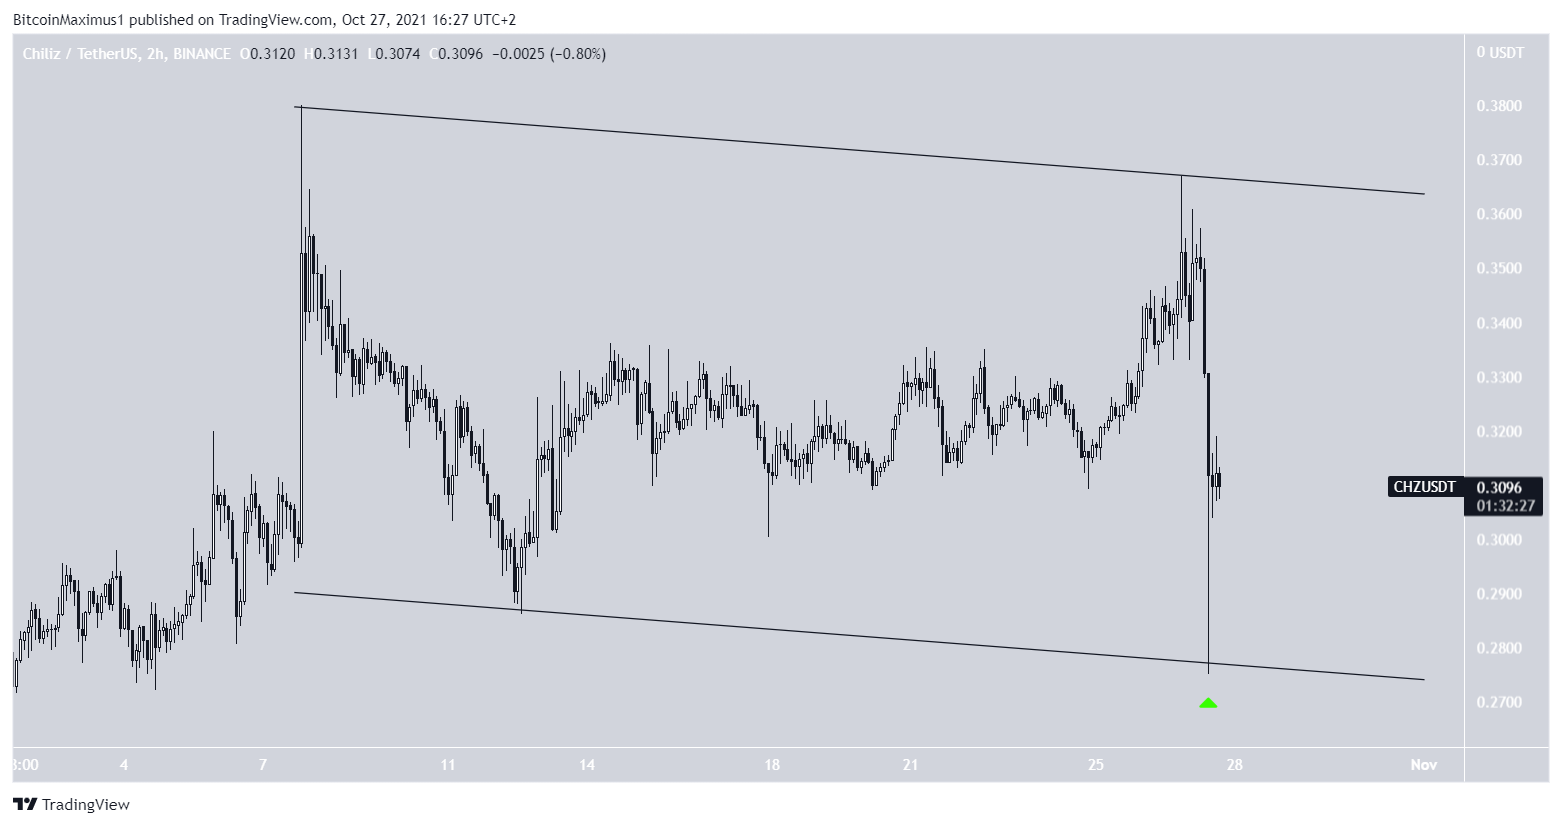
The bullish possibility is supported by a look at the even shorter-term six-hour time-frame. It shows a descending parallel channel, and has bounced at its support line (green icon).
Such channels usually contain corrective movements, meaning that a breakout and a resumption of the upward movement would be likely.
CHZ wave count
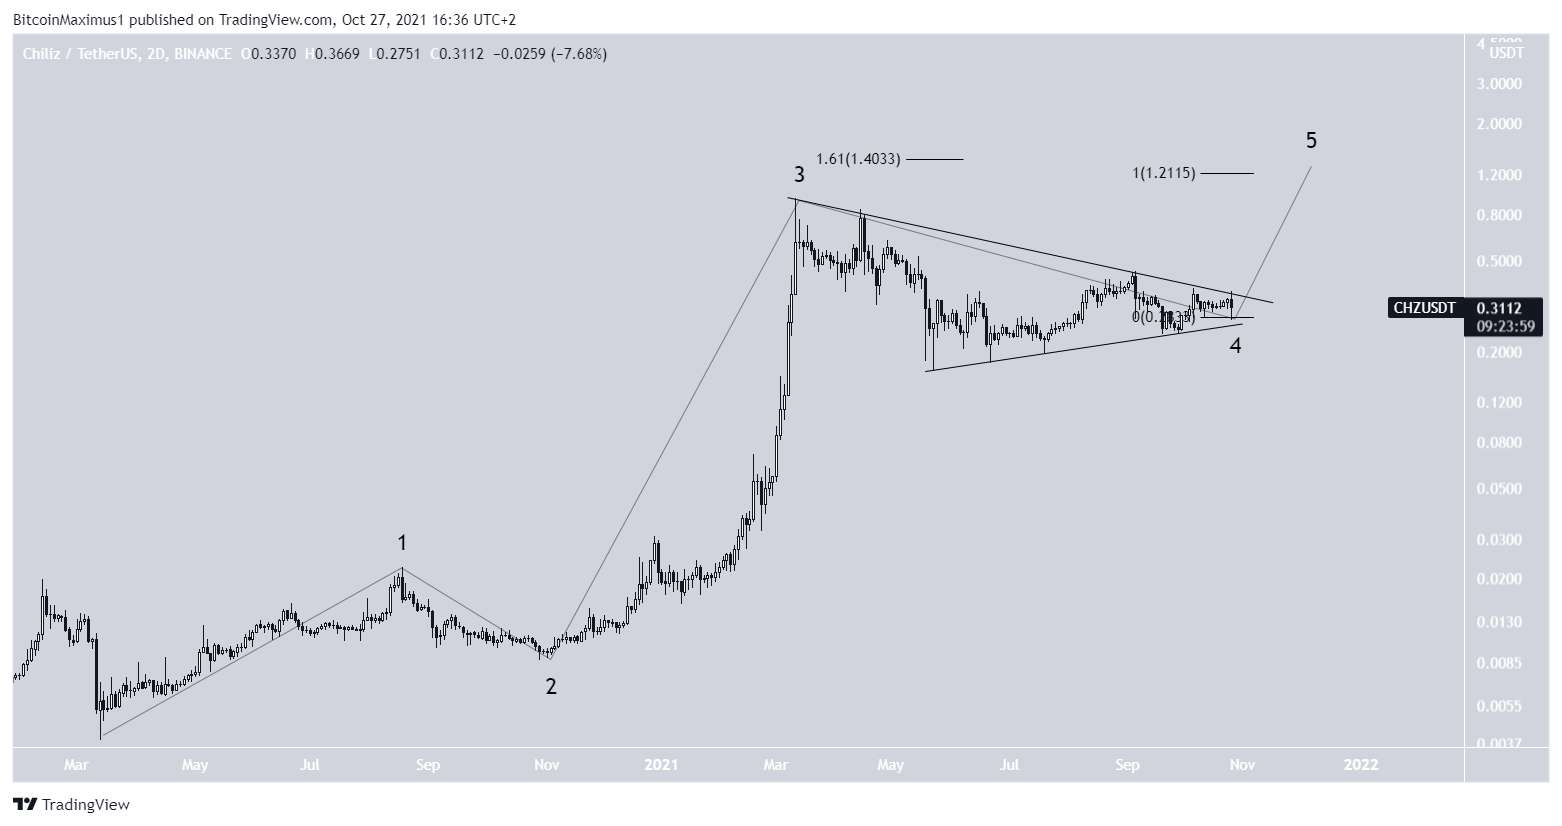
Cryptocurrency trader @TheTradinghubb outlined a CHZ wave count, in which the token is beginning a long-term wave five, which will take it well into a new all-time high.

The most likely wave count does indeed suggest that the token is in wave five of a bullish impulse that began in March 2020. This is the final portion of the upward movement prior to a significant correction.
It seems that wave four took the form of a symmetrical triangle, which is the most common one for such waves.
If correct, the first target for the top of the upward movement would be between $1.20 – $1.40. This is the 1.61 external Fib retracement resistance level when measuring the most recent drop (white) and the length of waves 1-3 projected to the bottom of wave four.
For BeInCrypto’s latest Bitcoin (BTC) analysis, click here.
What do you think about this subject? Write to us and tell us!


