


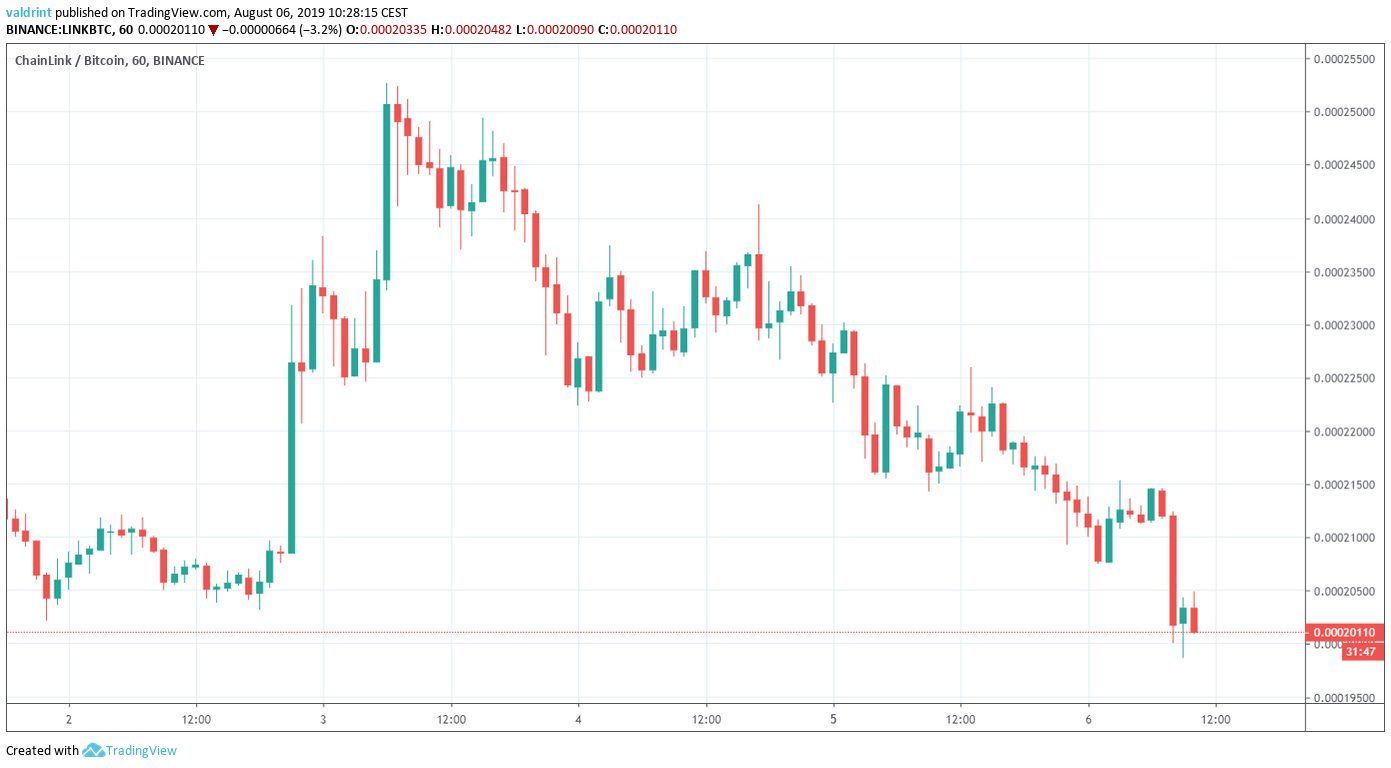
On August 1, 2019, the LINK price reached a low of 20,207 satoshis. An upward move began the next day. On August 3, it reached a high of 25,271 satoshis. It has been decreasing since. On August 6, it dropped below 20,000, reaching lows close to those before the upward move.
Will LINK begin a reversal or are there further decreases in store? In order to answer this question, we will analyze the LINK price in different time-frames alongside technical indicators.
For our previous analysis, click here.
If you are interested in trading cryptocurrencies with a multiplier of up to 100x on our new partner exchange with the lowest fees, follow this link to get a free StormGain account!
Chainlink Price: Trends and Highlights for August 6
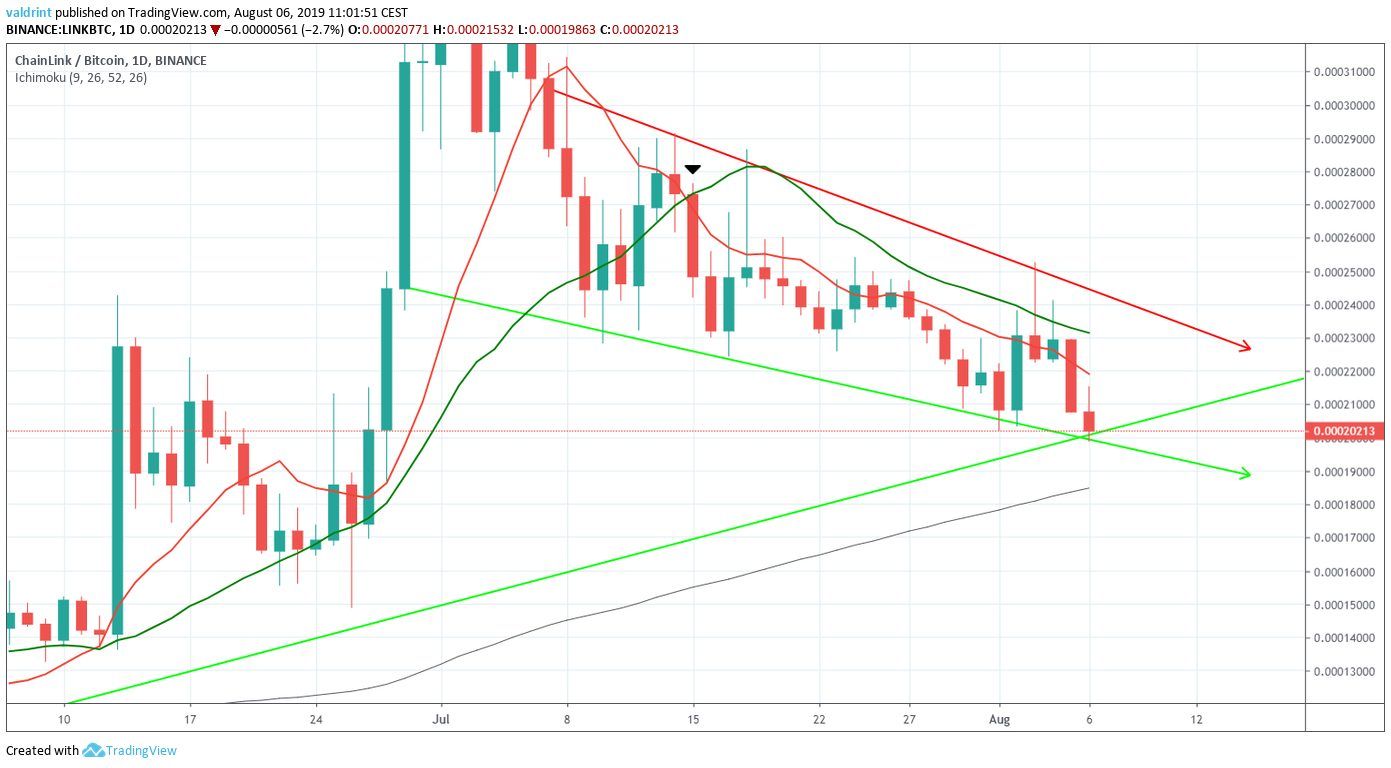
- LINK/BTC is trading inside a descending wedge.
- It is following a long-term ascending support line.
- There is bullish divergence developing in the RSI.
- LINK has found support above the 100-day moving average.
Current Pattern
Since July 7, LINK has been trading inside the descending wedge outlined below.
The descending wedge is considered a bullish pattern, making price breakouts more likely.
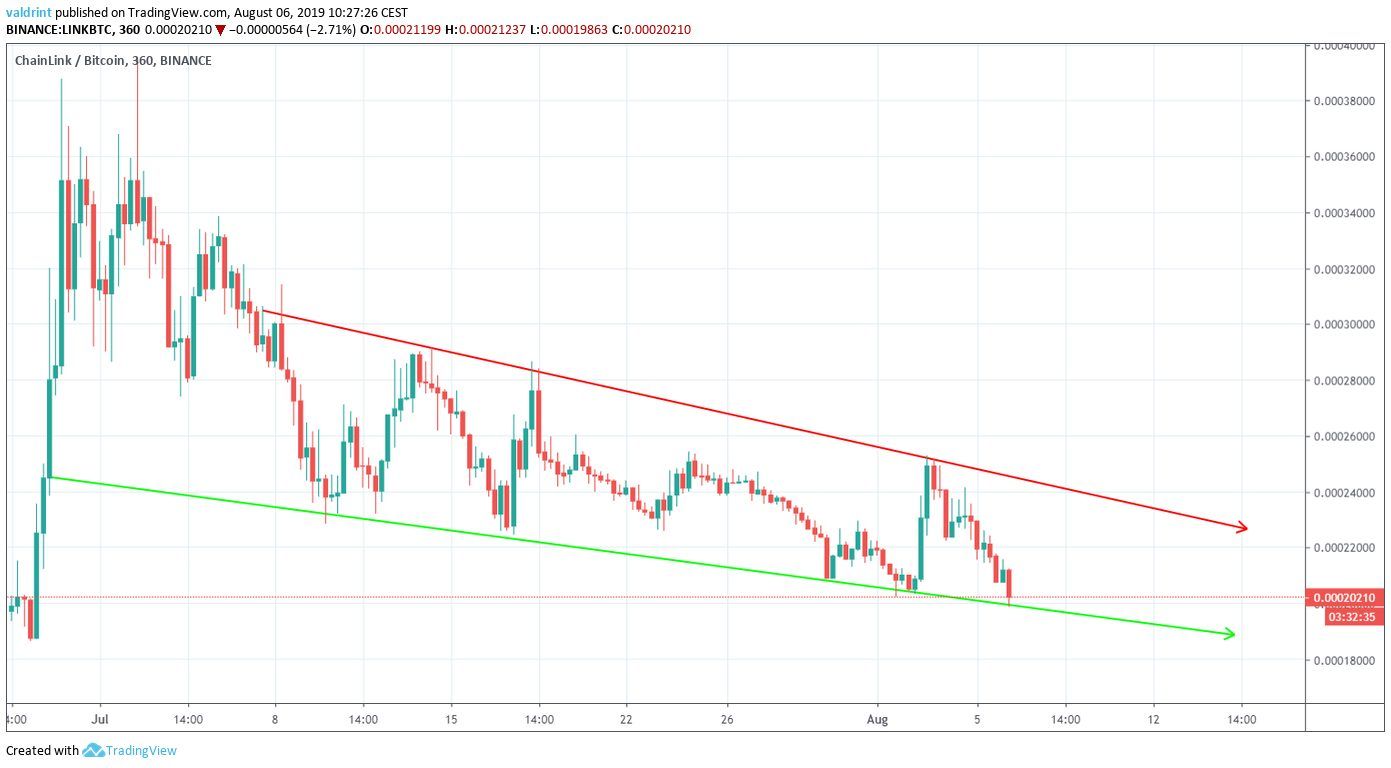
At the time of writing it was trading right on the support line.
This is the fifth time the line has been touched, increasing its validity.
Additionally, we can see that the Chainlink price has been following a long-term ascending support line since May 13.
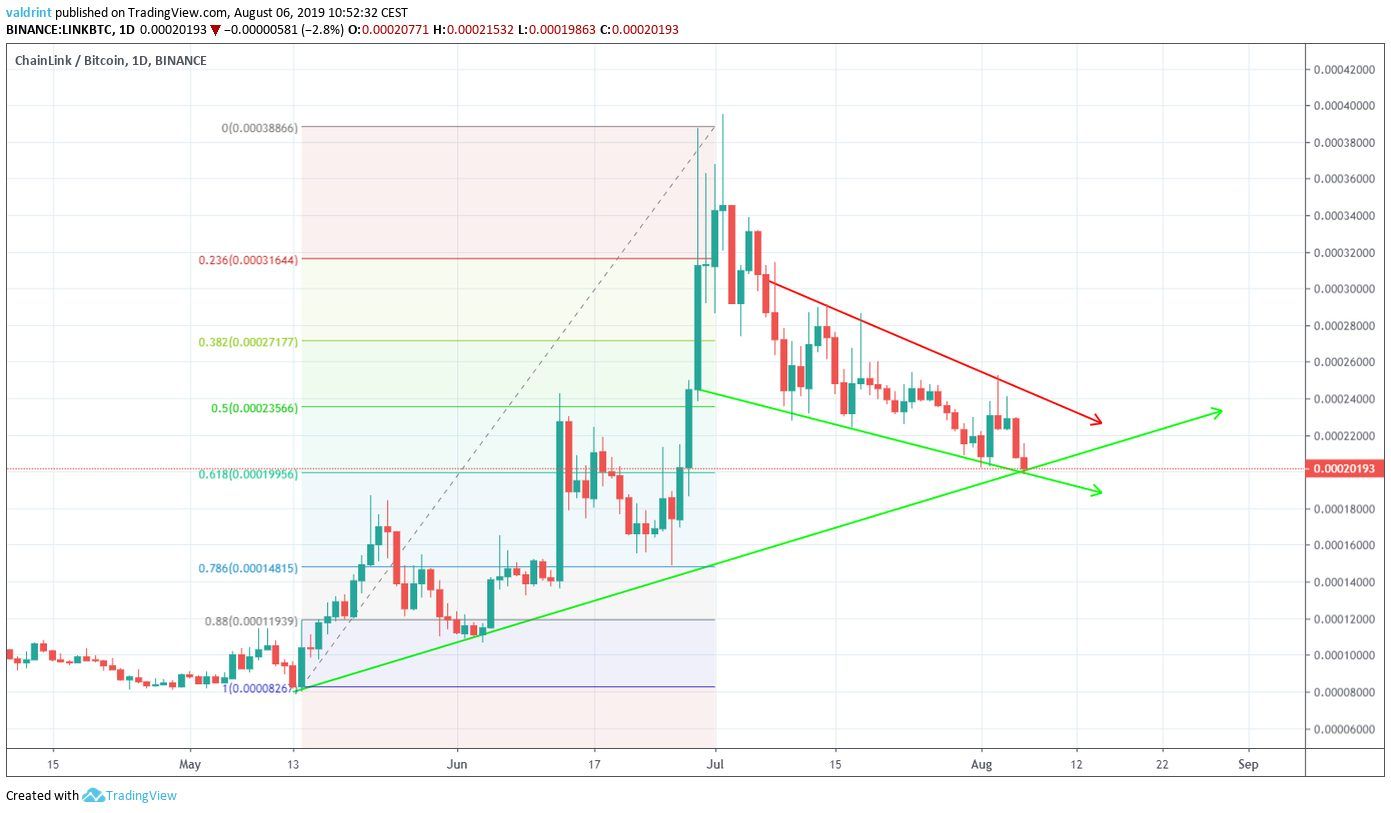
Furthermore, using a Fibonacci retracement tool that encompasses the entire upward move, we can see that the price is currently at the 0.618 fib level, making this a suitable place for the beginning of a reversal.
Will the price do so?
Let’s take a look at some technical indicators.
Sign up for a Binance account to trade Chainlink and other cryptocurrencies with ease.
Bullish Divergence
A look at the RSI suggests that the price will soon begin an upward move towards resistance.
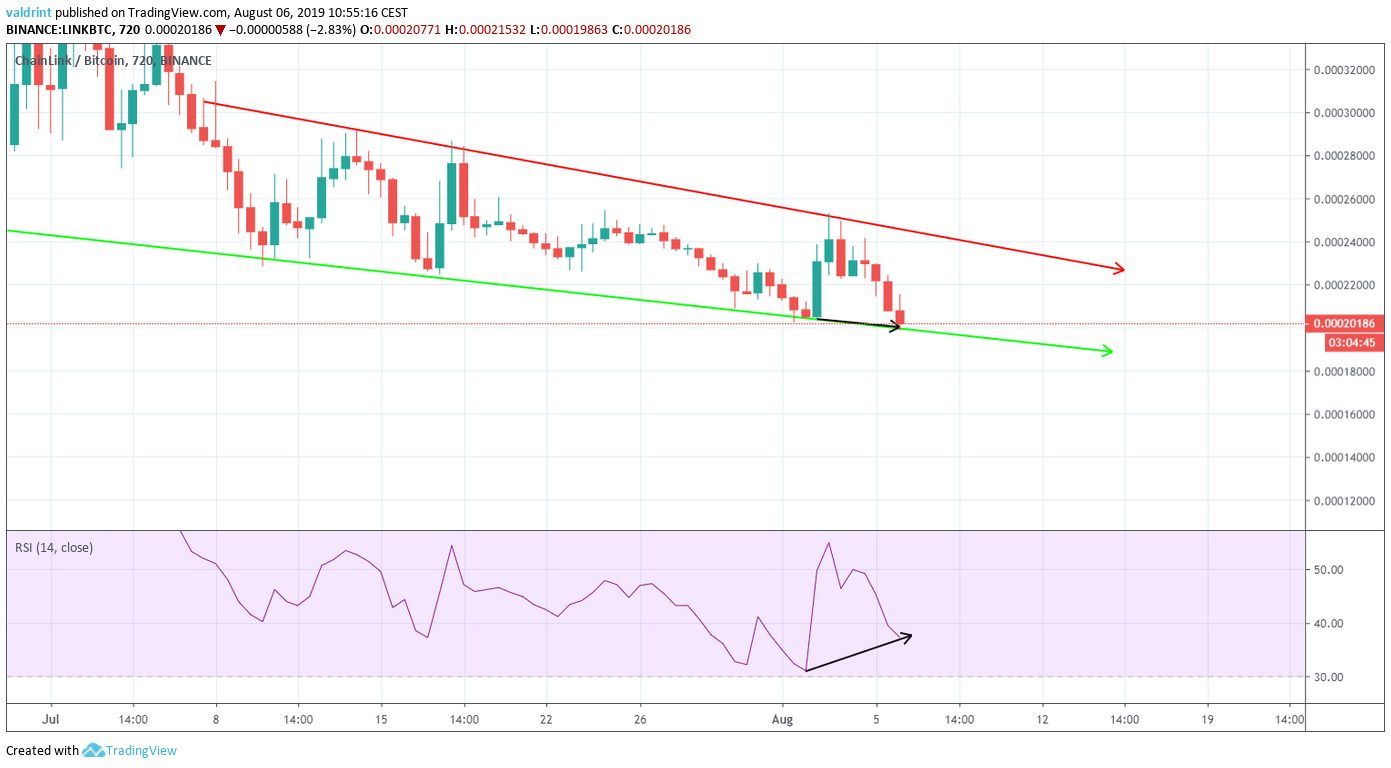
While the Chainlink price has touched the descending support line on August 2 and 6, the RSI has been generating higher values.
This divergence is visible in time-frames up to 12-hours.
A look at the daily moving averages (MA) gives a more ambiguous point of view.
A bearish cross between the 10- and 20-day MAs transpired on July 15.
LINK has been facing resistance from the MAs ever since.
However, the price is trading above the 100-day MA, possibly finding support above it.
The combination of these indicators and previous price movement that created a bullish pattern makes us believe that the price will soon move towards the resistance line of the wedge.
Eventually, a breakout seems likely.

Chainlink Price Summary
The LINK price is trading inside a descending wedge.
According to our analysis, it is likely to increase towards the resistance line of the wedge.
Do you think LINK will initiate an upward move? Let us know in the comments below.
Disclaimer: This article is not trading advice and should not be construed as such. Always consult a trained financial professional before investing in cryptocurrencies, as the market is particularly volatile.
Images are courtesy of Shutterstock, TradingView.


