


The price of Chainlink (LINK) is eying bullish momentum following its recent move.
Following our insights in the latest BeInCrypto LINK analysis, the LINK price has confirmed the bullish outlook we’ve been anticipating.
Chainlink Technical Analysis: Bullish Outlook Confirmed on Daily Chart
Chainlink (LINK) has recently moved above the upper boundary of the Ichimoku cloud on a daily timeframe, which is currently around $17.41. This breakout is a bullish signal, suggesting that LINK could see further upward momentum if it maintains this level.
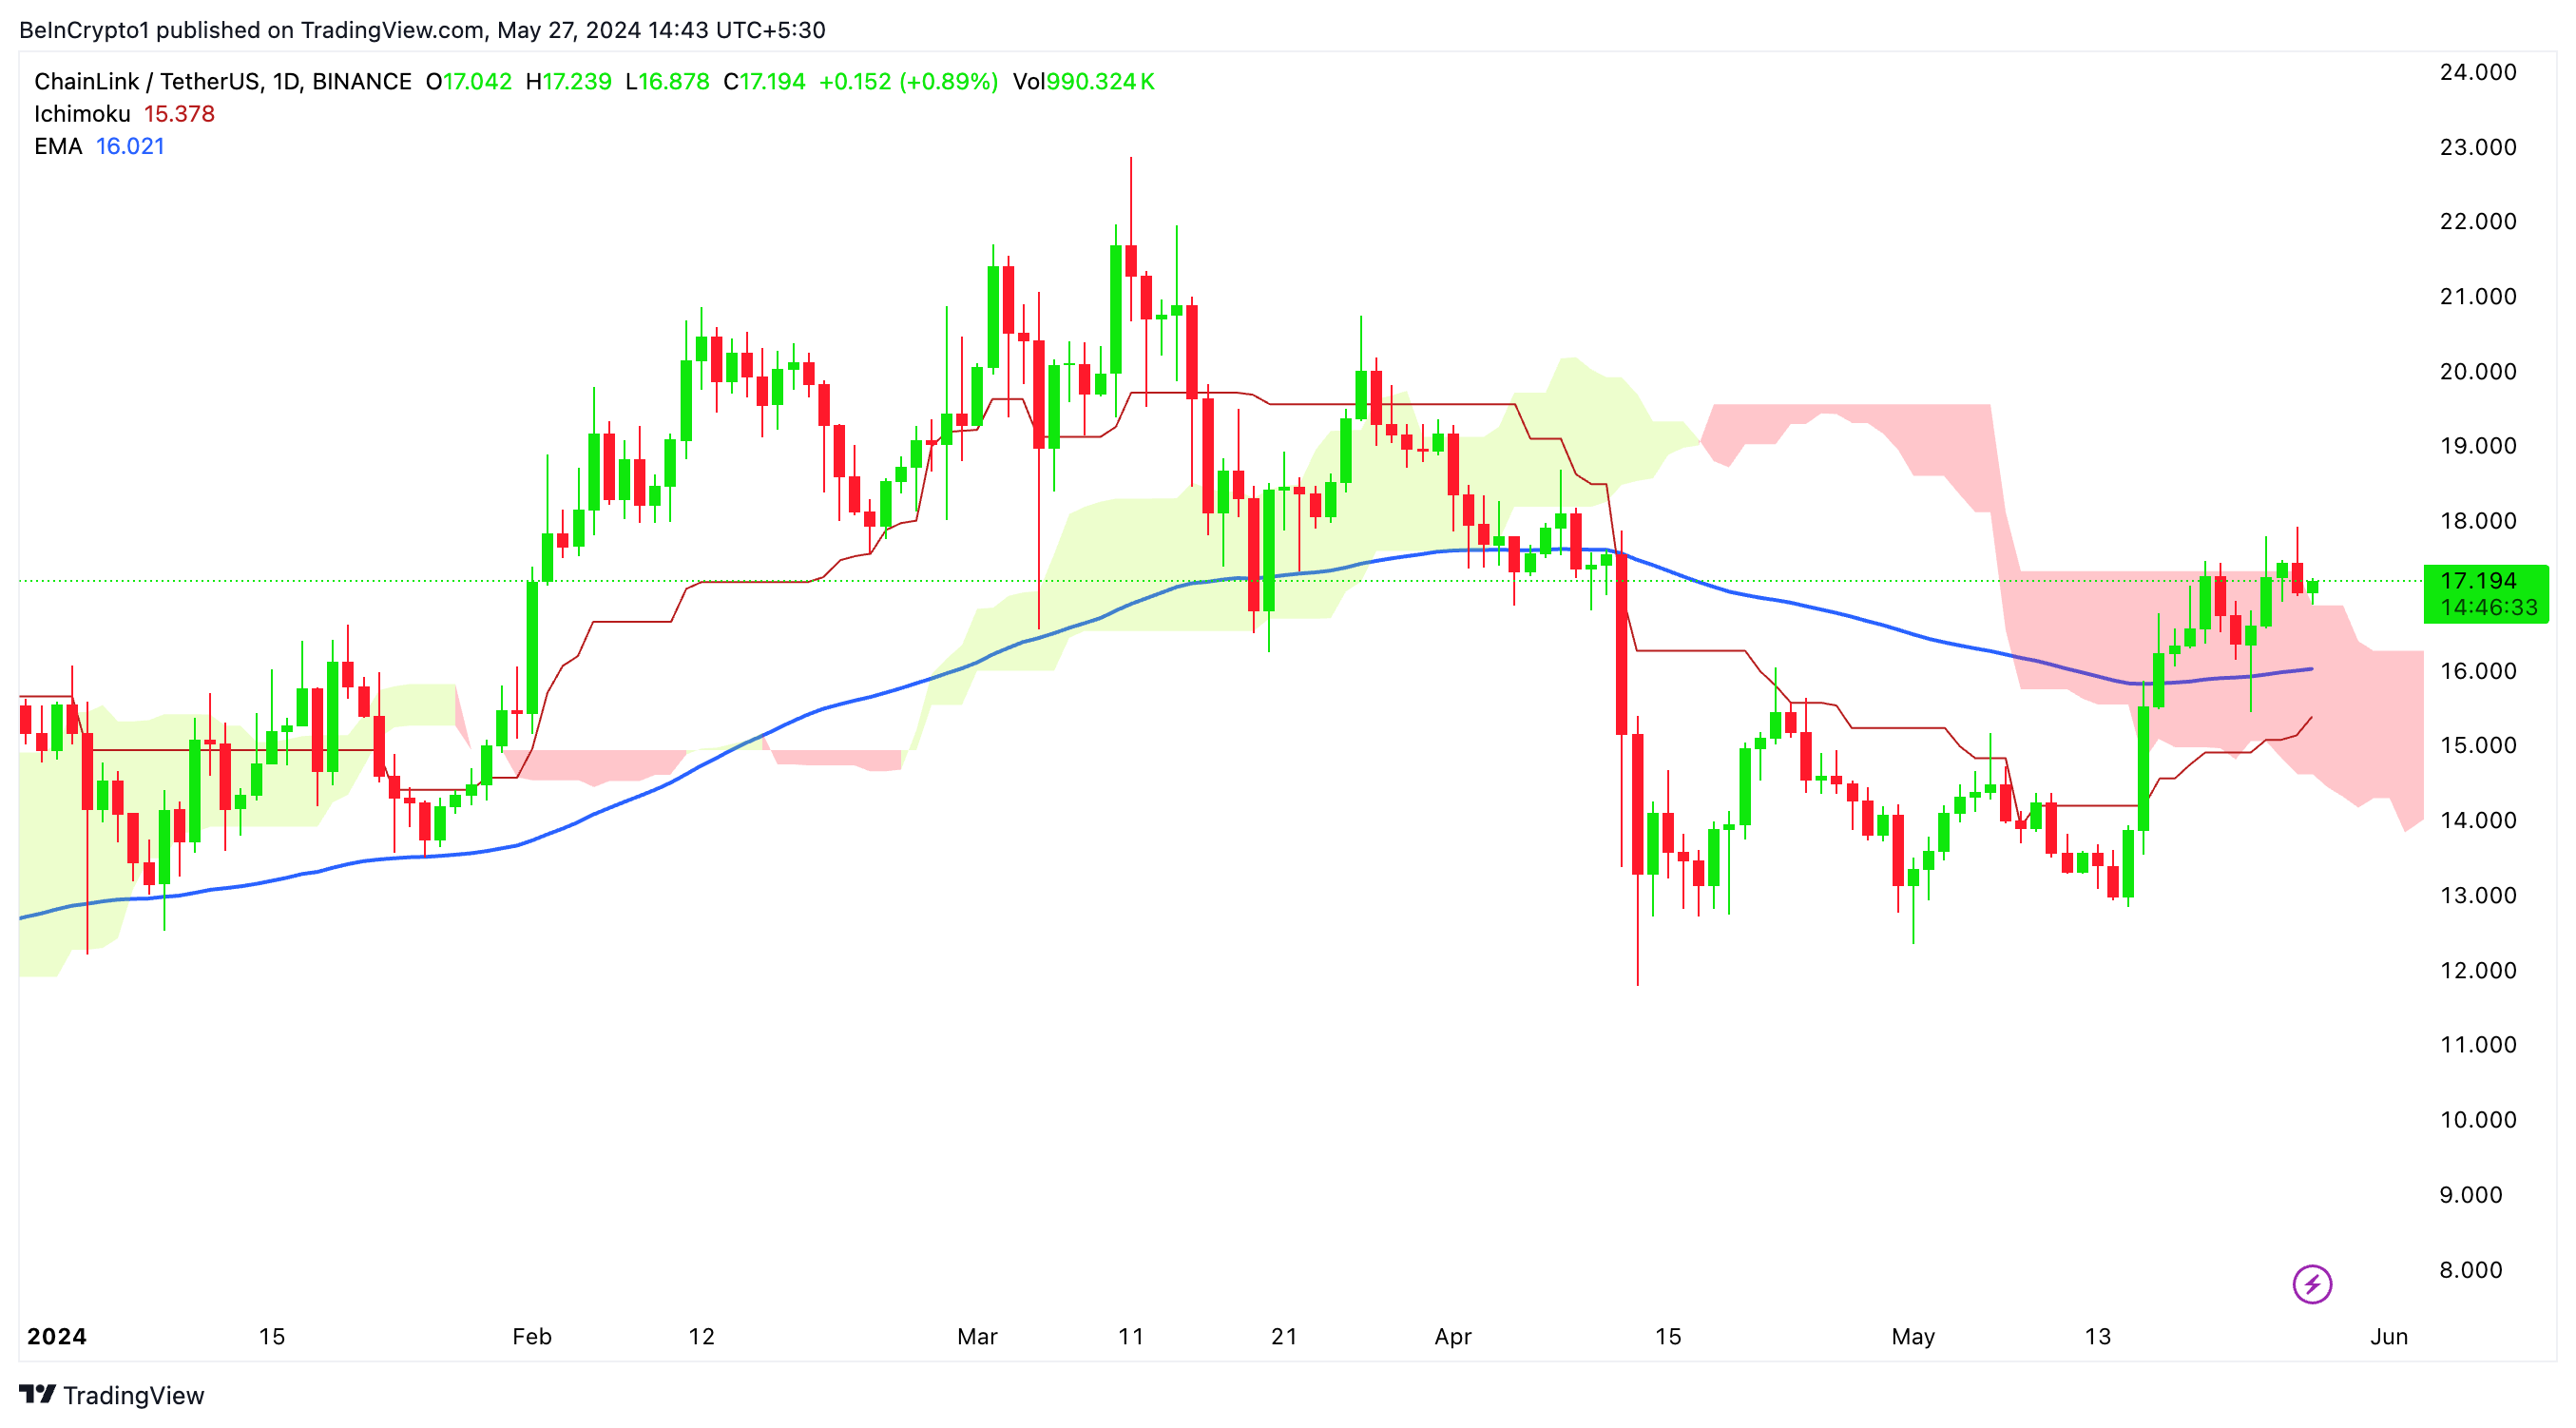
The 100-day EMA (blue line) is currently at $16.02, providing a strong support level. LINK has successfully tested this EMA and is trading above it, reinforcing the bullish sentiment. The price remaining above this EMA indicates sustained buying pressure.
The immediate resistance level to watch is the upper boundary of the Ichimoku cloud at $17.41. A break and close above this level would confirm further bullish momentum.
The support levels to watch are $16.02 (the 100-day EMA) and $14.6 (the lower boundary of the daily Ichimoku cloud). These levels are crucial for maintaining the current bullish outlook.
LINK Technical Analysis on 4-Hour Time Frame
On the 4-hour timeframe, LINK is trading above the Ichimoku cloud, signaling a bullish trend. The green cloud indicates an upward trajectory, offering support below the current price (with the Tenkan line in red).
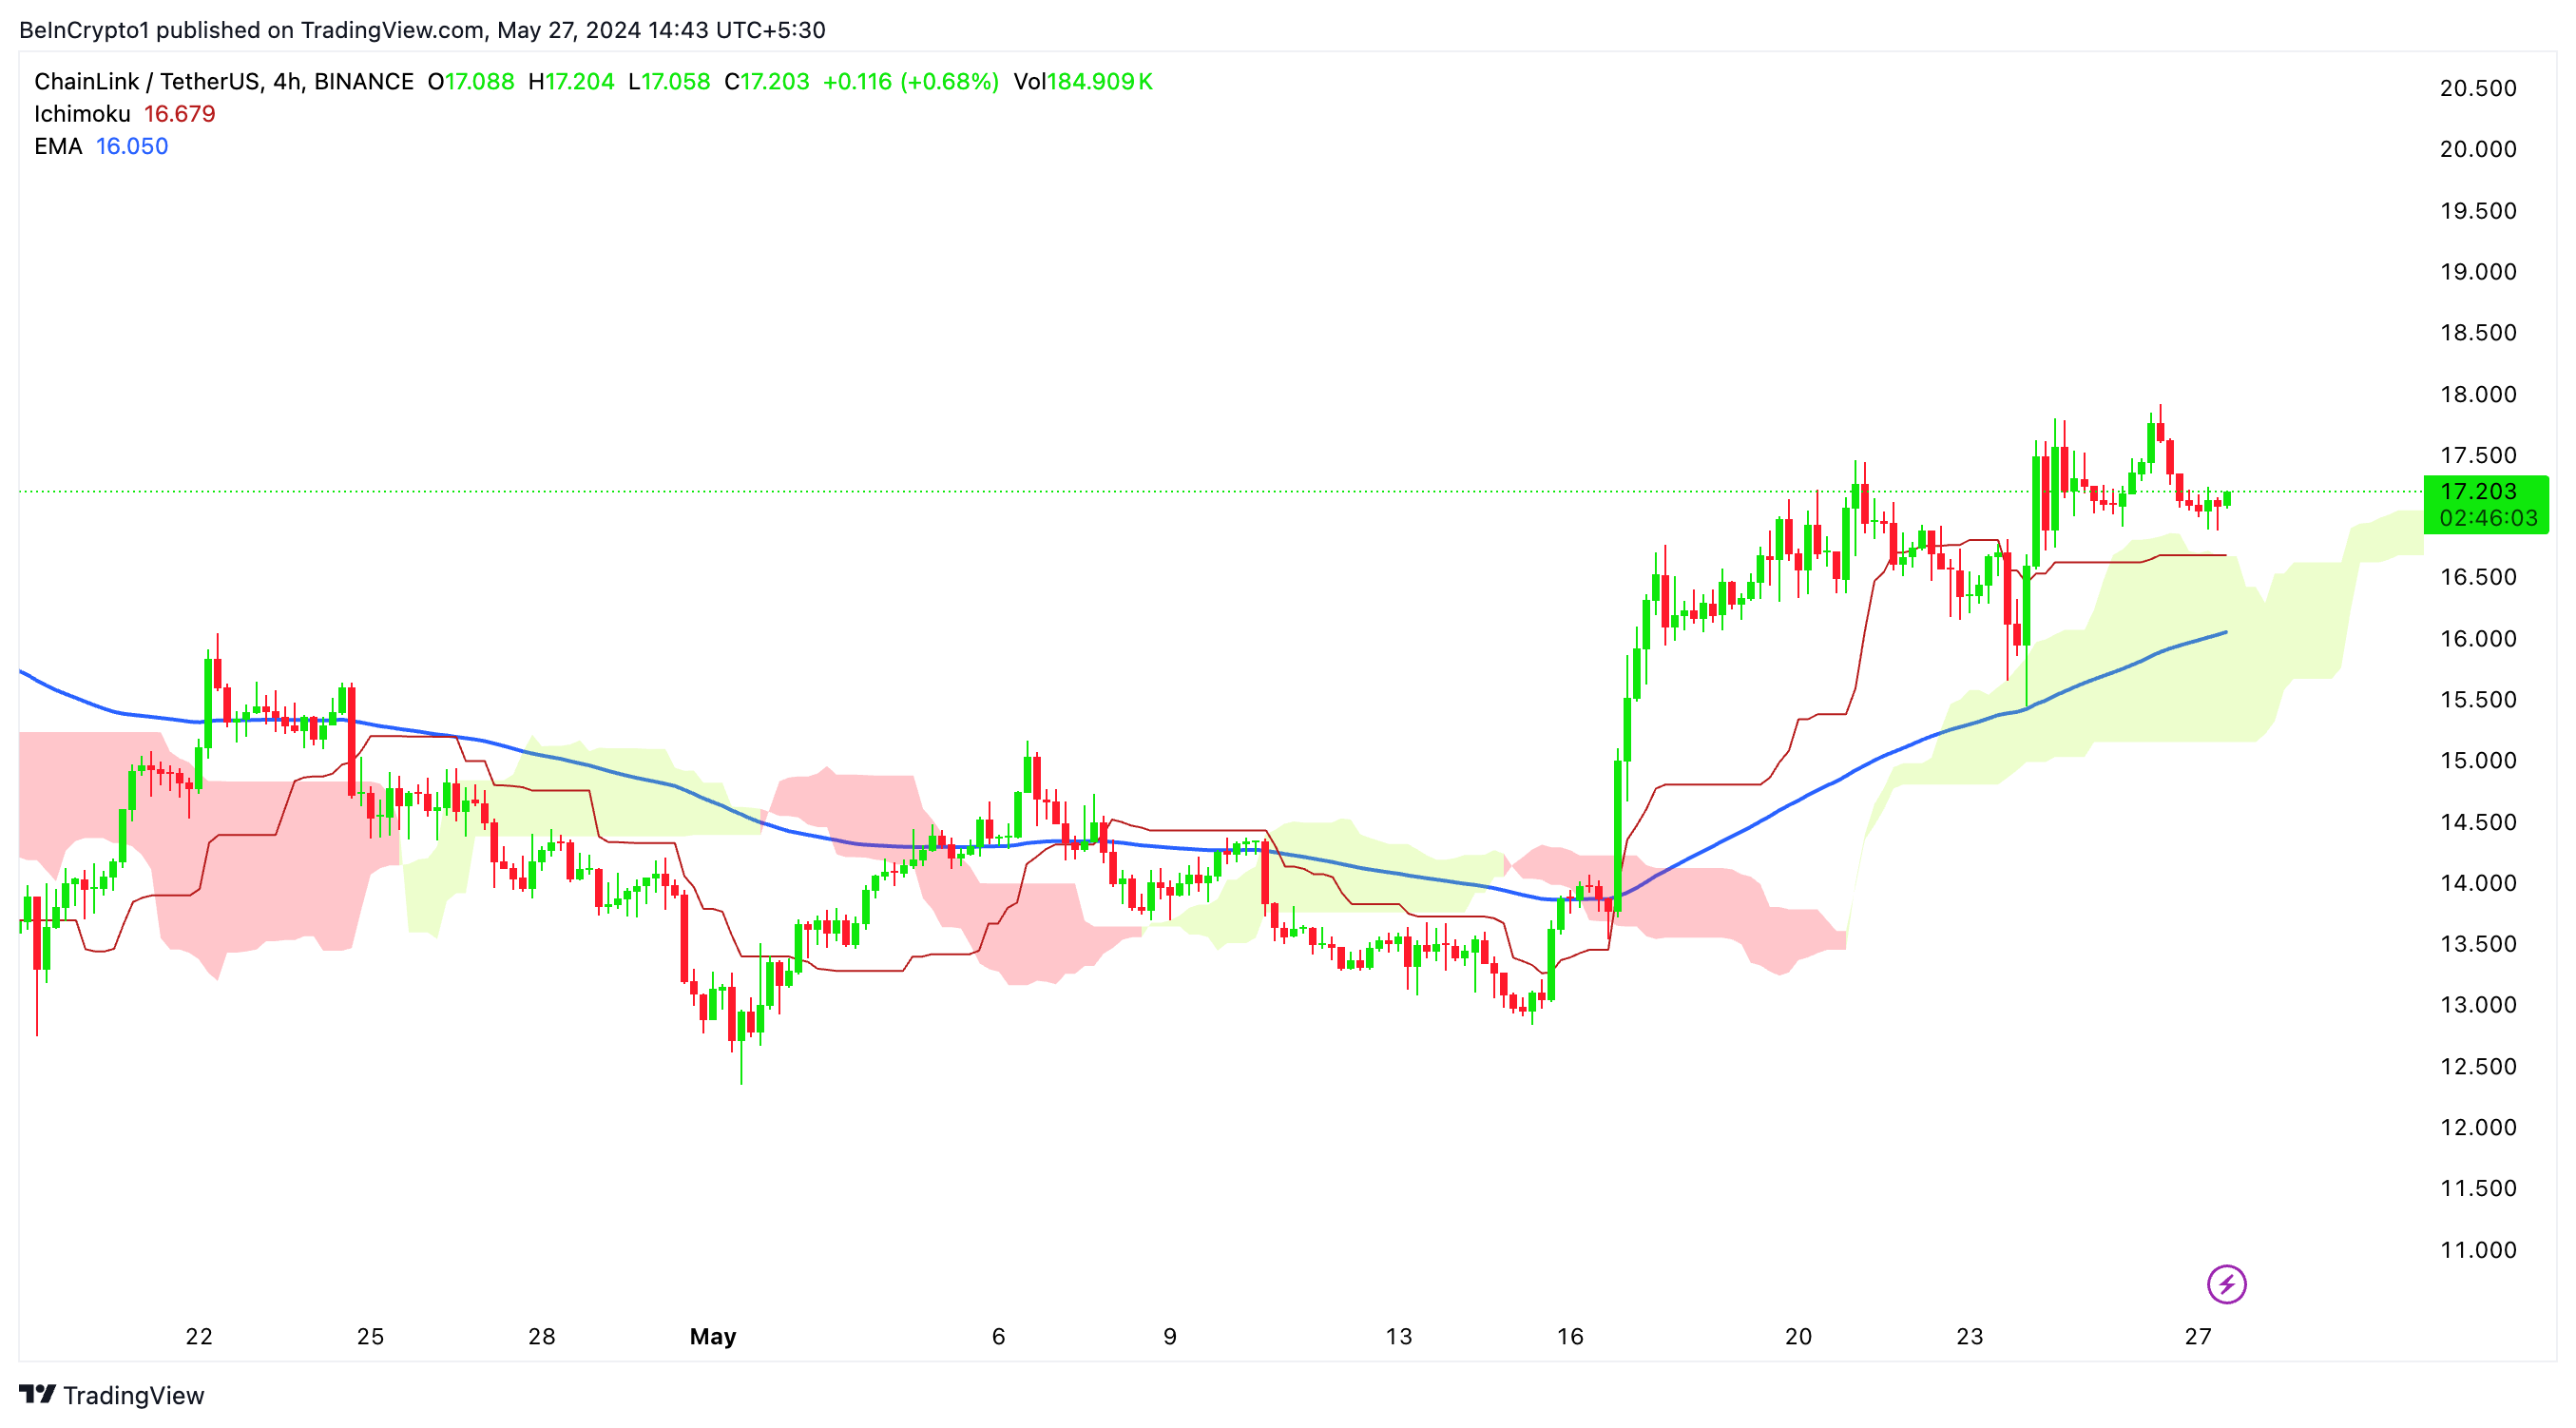
The 100-period EMA (blue line) is at $16.050, acting as a dynamic support level. LINK has consistently traded above this EMA, reinforcing the bullish outlook.
On-Chain Analysis: Historical In/Out of the Money Data
The historical in/out of the money chart indicates the proportion of addresses that are currently in profit (green), at break-even (white), and at a loss (red) based on the current price of Chainlink.
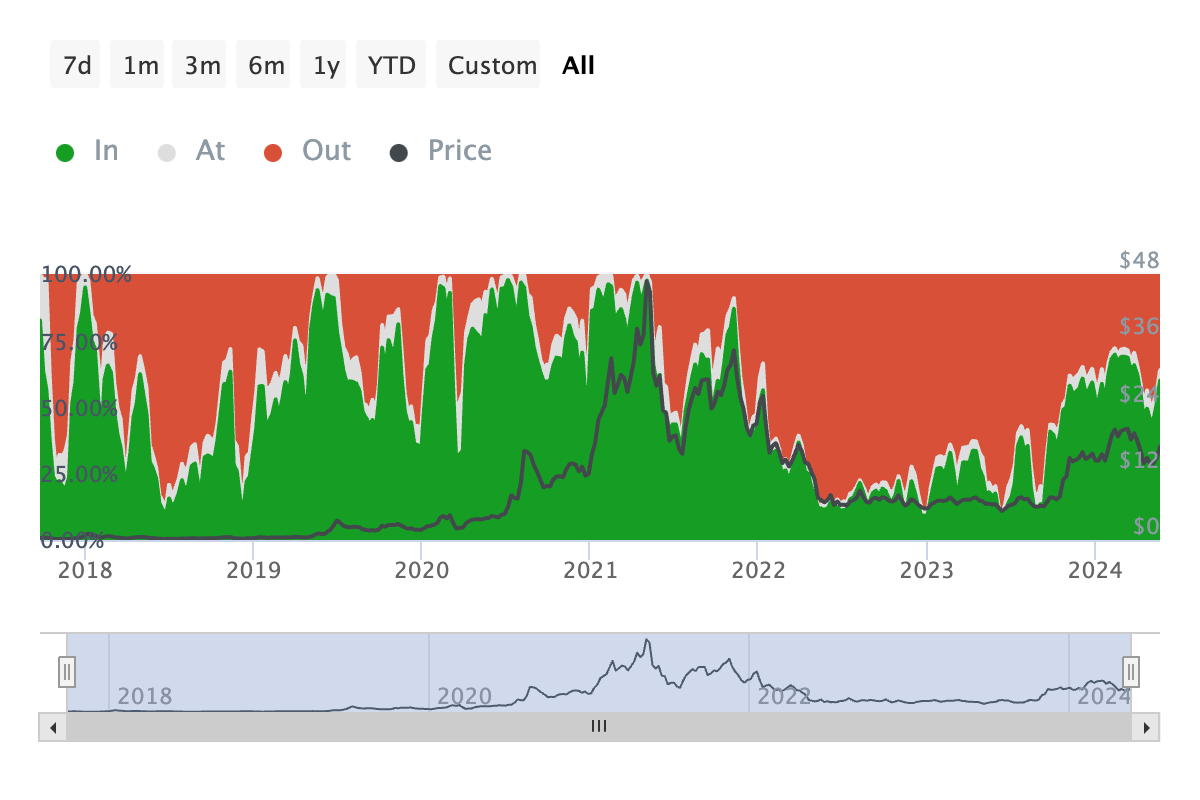
The chart shows a significant proportion (70%) of addresses are currently in the money (green), suggesting a strong holding sentiment among investors. This is bullish as it indicates that most holders are in profit, reducing the selling pressure.
Historically, periods with a high percentage of in-the-money addresses have coincided with bullish trends in LINK’s price.
Strategic Recommendations: Bullish Outlook for LINK to $18.70
Maintain Current Positions: Given the strong bullish signals from the Ichimoku Cloud breakout and support from the 100-day EMA, it is recommended to maintain current long positions. LINK’s price staying above these critical levels indicates sustained buying pressure and positive momentum.
Watch Key Resistance Levels: The immediate resistance level to monitor is $17.41. A successful break and close above this level would likely lead to further upward momentum towards the next target of $18.70. Set alerts to notify of significant price movements above this resistance.
Monitor Support Levels: Key support levels to watch are at $16.021 (100-day EMA) and $15.378 (lower boundary of the Ichimoku Cloud). Maintaining these support levels is crucial for sustaining the bullish trend. Consider these levels as potential entry points for adding to positions if the price retraces.


