Chainlink (LINK) is trading above a crucial horizontal level. Whether it breaks down from here or continues to bounce back could determine the direction of the longer-term trend.
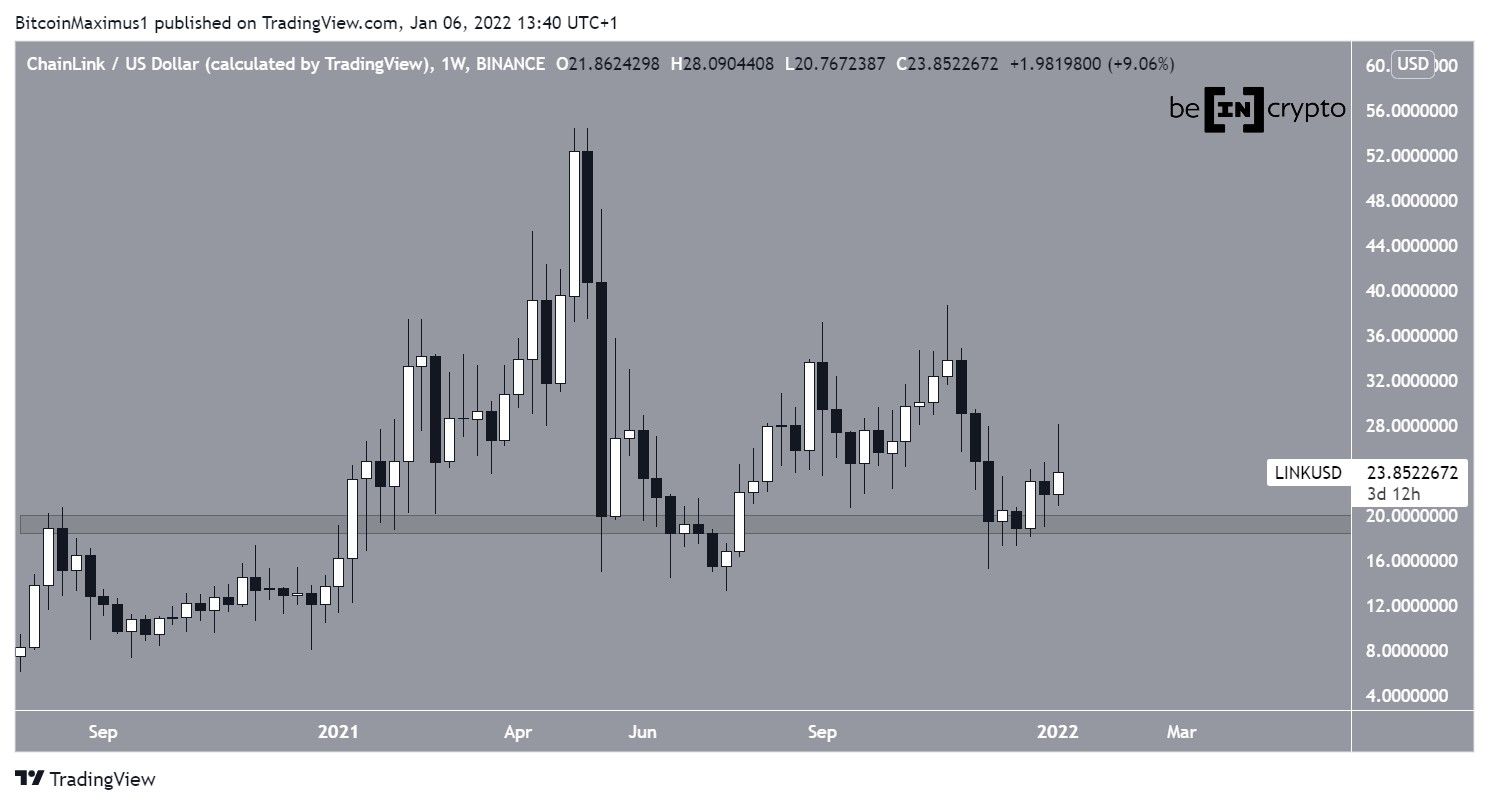
On Dec 4, LINK bounced after reaching a low of $15. The bounce was crucial since it created a higher low relative to the price in July.
Furthermore, it validated the $19.20 area as support.
This is a crucial area because LINK has been trading above it since the beginning of 2021, with the exception of the deviation (red circle) in July.
Therefore, a breakdown below this support could mean that it’s mired in a longer-term correction.
Current pattern
Lower time frames provide a mixed reading.
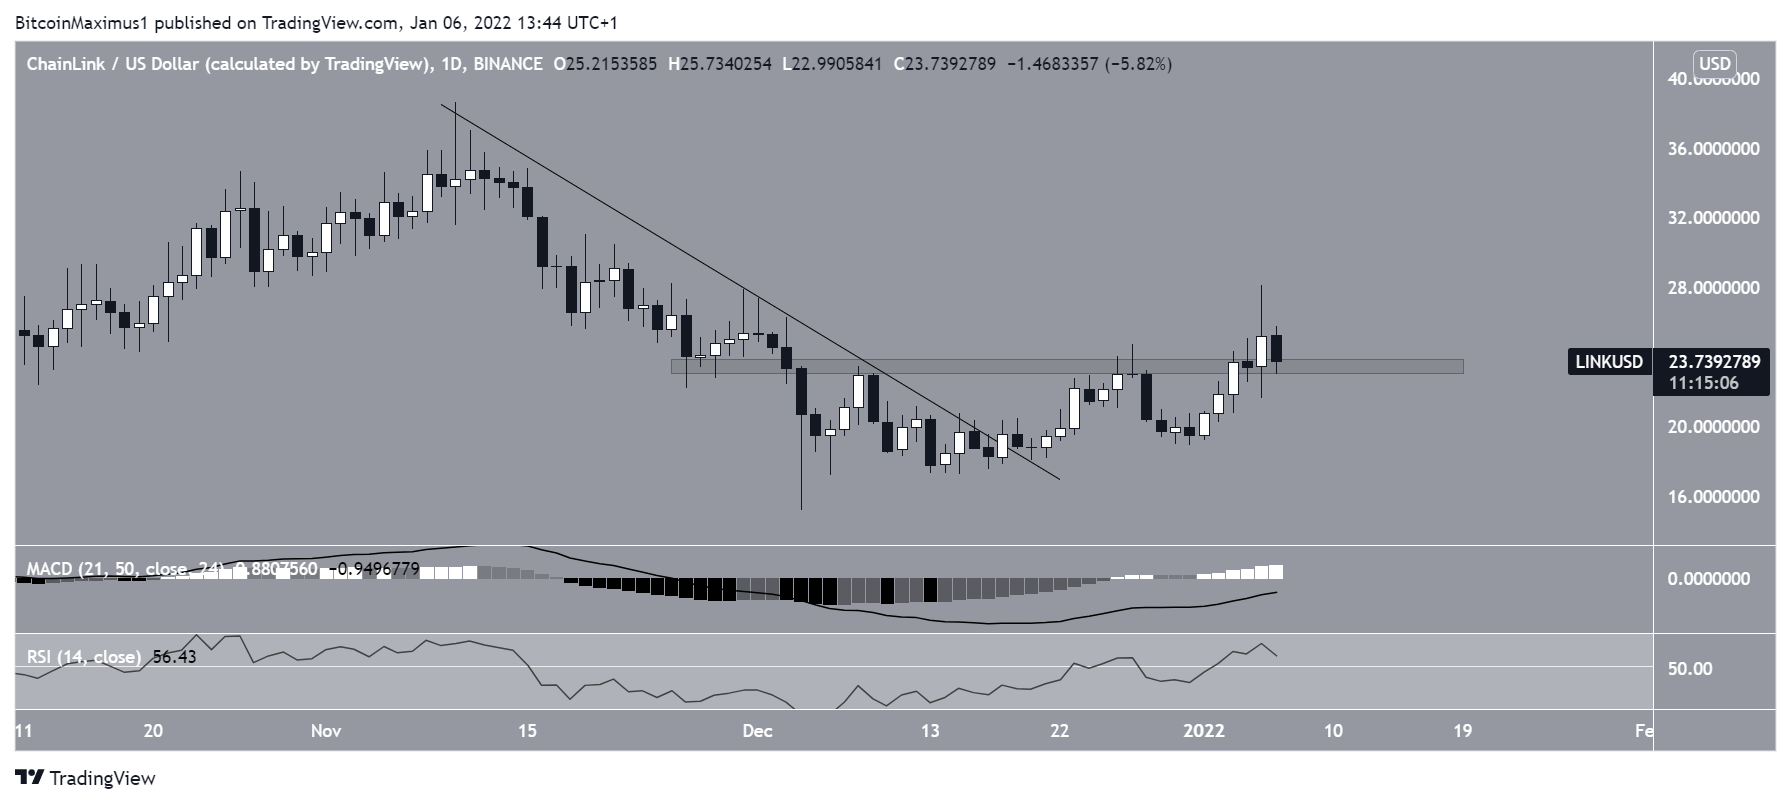
Technical indicators in the daily time frame are mostly bullish since both the MACD and RSI are increasing. The latter is above 50, which is often considered a sign of bullish trends, while the former is nearly positive.
Furthermore, LINK has broken out from a descending resistance line and reclaimed the $23 horizontal area after.
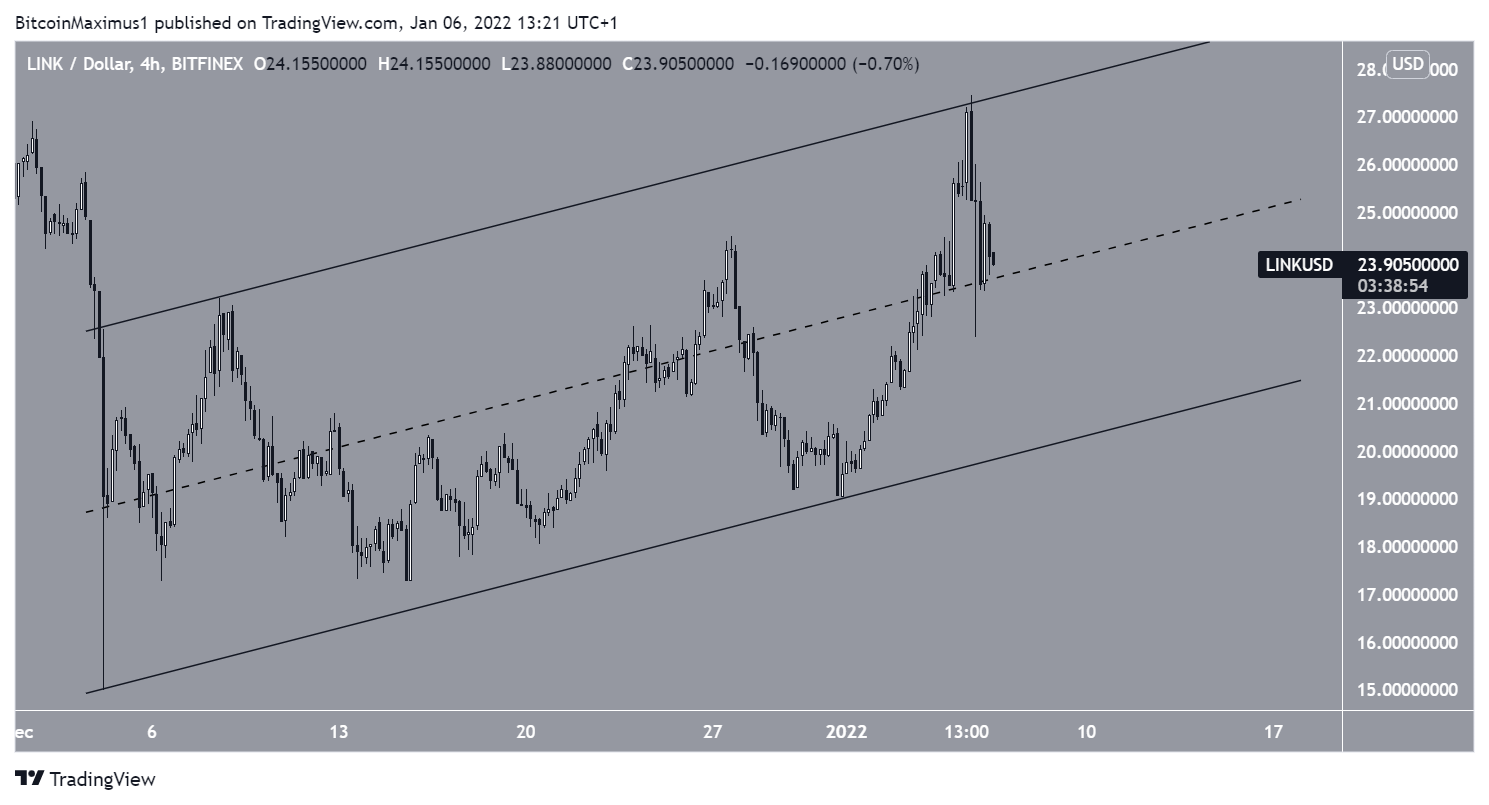
The four-hour chart, on the other hand, shows that LINK has been trading inside an ascending parallel channel since its Dec 4 lows. This type of channel is normally considered a corrective pattern, meaning that an eventual breakdown from it would be expected.
Currently, LINK is trading just above the midline of this channel (green circle). A decrease below the midline would confirm that the trend is bearish and mean that an eventual breakdown is likely.
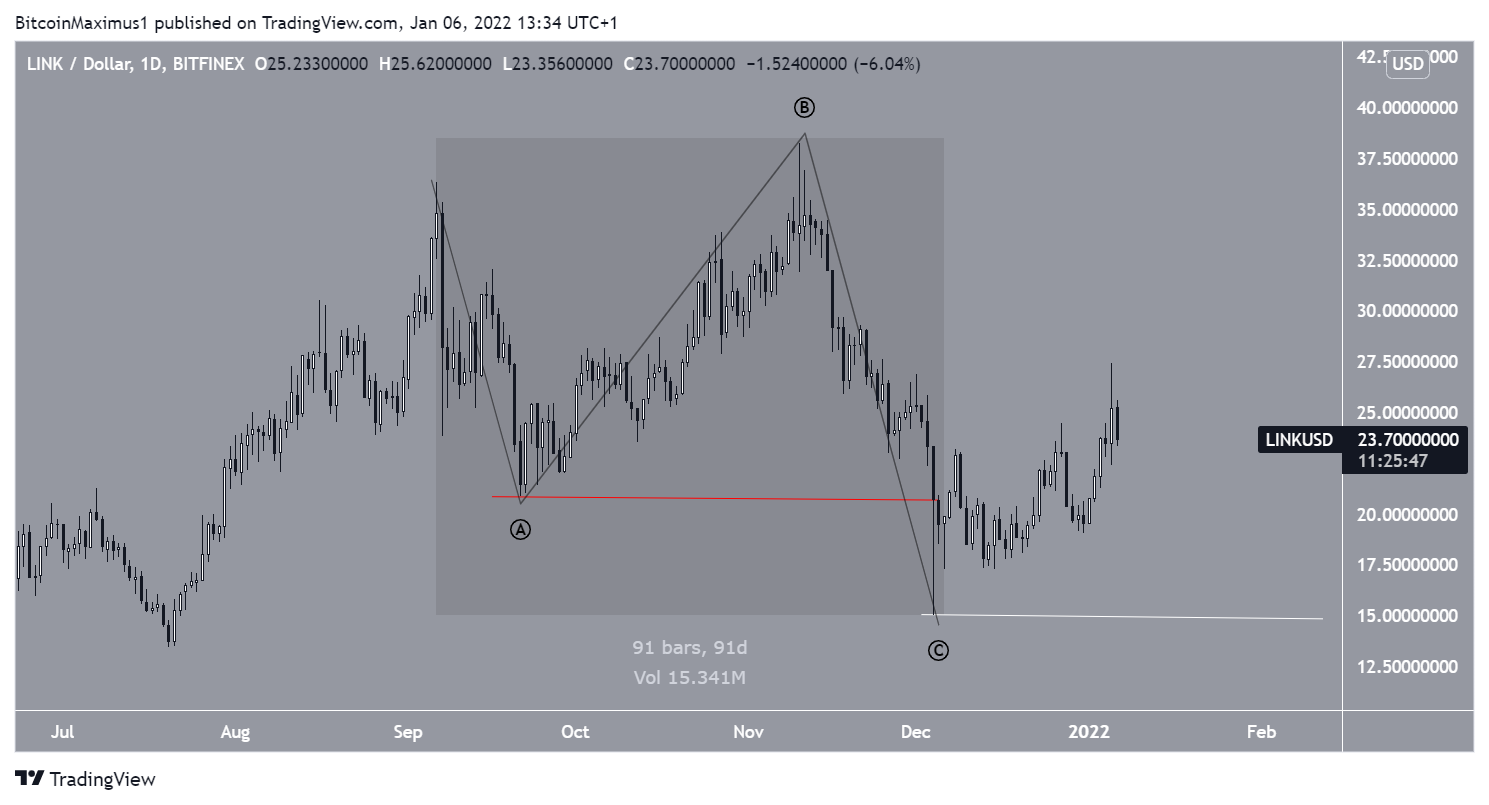
LINK wave count
Cryptocurrency trader @Altstreetbet tweeted a LINK chart, stating that it’s likely completed a corrective phase and will now target higher resistance levels.
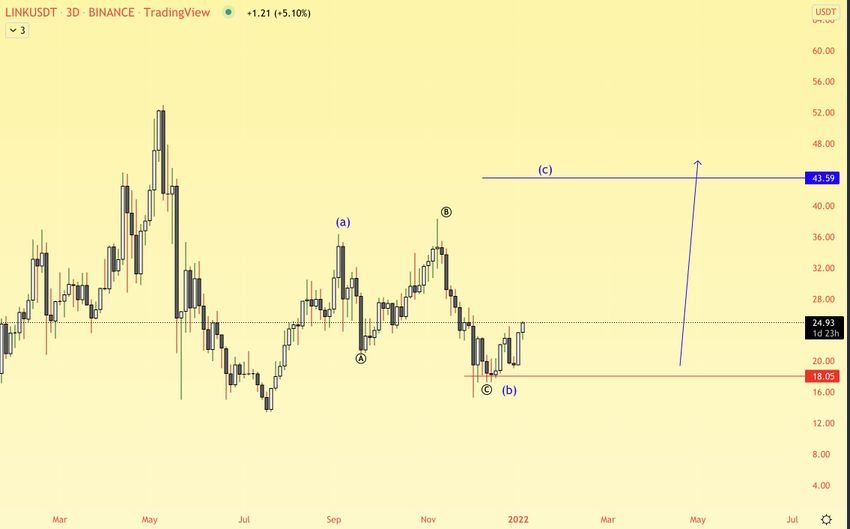
The movement since Sept 6 (highlighted) resembles a completed A-B-C corrective structure. This is especially likely because of the overlap between the current high and Sept 21 lows (red line). If true, LINK could increase toward the $40 level.
However, in order for this possibility to remain valid, LINK has to stay above its Dec 4 lows (white line) of $15.
Due to the bearish readings from lower time frames, this possibility is now becoming less likely.