


Ethereum Name Service (ENS) is consolidating inside a symmetrical triangle above the $13.10 horizontal support area. An eventual breakout from the triangle is possible.
ENS is a distributed naming system based on the Ethereum blockchain. It converts addresses like test.eth to alphanumeric codes that are machine-readable. Its goal is to make the Ethereum-based web easier to access.
The performance of the ENS network over the past seven days has been strong. In comparison with the non-fungible token (NFT) market, it is leading in terms of seven-day volume with 9,907.7 ETH. This is higher than both Bored Apes and CryptoPunks. As a result, ENS now holds 13% of the total market share.
Additionally, ENS is currently averaging roughly 2,500 daily active users. The numbers have been slightly above 2,500 since July, while they were close to 2,000 throughout 2021 and the first part of 2022.
While the price has also been increasing over the past seven days, it initiated a downward movement on Sept. 27, which has resumed the next day.
ENS risks breaking down
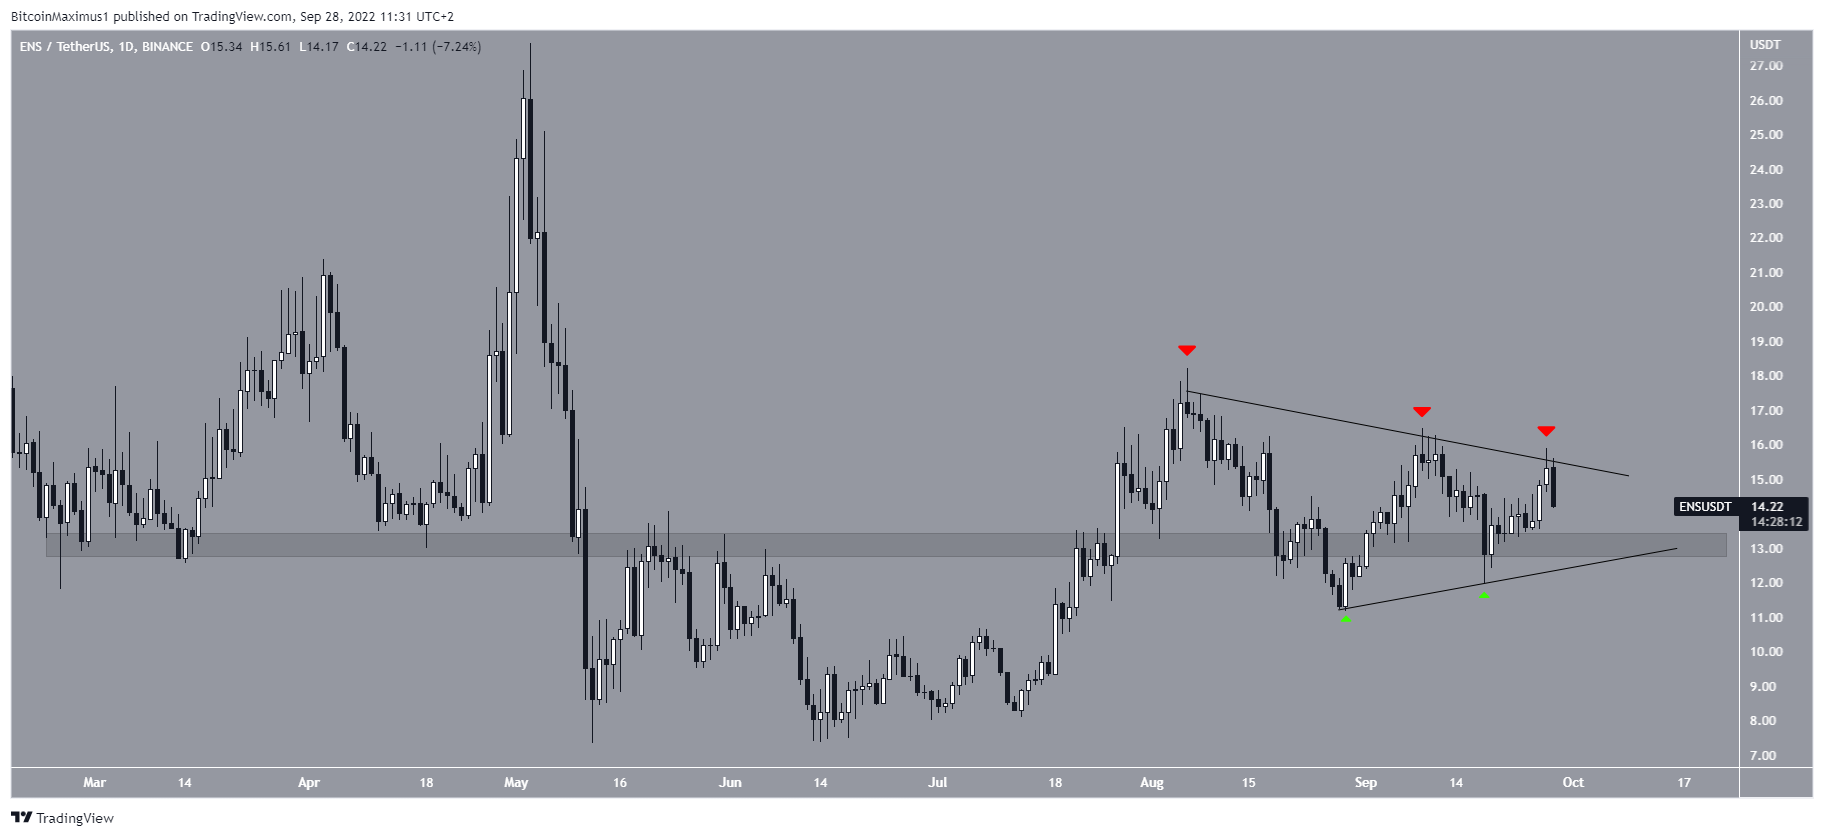
ENS has fallen by 9% so far today, increasing fears of a potential breakdown. Since Aug. 9, it has created three lower highs (red icons) which in turn have created a descending resistance line. Additionally, it is possible that ENS is following an ascending support line, which would create a symmetrical triangle pattern.
However, the line has not been validated sufficient times yet. Since the line also coincides with the $13.10 horizontal support area, there is a strong confluence of support levels at $13.10. As a result, a potential breakdown below the line and area could greatly accelerate the rate of decrease.
What’s on the horizon?
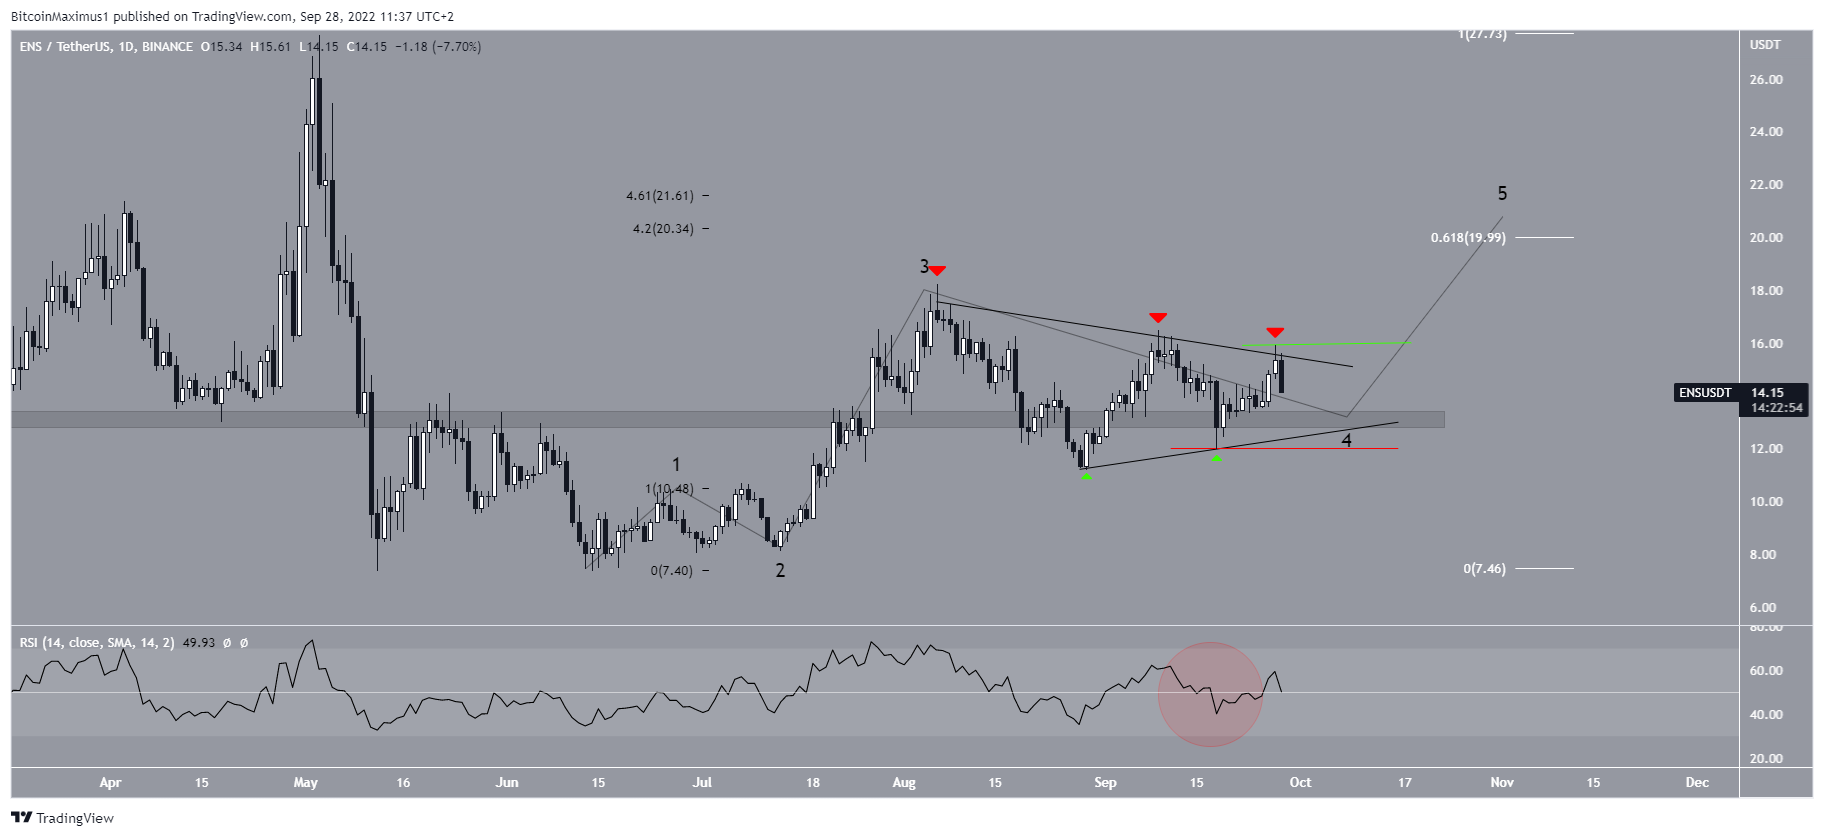
As for the future movement, the wave count suggests that a breakout from the triangle is the most likely scenario. The reason for this is that triangles are usually part of wave fours, and the current pattern is developing after an upward movement. This possibility however is not supported by the RSI, which provides a neutral reading (red circle).
If a breakout occurs, the most likely area for the top of the movement would be between $20 and $21.61. The area is found using the 0.618 Fib retracement resistance level of the previous decrease (white) and the 4.2-4.61 extension of wave one.
An increase above the $15.90 high (green line) would confirm this count while a fall below $11.97 (red line) would invalidate it.
For Be[In]Crypto’s latest Bitcoin (BTC) analysis, click here


