


Bitcoin (BTC) created a bearish engulfing candlestick on July 5 but did not break down the following day.
It’s trading inside a longer-term range and a shorter-term symmetrical triangle.
BTC trading range
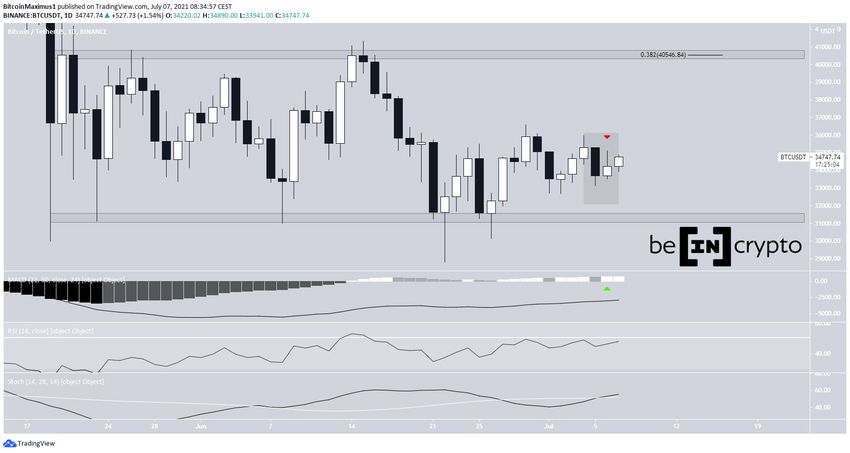
BTC created a bearish engulfing candlestick on July 5. The next day, it attempted to initiate an upward move but only left a long upper wick in place (red icon).
However, the MACD did not give a bearish reversal signal, creating a higher momentum bar instead. In addition, the Stochastic oscillator made a bullish cross.
The closest support and resistance levels are found at $32,000 and $40,550.
Short-term consolidation
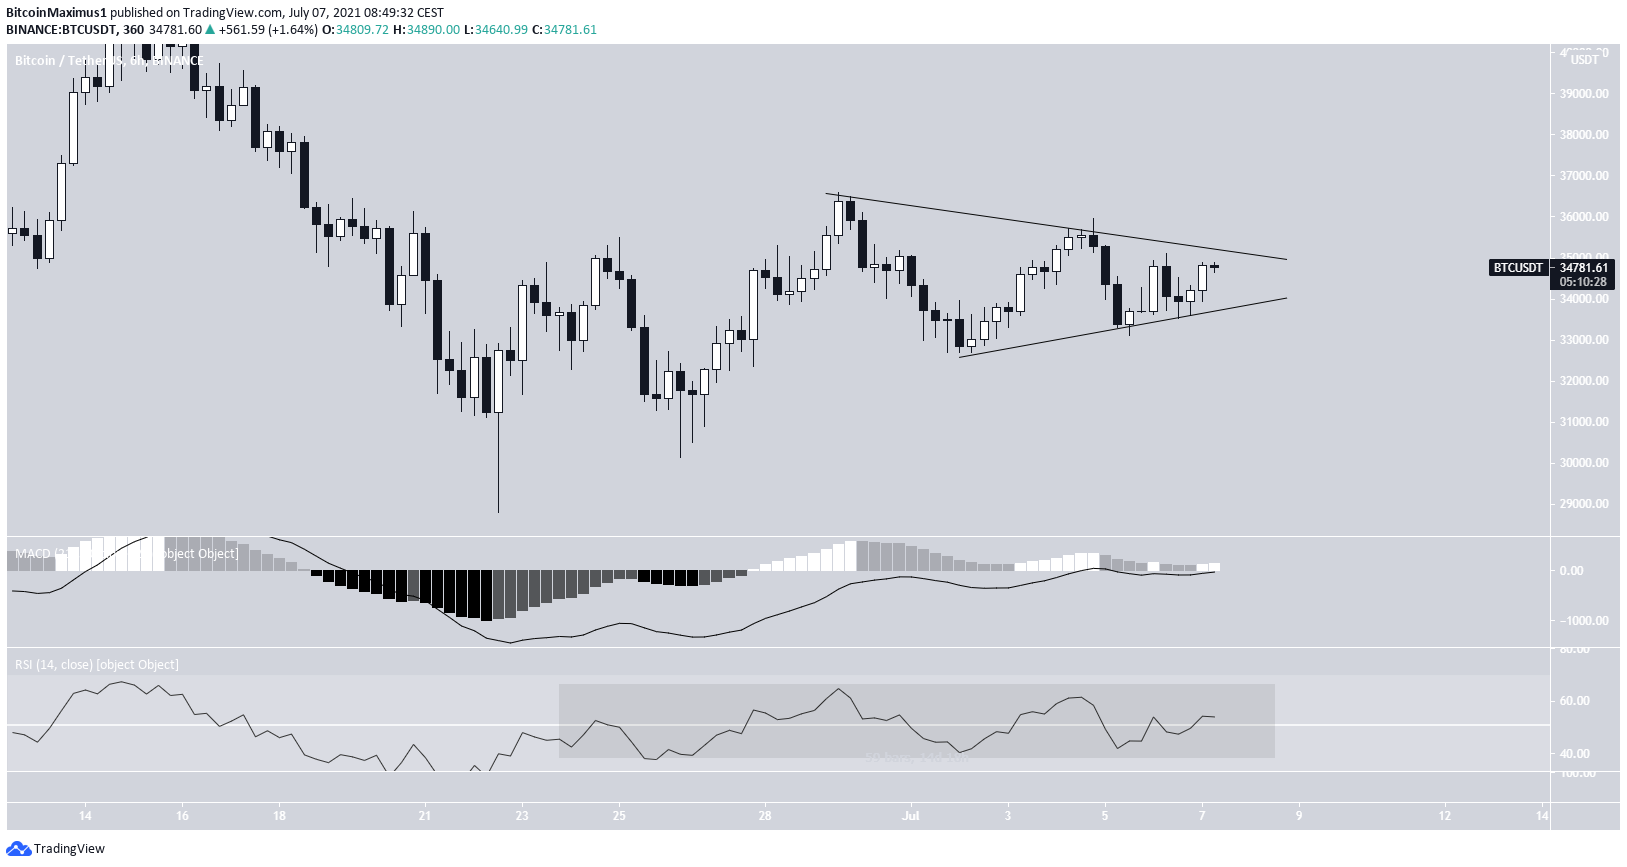
The six-hour chart is similarly undecided.
It’s possible that BTC is trading inside a symmetrical triangle, though the resistance line of the channel has not been validated enough times.
The symmetrical triangle is normally considered a neutral pattern.
Technical indicators are also undecided. The MACD is at the 0-line while the RSI is freely moving above and below 50, a common sign of an undetermined trend.
Wave count
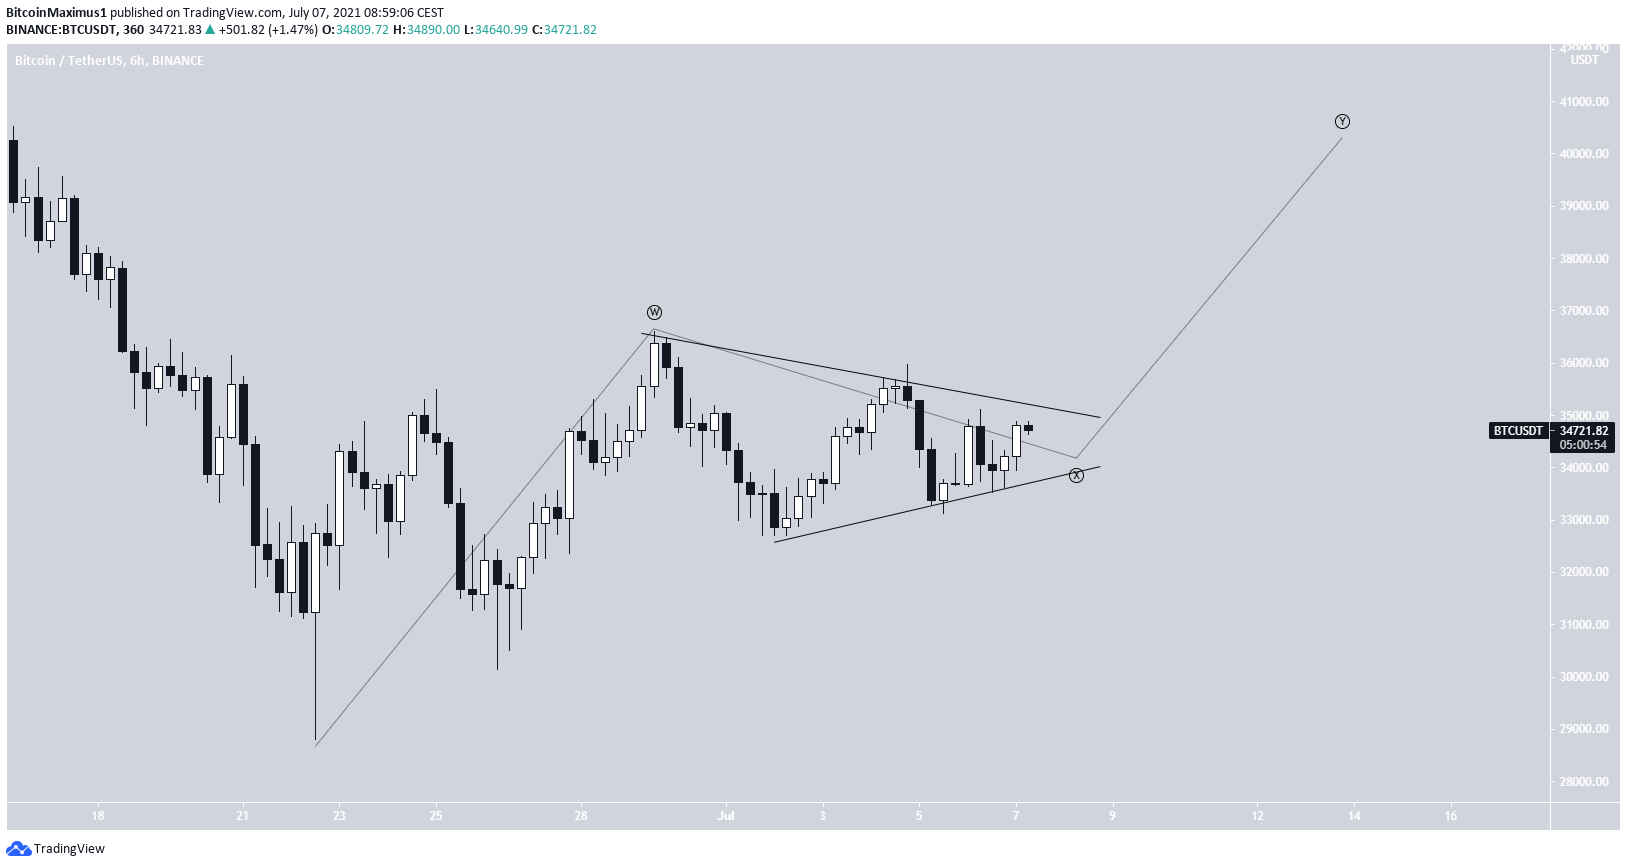
The wave count is currently unclear. Due to the presence of the triangle, it does make sense that the movement is part of the X wave of a complex corrective structure.
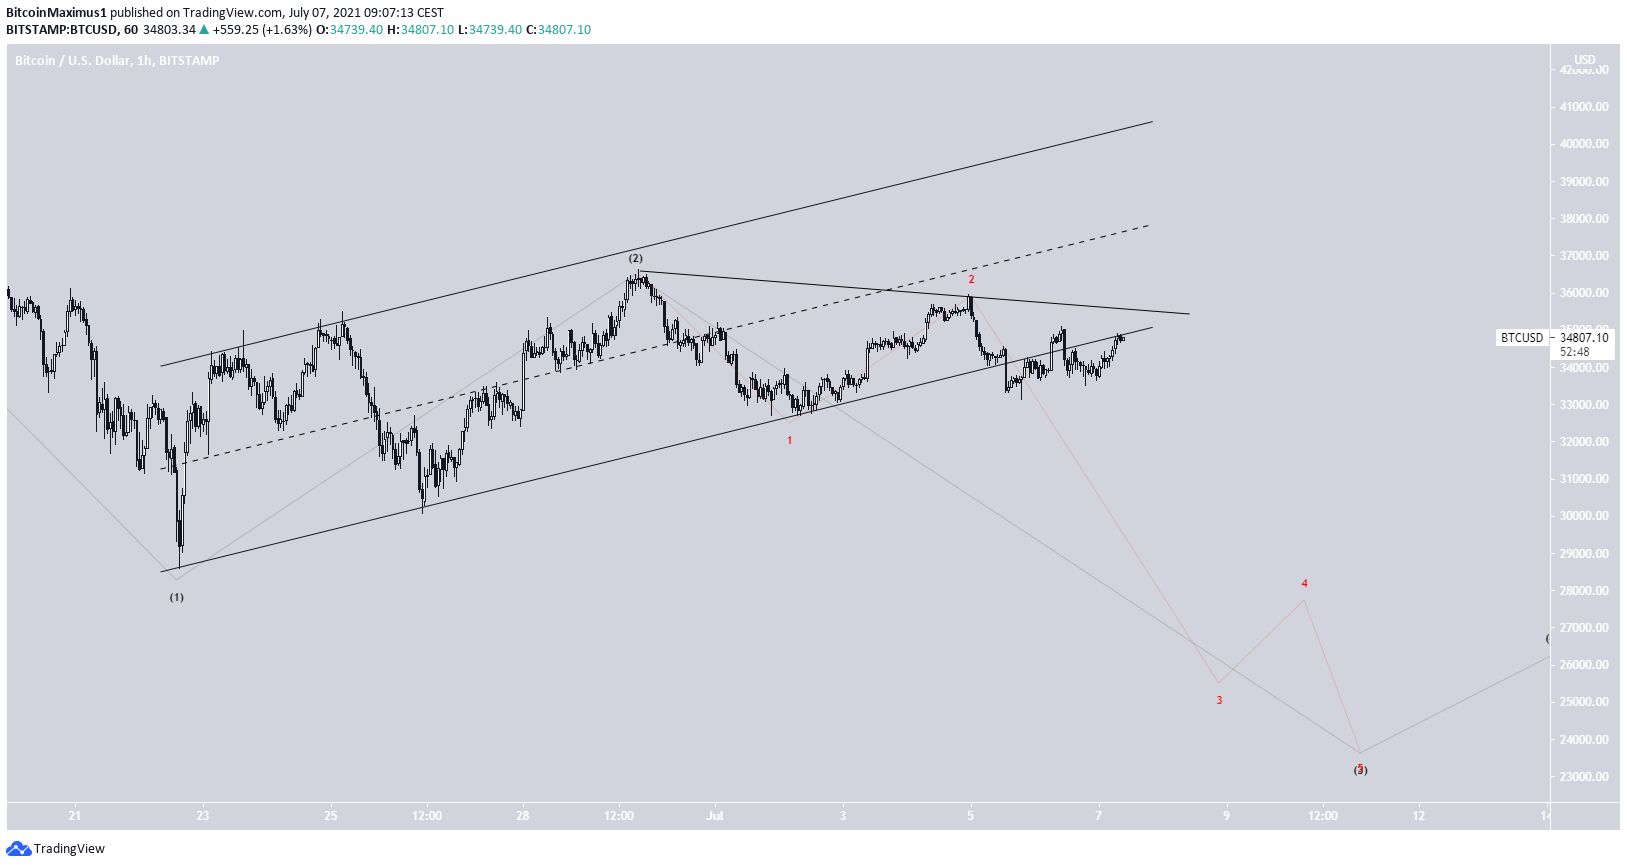
The previously outlined bearish count in which the current movement is a 1-2/1-2 wave structure is becoming less likely. This is due to the failure to initiate a sharp downward movement after the breakdown from the channel.
On the contrary, BTC is in the process of reclaiming the support line of the channel instead.
While it is technically still possible, it would be validated with a breakout from the descending resistance line connecting the highs of wave 2 (black) and sub-wave (red) 2.
For BeInCrypto’s previous bitcoin (BTC) analysis, click here.



