


The majority of cryptocurrencies have been decreasing since Feb. 20-22.
Bitcoin (BTC) has swept its lows and is in the process of increasing towards the closest resistance. Ethereum (ETH) is in the process of validating the previous all-time high level as support.
XRP (XRP) is consolidating inside a range between $0.36 and $0.63. DFI.Money (YFII) has broken down below the $2,460 support area but has bounced at a long-term ascending support line.
OMG Network (OMG) has bounced at an ascending support line and reclaimed the $4.40 resistance area afterward. Bitcoin Cash (BCH) has fallen through the $600 area, and technical indicators have turned bearish.
BZX Protocol (BZRX) has returned to the previous breakout level at $0.38.
Bitcoin (BTC)
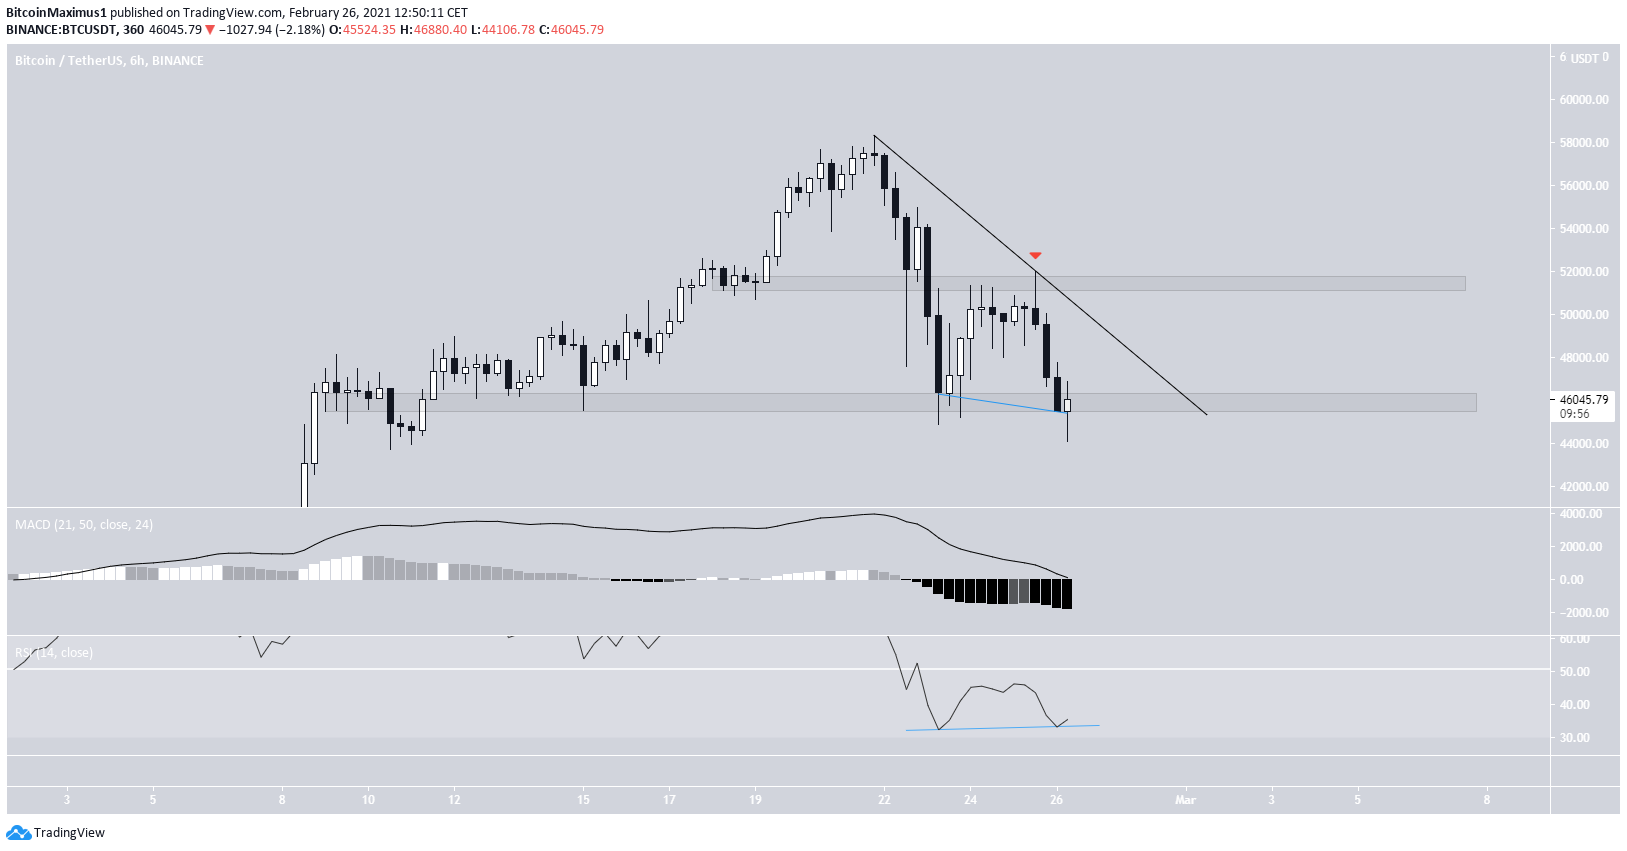
BTC has been decreasing since Feb. 21, when it was trading at an all-time high of $58,351. Throughout the fall, it has been potentially following a descending resistance line that hasn’t yet been validated sufficient times.
BTC has bounced at the $46,000 support area after previously touching the lows. Furthermore, a considerable bullish divergence has developed in the RSI, a sign that the price is heading higher.
BTC is expected to break out above the descending resistance line, increase towards the $51,600 resistance area, and possibly higher.
Ethereum (ETH)
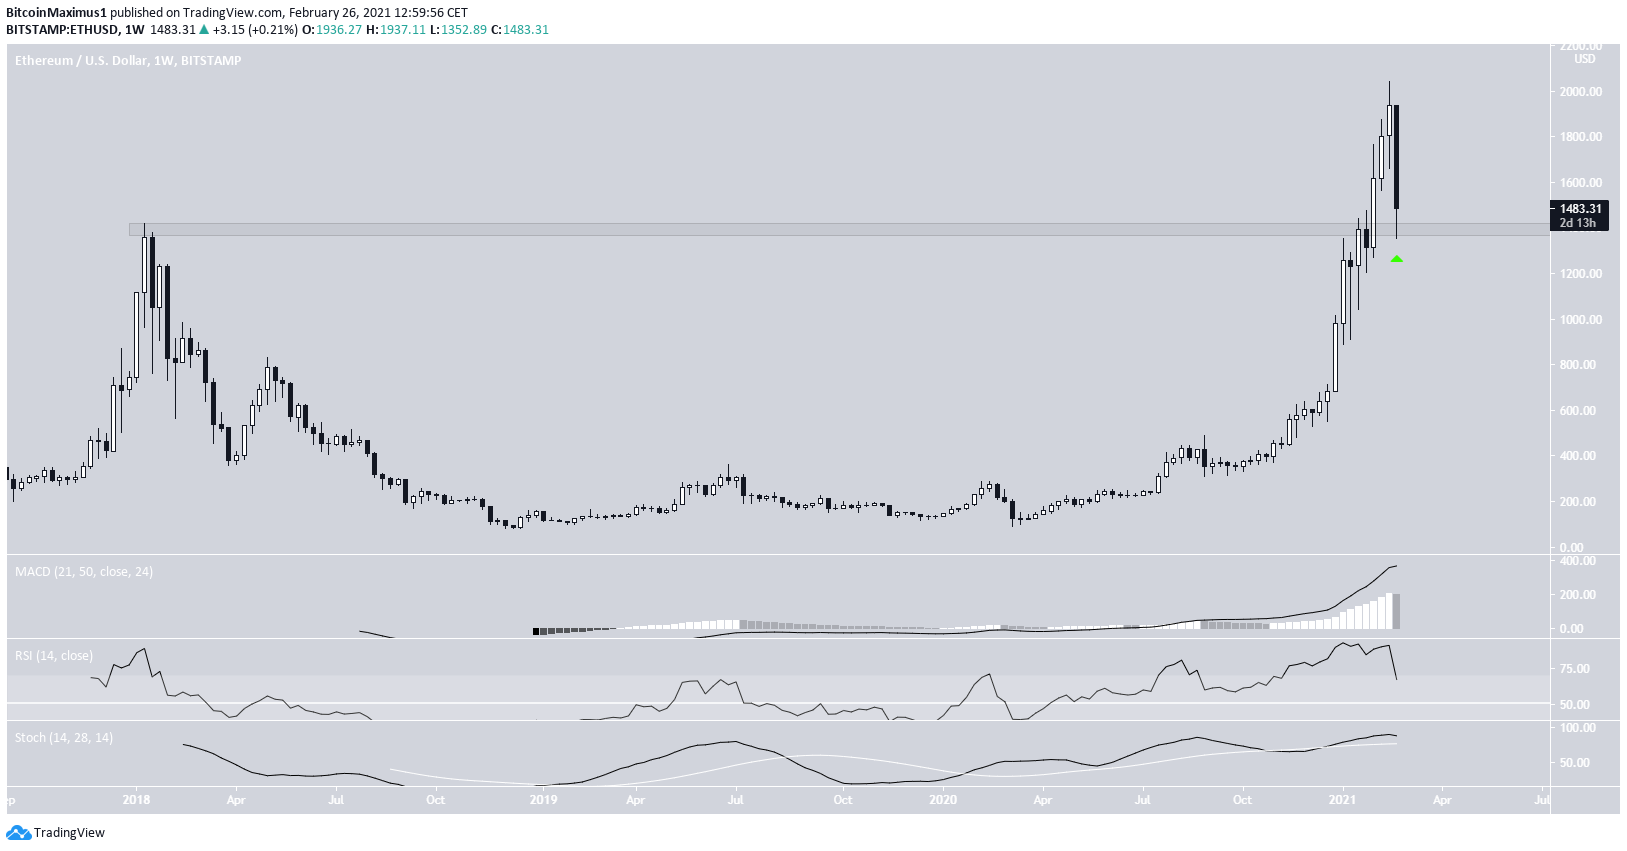
ETH has been decreasing since reaching an all-time high price of $2,042 on Feb. 20. The ongoing decrease has taken it back to the $1,400 level, which previously acted as the all-time high.
ETH has potentially initiated a bounce since reaching this level, making it possible that the decline is just a bullish retest of that level.
Technical indicators do not yet confirm the bearish reversal, so as long as ETH does not reach a close below the $1,400 area, it would likely continue increasing and reach a new all-time high.
XRP (XRP)
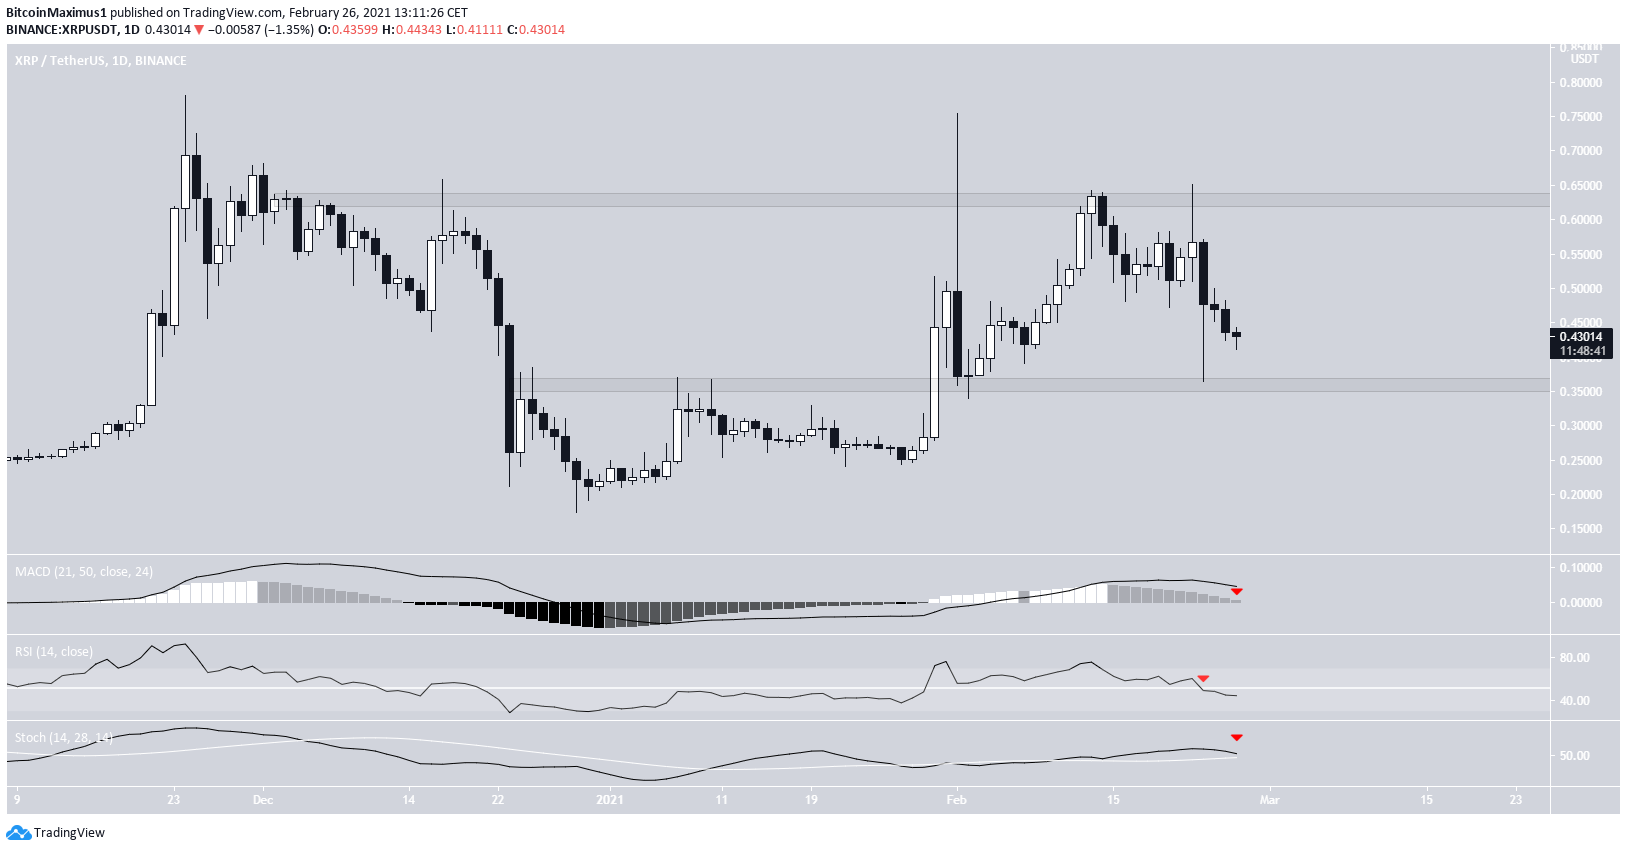
The XRP chart looks dissimilar to BTC and ETH, mostly since it’s not anywhere close to its previous all-time highs.
On the contrary, XRP is trading inside a range between $0.36 and $0.63, being very close to the former.
Technical indicators are bearish. Thus a fall towards the $0.36 is likely, followed by further consolidation inside this range.
DFI. Money (YFII)
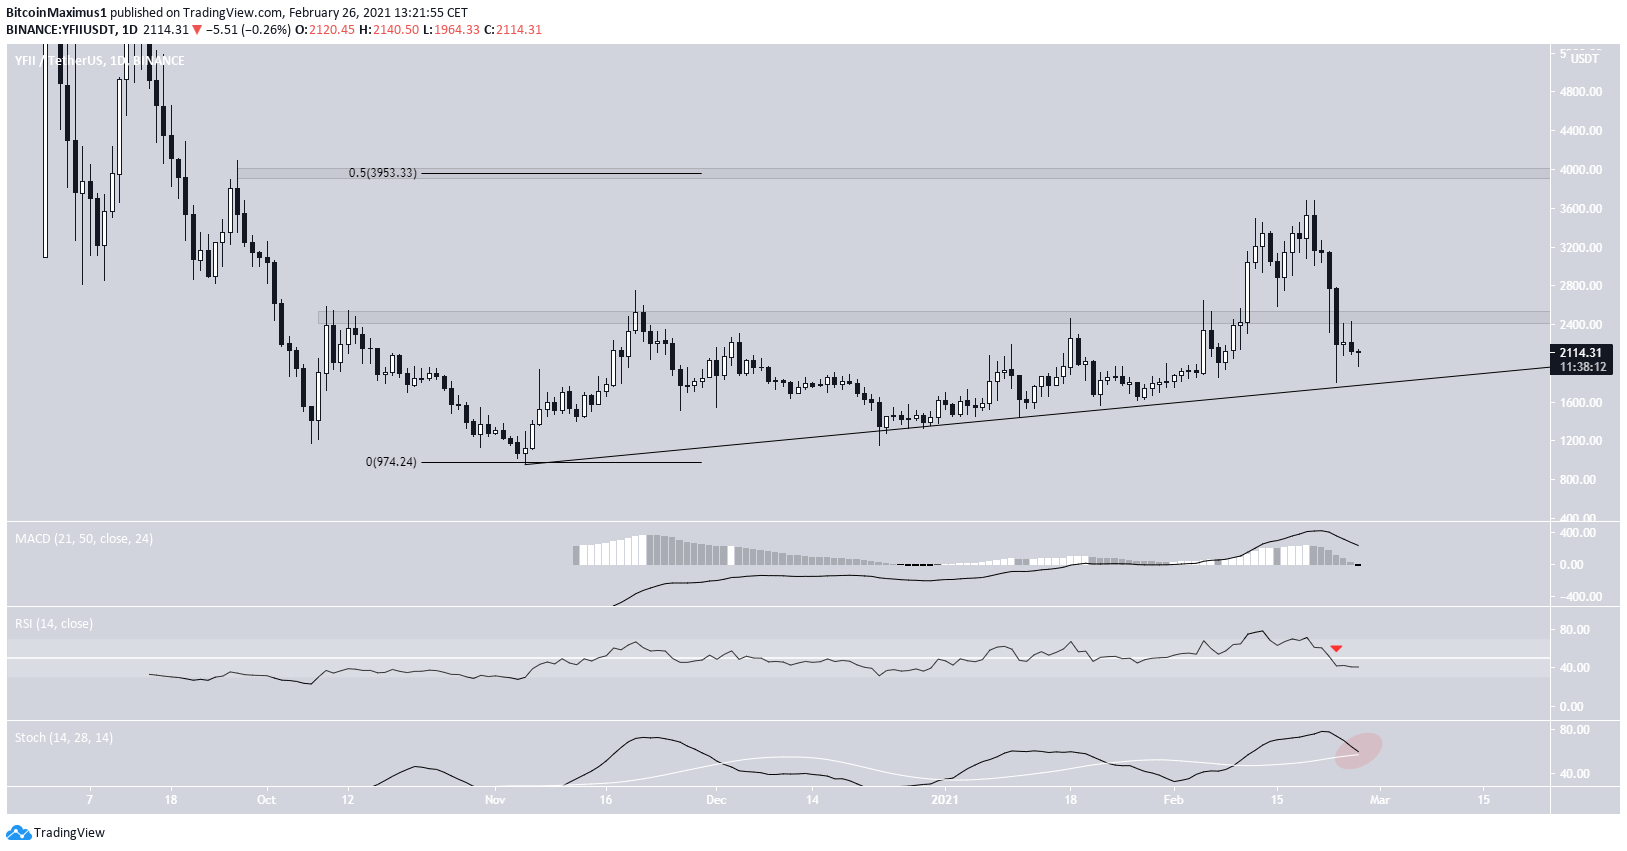
YFII has been decreasing since Feb. 19, when it was trading at a high of $3,682. While the decline took it to a low of $1,807 on Feb. 23, YFII bounced as soon as it touched the long-term ascending support line, which has been in place since Nov. 1, 2020.
Despite the bounce, technical indicators are bearish, and YFII has fallen below the previous resistance at $2,460, which was likely to act as support.
Until YFII manages to reclaim this area, we cannot consider the trend bullish, despite YFII being above the ascending support line.
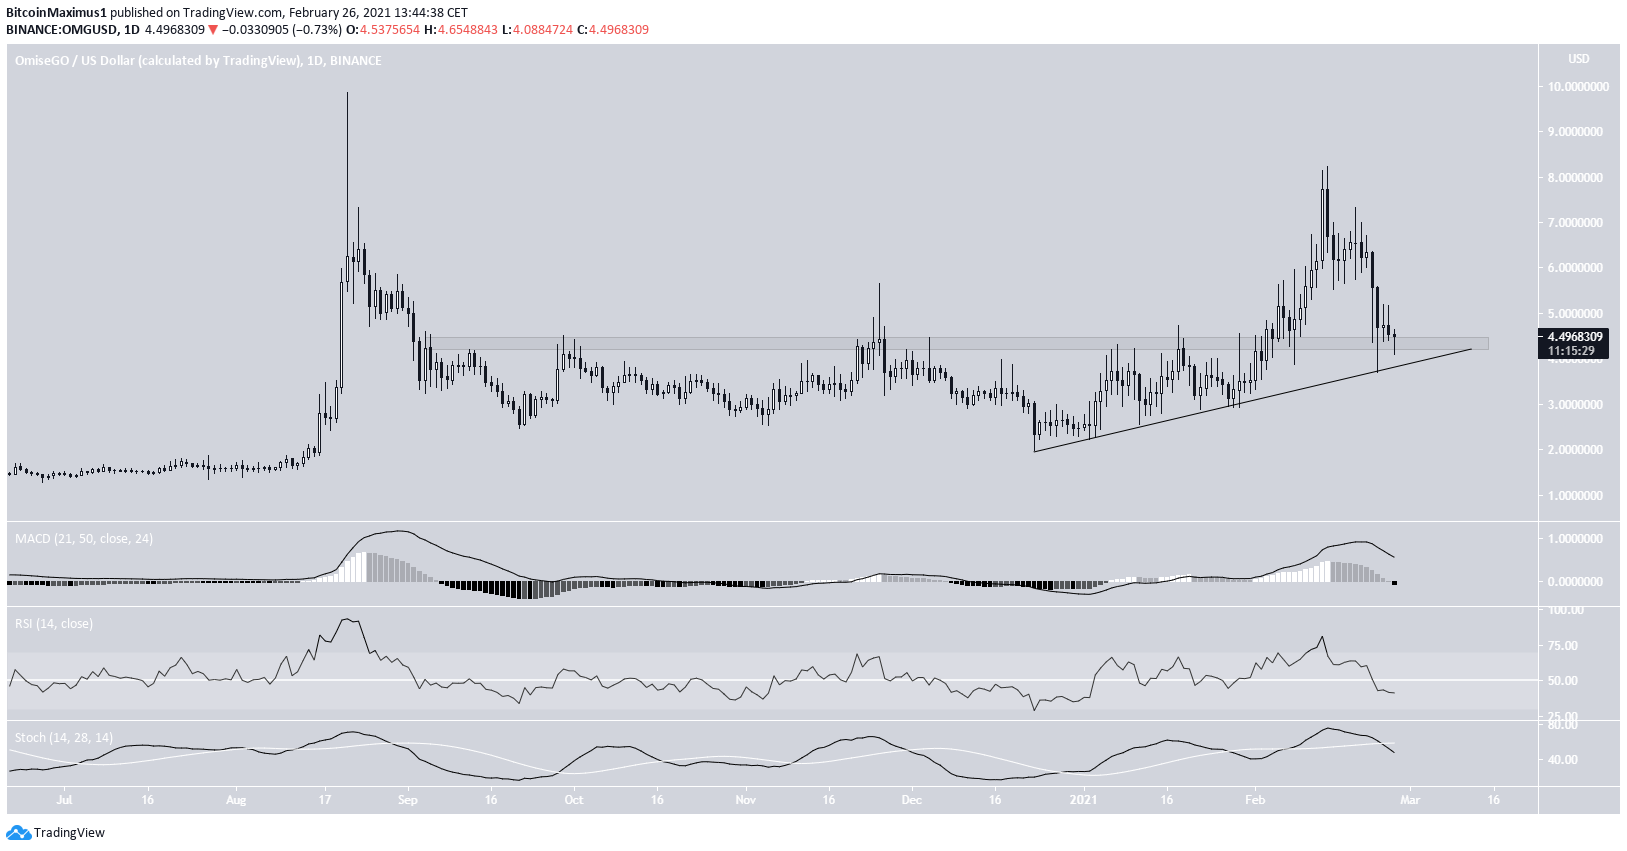
OMG Network (OMG)
OMG has been decreasing since Feb. 14, when it reached a high of $8.22. The decline has taken it to a low of $3.69, where it bounced on an ascending support line.
Despite technical indicators being bearish, OMG has reclaimed the $4.40 area, which previously acted as resistance, likely validating it as support.
As long as OMG is trading above this support line and area, the trend is bullish.
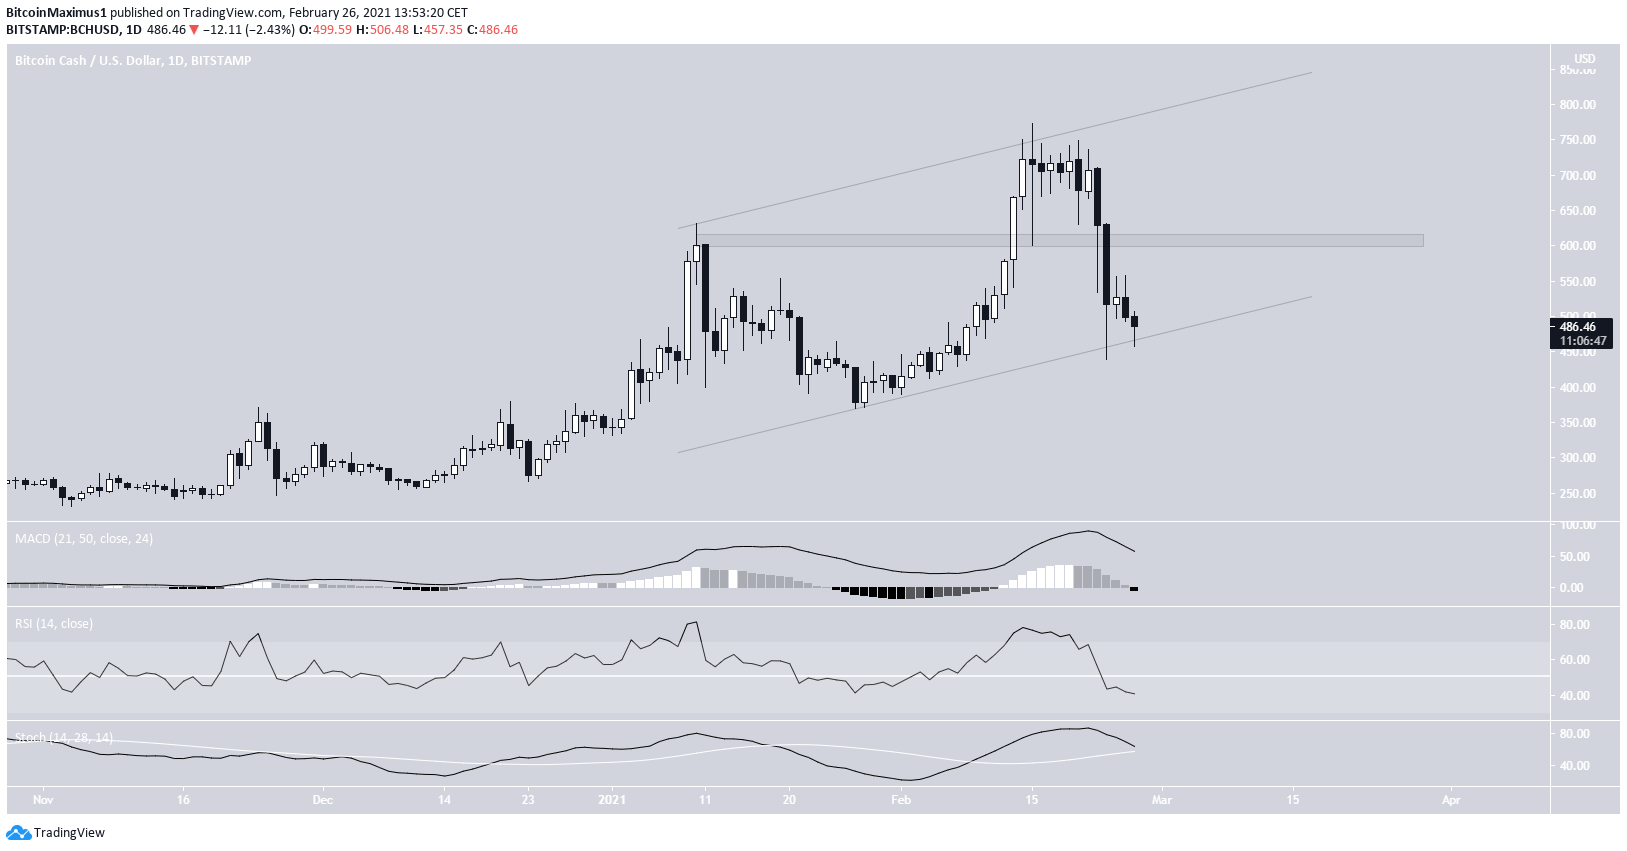
Bitcoin Cash (BCH)
BCH has been decreasing since reaching a high of $773 on Feb. 15. The fall has taken it to a low of $433 on Feb. 23.
BCH made a low right at the support line of a parallel channel, which possibly means this is a running flat correction.
Nevertheless, technical indicators are bearish, and until BCH manages to clear the $600 resistance area, the trend remains bearish.
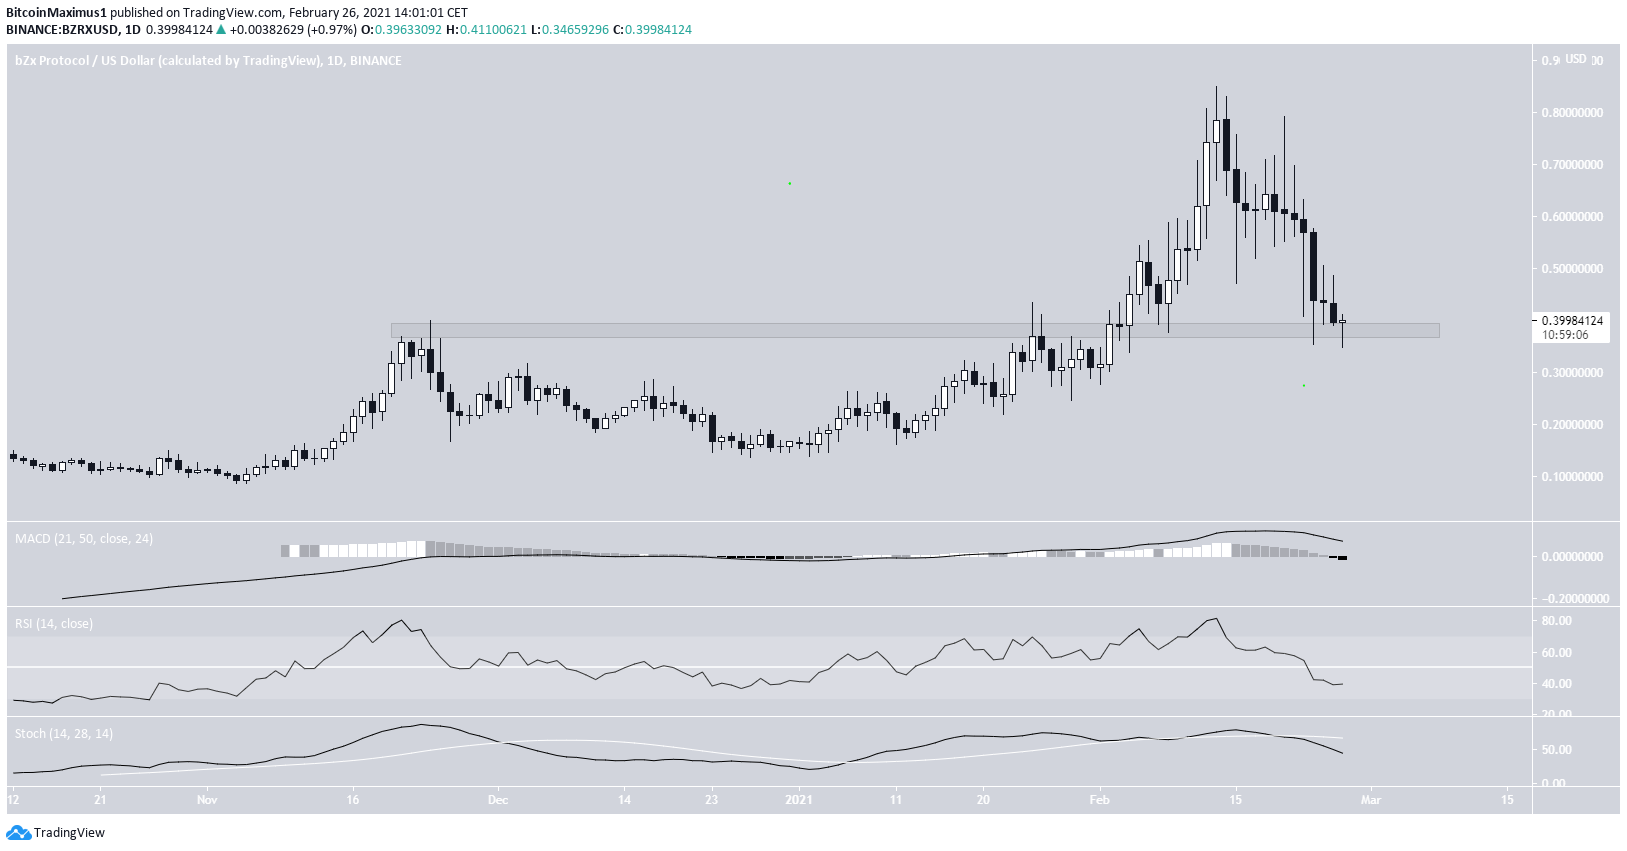
BZX Protocol (BZRX)
BZRX has been decreasing since reaching a high of $0.85 on Feb. 13. So far, the drop has taken BZRX to a low of $0.346 on Feb. 26.
BZRX has bounced since, currently trading inside the $0.38 area, the previous resistance area from which BZRX broke out at the beginning of February.
Therefore, despite technical indicators being bearish, as long as BZRX is trading above this area, the trend is bullish.
For BeInCrypto’s latest Bitcoin (BTC) analysis, click here.


