


Bitcoin (BTC) has reached the $40,550 resistance area but failed to break out.
Ethereum (ETH) has broken out from a descending resistance line after creating a double bottom pattern.
XRP (XRP) and ICON (ICX) have also created double bottom patterns but have failed to initiate an upward move.
Monero (XMR) has broken out from a descending resistance line after deviating below the $192 horizontal support area.
Kava.io (KAVA) is attempting to break out above the $5.17 resistance area.
NEM (XEM) has created a higher low and reclaimed the $0.135 horizontal support area.
BTC
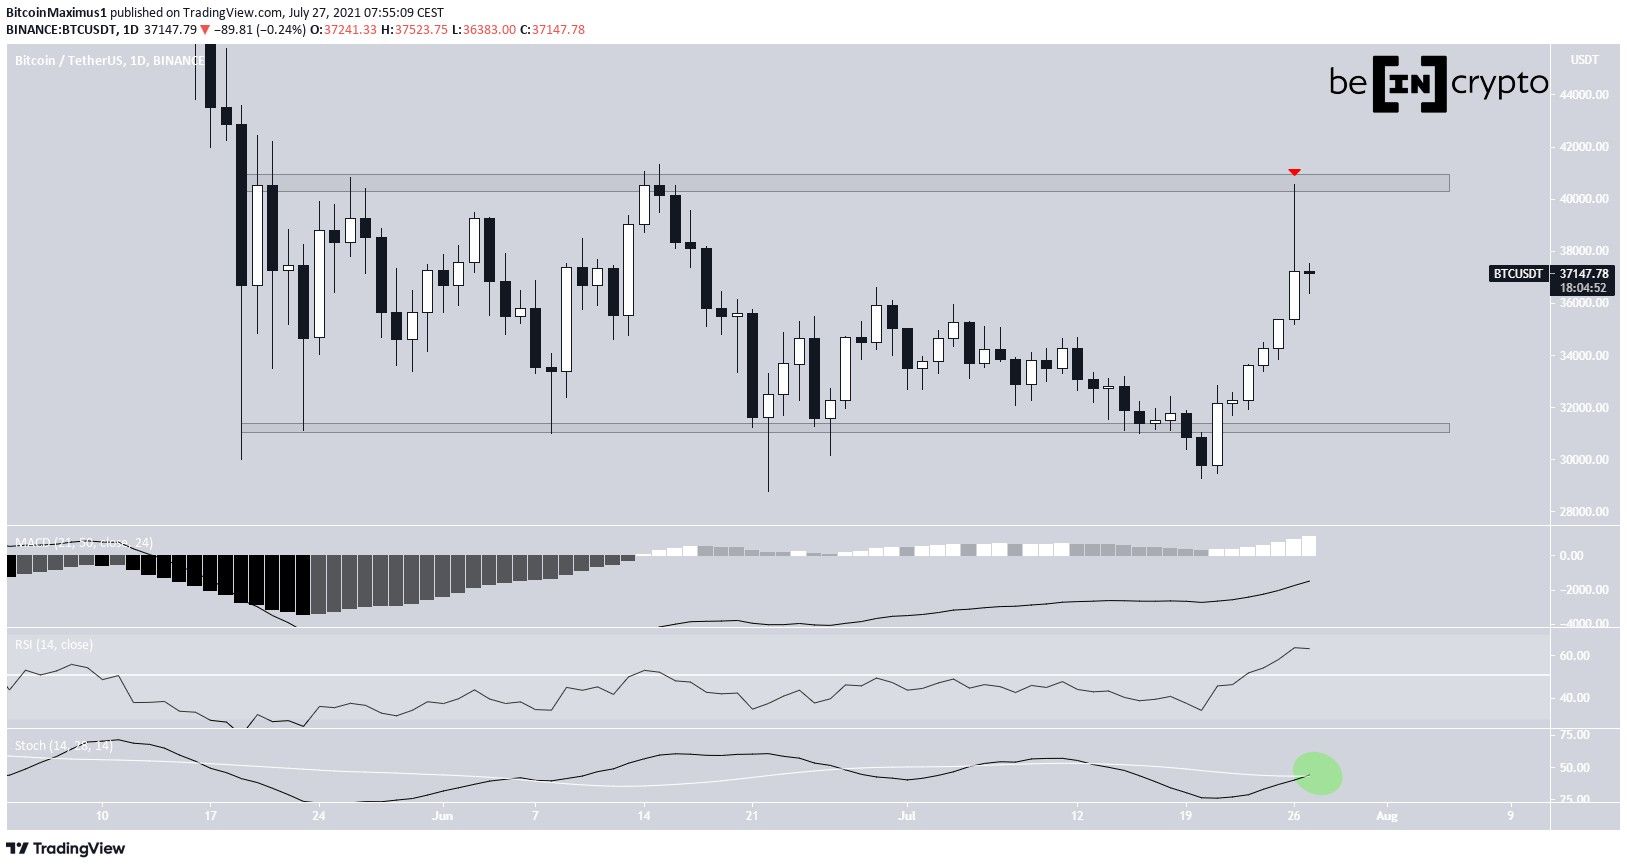
BTC increased considerably on July 26, managing to reach a high of $40,581 near the range highs.
However, the higher prices could not be sustained and BTC created a long upper wick (red icon) and decreased.
It’s currently trading near $37,400.
Technical indicators in the daily time frame are gradually turning bullish. The RSI is above 50, the Stochastic oscillator has made a bullish cross, and the MACD is increasing and has nearly crossed into positive territory.
ETH
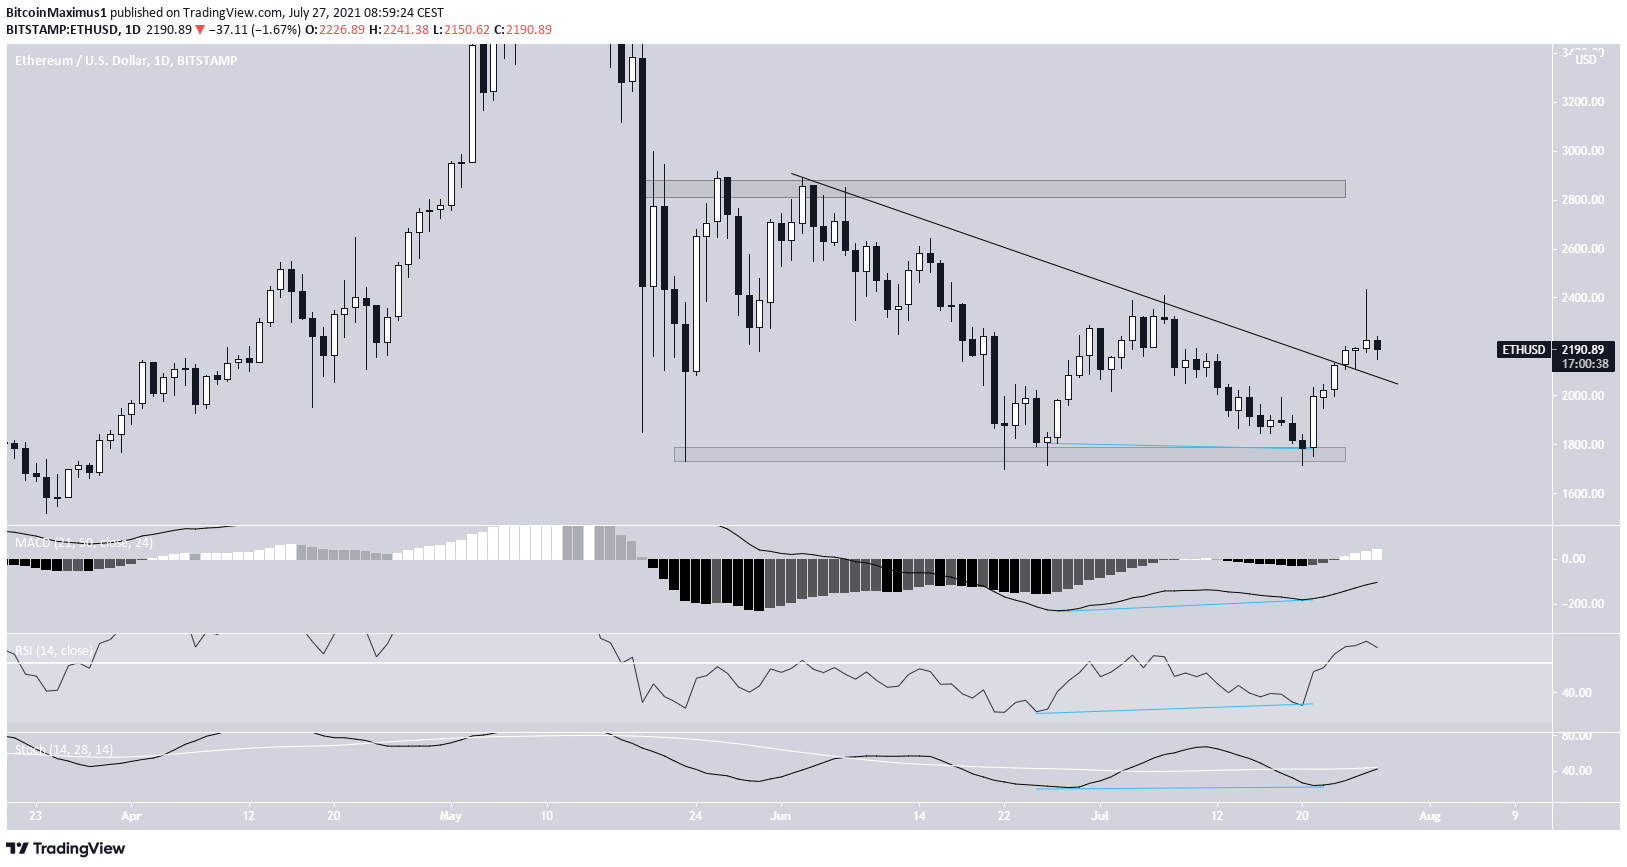
On June 26 and July 20, ETH made a double bottom inside the $1,760 horizontal support area. This bullish pattern was also combined with bullish divergences in the MACD, RSI, and Stochastic oscillator.
Following this, ETH managed to increase and break out from a descending resistance line. Currently, it’s attempting to validate the line as support.
If successful, the next closest resistance area would be found near $2,850.
XRP
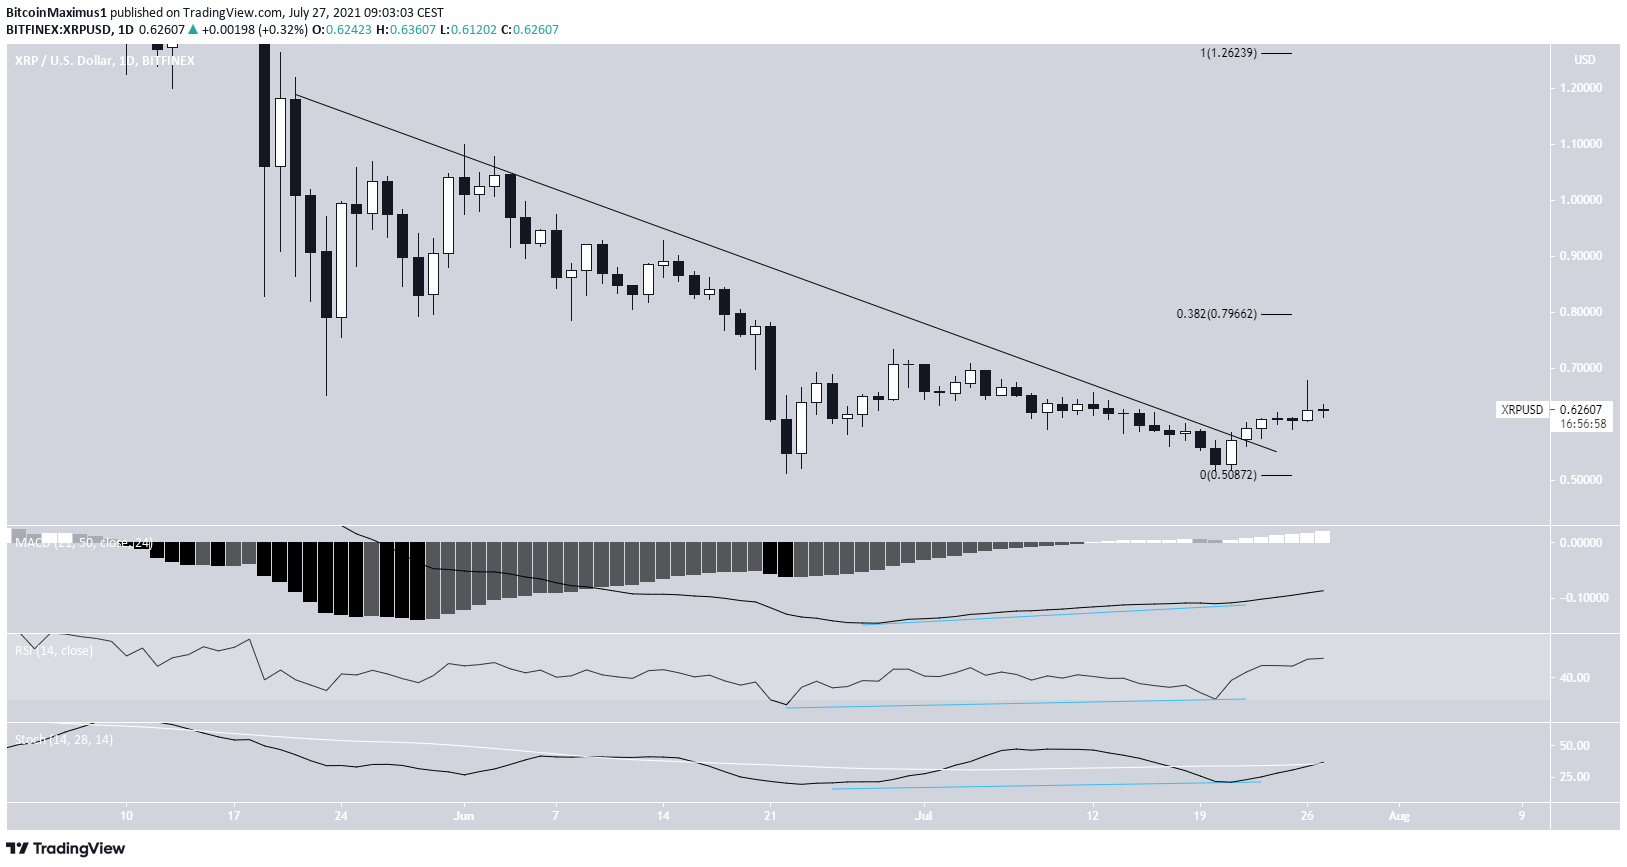
Similar to ETH, XRP also created a double bottom pattern on June 22 and July 20. In addition to this, the patter was combined with bullish divergences in the MACD, RSI, and Stochastic oscillator.
However, XRP has yet to initiate a significant upward move, even though it has broken out from a descending resistance line.
The closest resistance area is found at $0.80. This is the 0.382 Fib retracement resistance level.
XMR
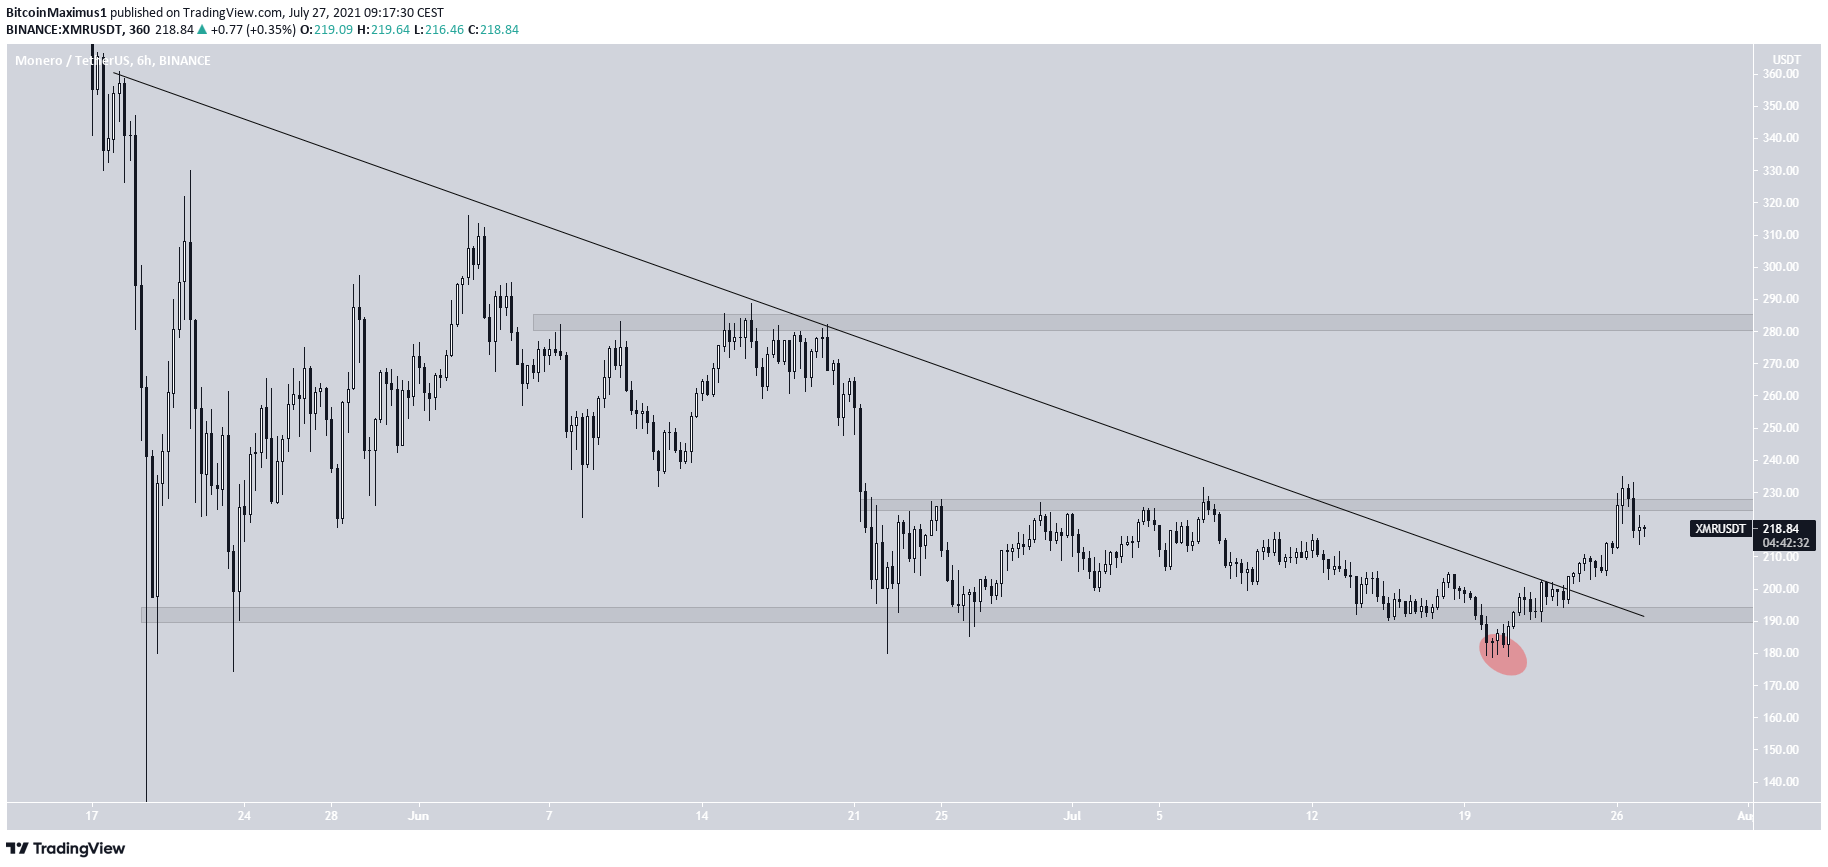
XMR has been decreasing underneath a descending resistance line since May 18. Throughout the downward move, it bounced at the $192 horizontal support area numerous times.
This appears to have created a descending triangle, which is normally considered a bearish pattern.
However, after deviating below the horizontal support (red circle), XMR managed to break out.
It was rejected by the $225 horizontal resistance area and is currently trying to find support. The next resistance level is found at $285.
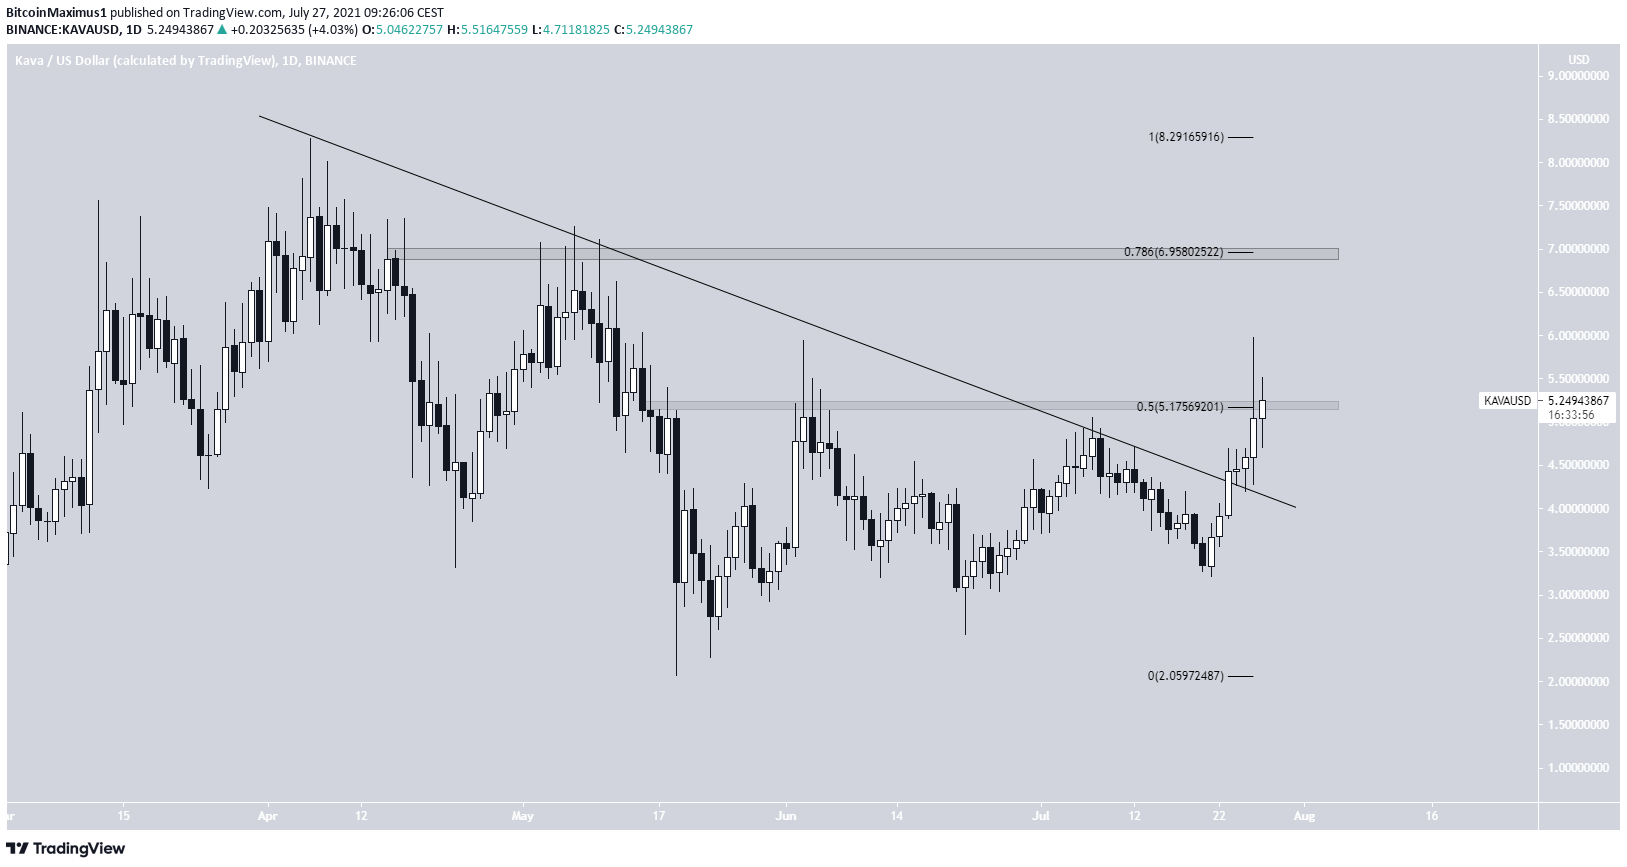
KAVA
KAVA has been moving upwards since May 17 and has created two higher lows so far. On July 23, it broke out from a descending resistance line that had been in place since the April highs.
It’s currently attempting to move above the $5.17 resistance. This is both a horizontal resistance area and the 0.5 Fib retracement resistance level.
If it’s successful in doing so, it would be likely to increase toward the next resistance at $6.95.
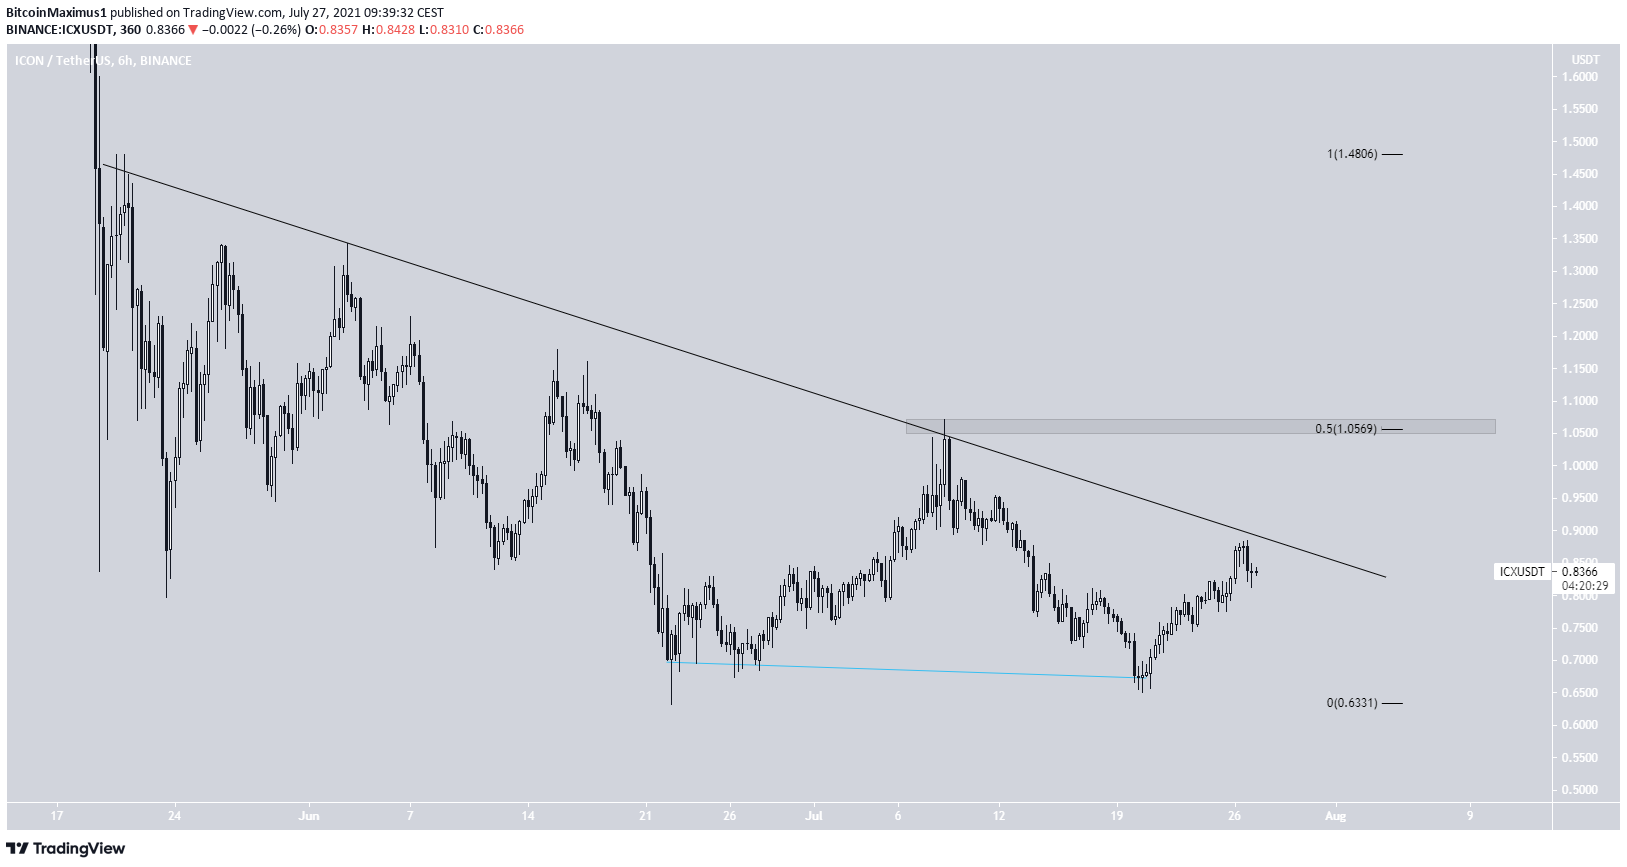
ICX
ICX has been following a descending resistance line since May 20. On June 22 an July 20, it reached lows near $0.63, creating a double bottom pattern.
While it has been increasing since, ICX has yet to break out from the aforementioned descending resistance line.
Doing so would likely take ICX toward the $1.05 resistance area. This is both the 0.5 Fib retracement resistance level and a horizontal resistance area.
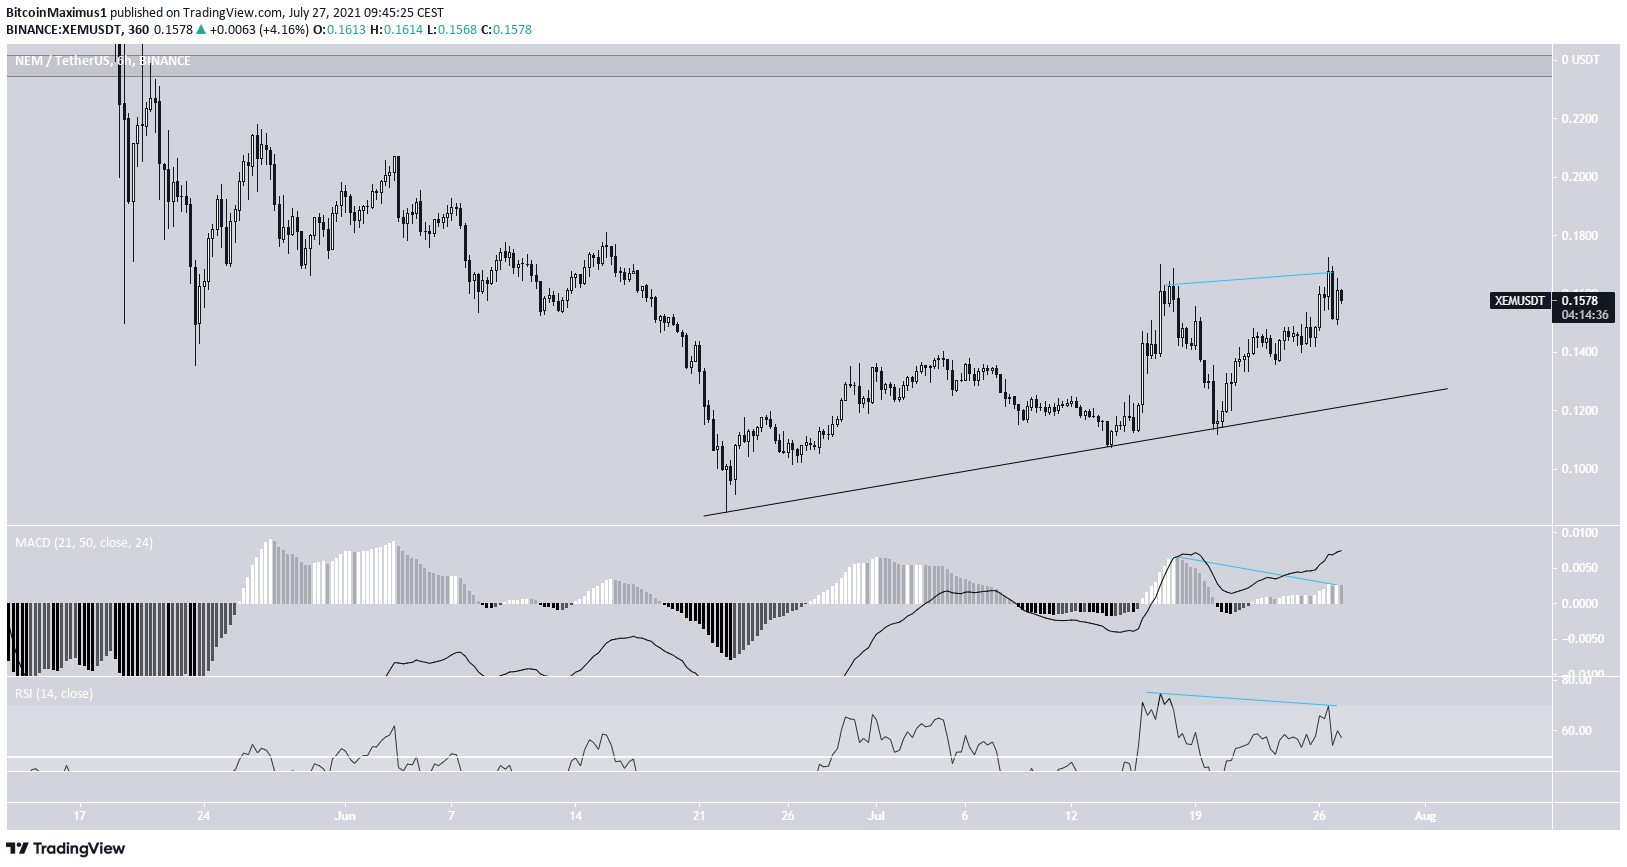
XEM
XEM has been moving upwards since June 22. It created higher lows on July 14 and 20, validating an ascending support line in the process.
However, it has created a short-term double top pattern, which has been combined with bearish divergences in the RSI and MACD. Therefore, another retest of the ascending support line could occur.
The next resistance target is found at $0.24.
For BeInCrypto’s latest bitcoin (BTC) analysis, click here.


