


Bitcoin (BTC) is approaching its all-time high price while trading inside a parallel channel.
Ethereum (ETH) has cleared a crucial short-term resistance area, indicating that it is likely to head higher. It has the potential to reach a new all-time high.
XRP (XRP) is trading in a range between $0.36-$0.63 and is currently moving towards the latter.
While the long-term outlook for both IOTA (IOTA) and TRON (TRX) is bullish, they are trading inside short-term bearish patterns and resistance areas.
Litecoin (LTC) has reclaimed the $177 area, which previously acted as a resistance.
Monero (XMR) has bounced at a strong support area but the upward move that followed has been weak.
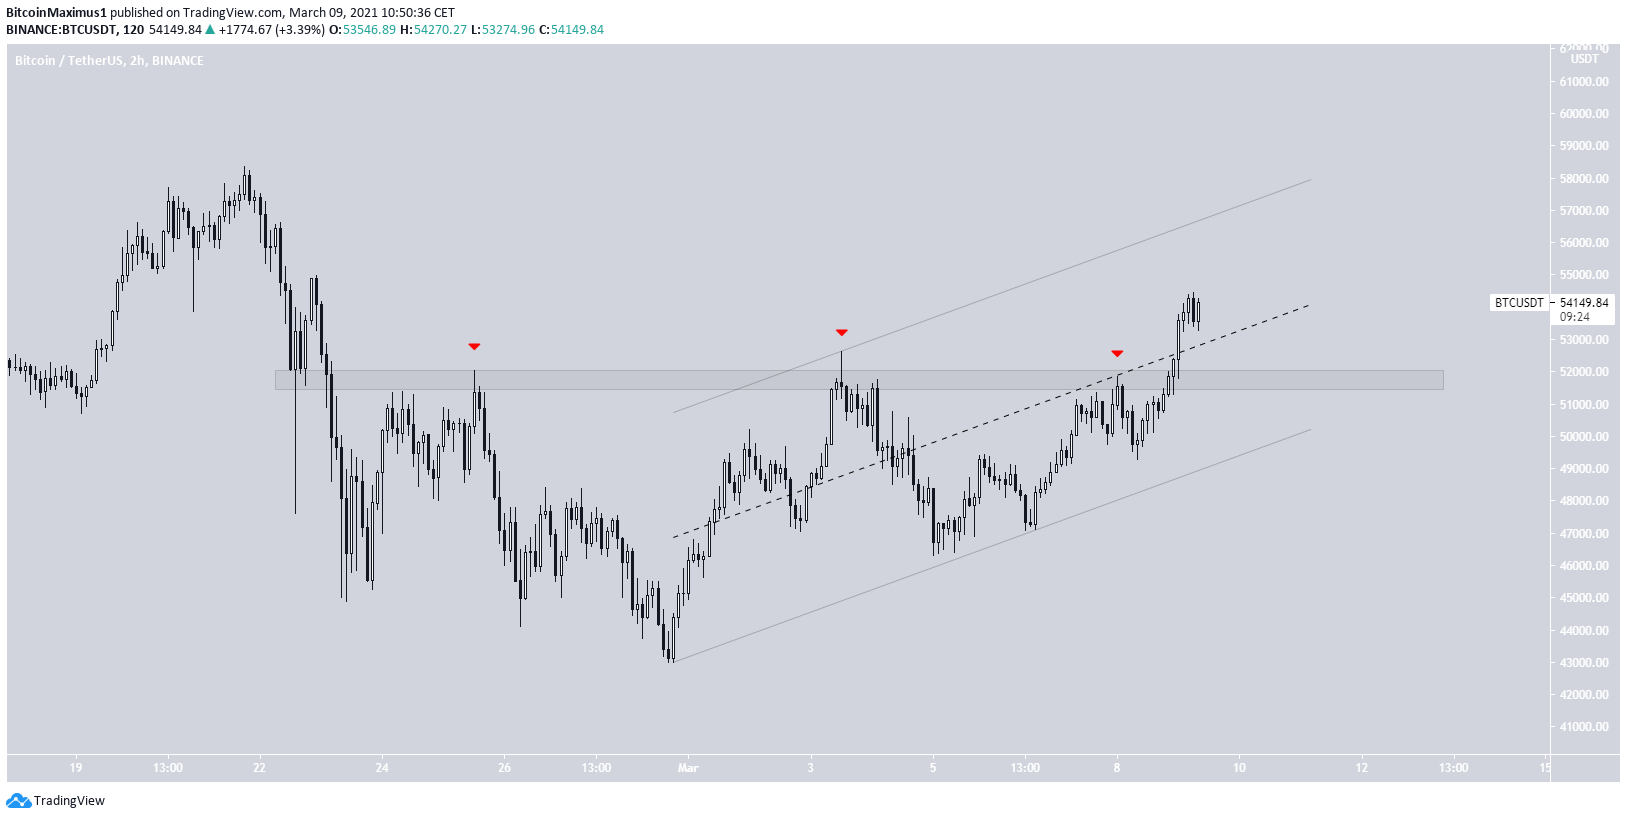
Bitcoin (BTC)
Bitcoin has been increasing since Feb. 28 when it hit a local low of $43,000. The upward movement since then has taken the form of a parallel ascending channel.
Today, BTC broke out above the middle of the channel at $52,000.
Therefore, Bitcoin is expected to increase at least until it reaches the top of the parallel channel.
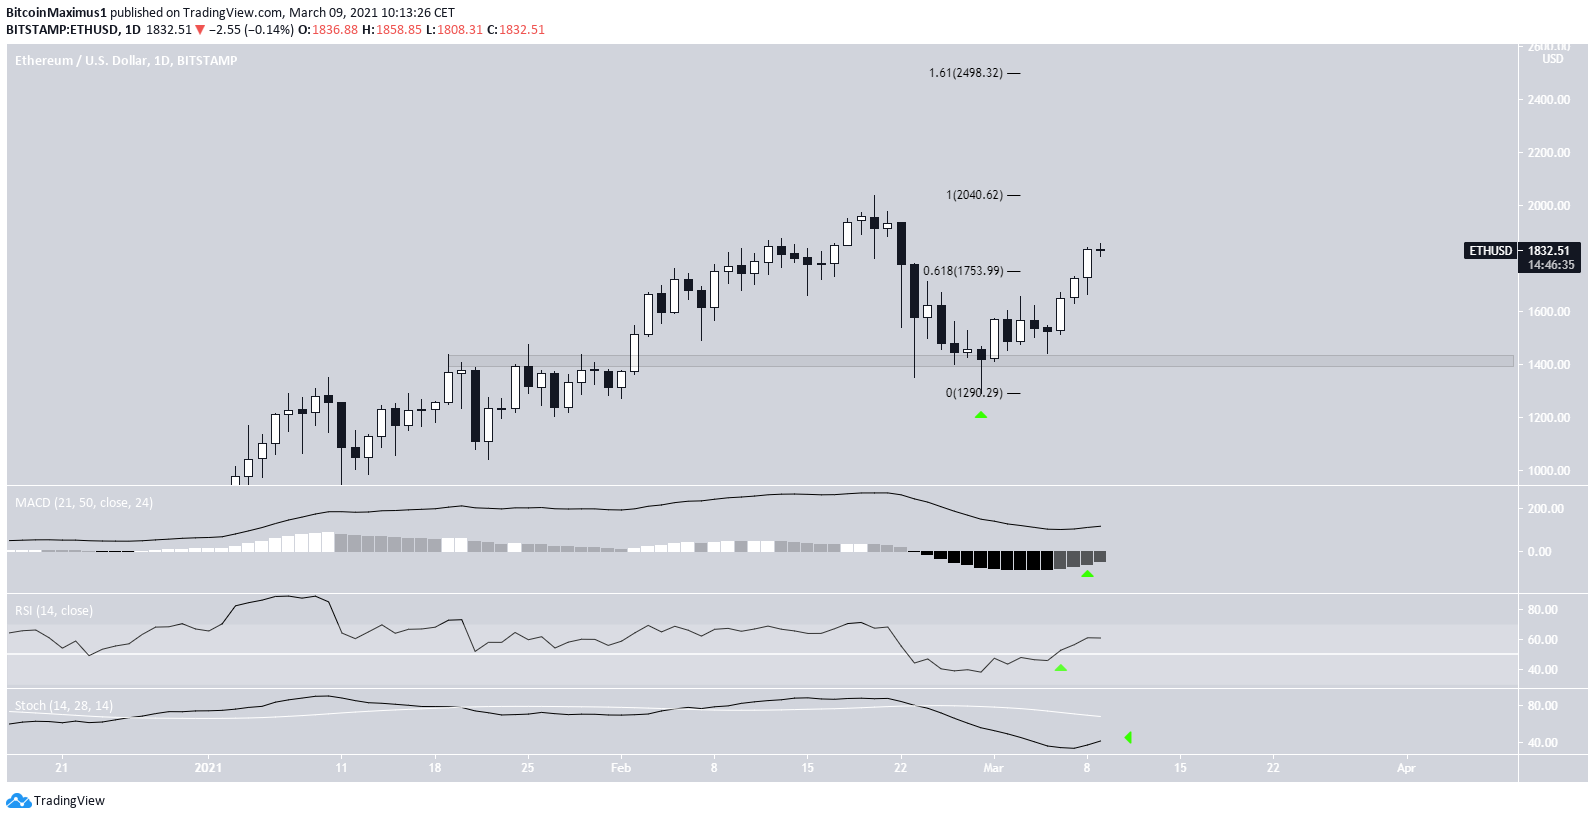
Ethereum (ETH)
ETH has been increasing since bouncing at the $1,400 support level on Feb. 28. While the upward movement was initially gradual, the rate of increase has picked up over the past three days.
Currently, ETH has moved above the 0.618 Fib retracement of the previous decrease. This is a sign that the upward move is not corrective, but rather is the beginning of a new impulse.
This is supported by multiple technical indicators. The MACD has given a bullish reversal signal and the RSI has moved above 50.
A potential bullish cross in the Stochastic oscillator would likely confirm that the trend is bullish.
A breakout above the February all-time high would take ETH to price discovery. Therefore, the next closest resistance area target would be found at $2,500.
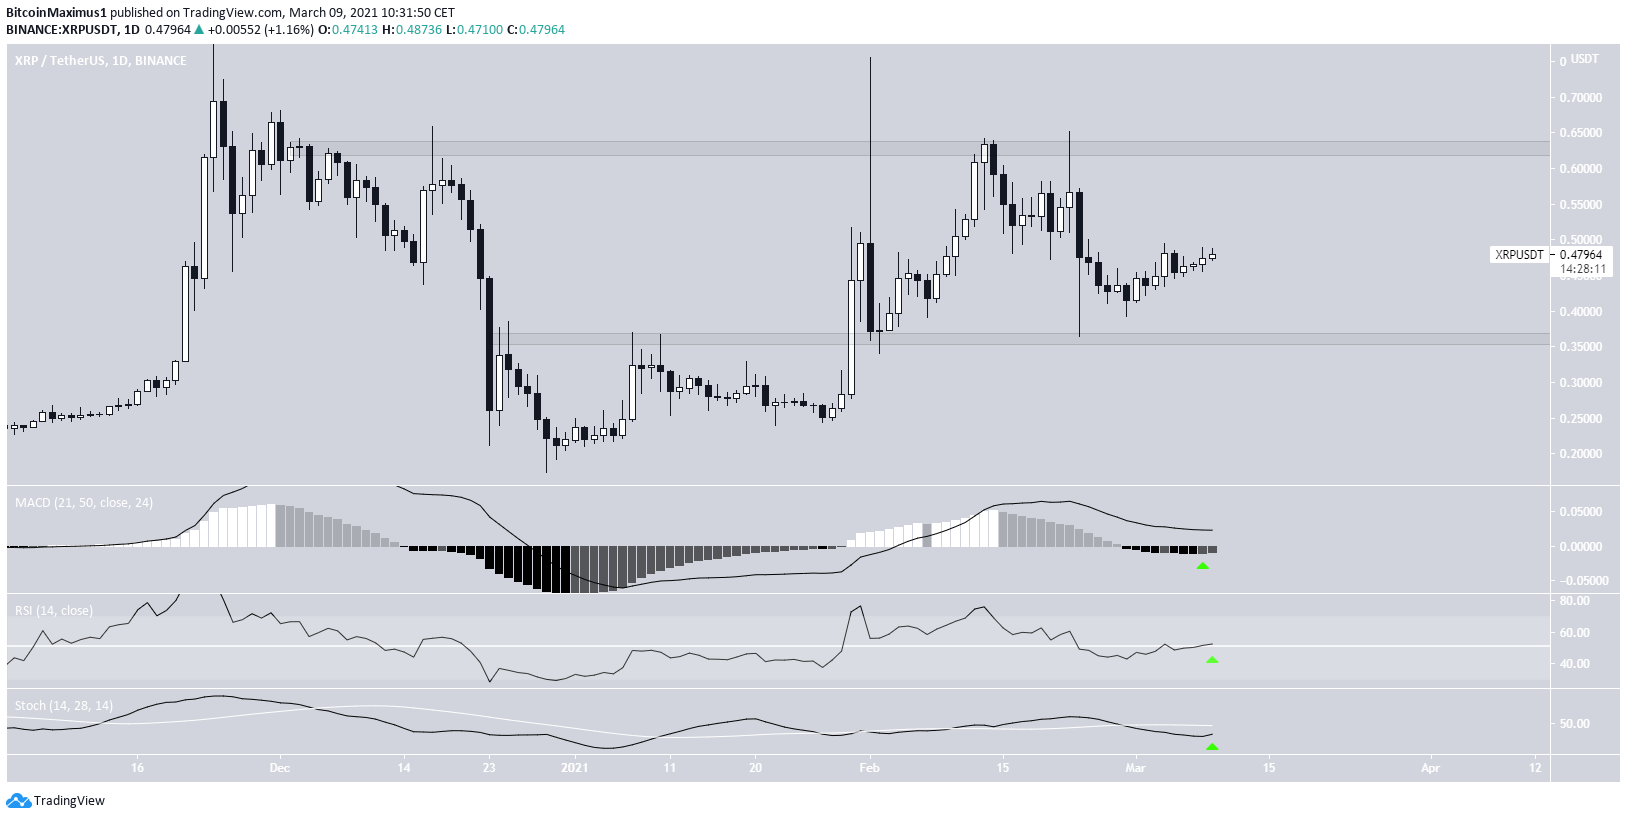
XRP (XRP)
XRP has been decreasing since Feb. 22, when it reached a local high of $0.65.
The decrease took XRP all the way back to the $0.36 support area where it bounced on Feb. 23.
Currently, XRP is trading in the middle of the $0.36-$0.63 range. Technical indicators are gradually turning bullish, so an upward movement towards $0.63 is expected.
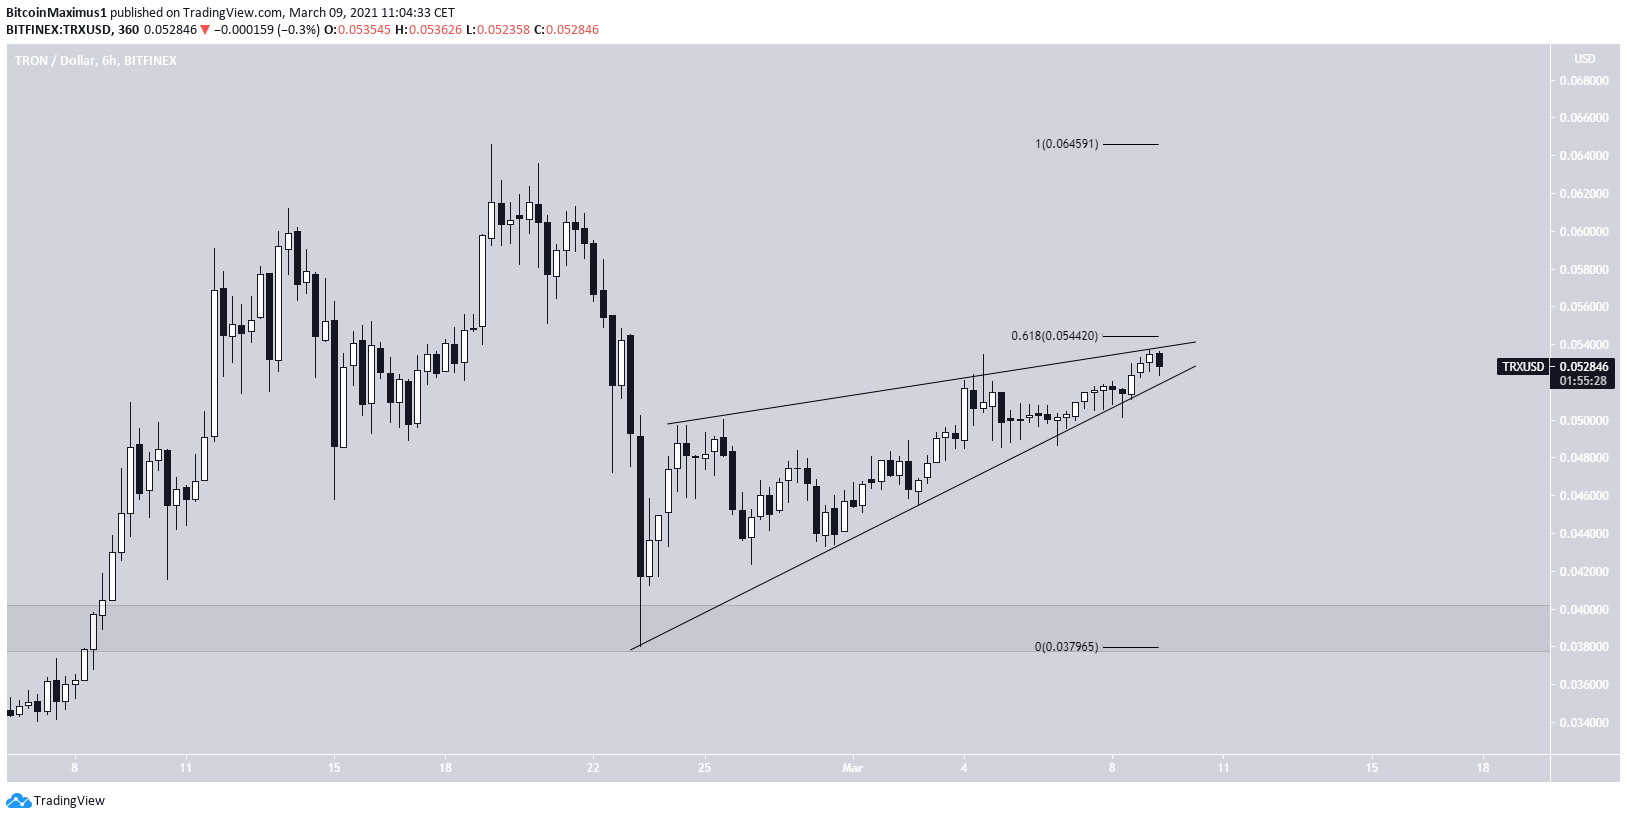
TRON (TRX)
The longer-term time-frames for TRX look bullish and show a retest of a long-term resistance area.
However, the six-hour chart shows that TRX is trading inside an ascending wedge. This is normally considered a bearish reversal pattern.
Furthermore, TRX is trading right at the 0.618 Fib retracement level of the previous decrease.
Therefore, a short-term drop could occur prior to the continuation of the upward movement.
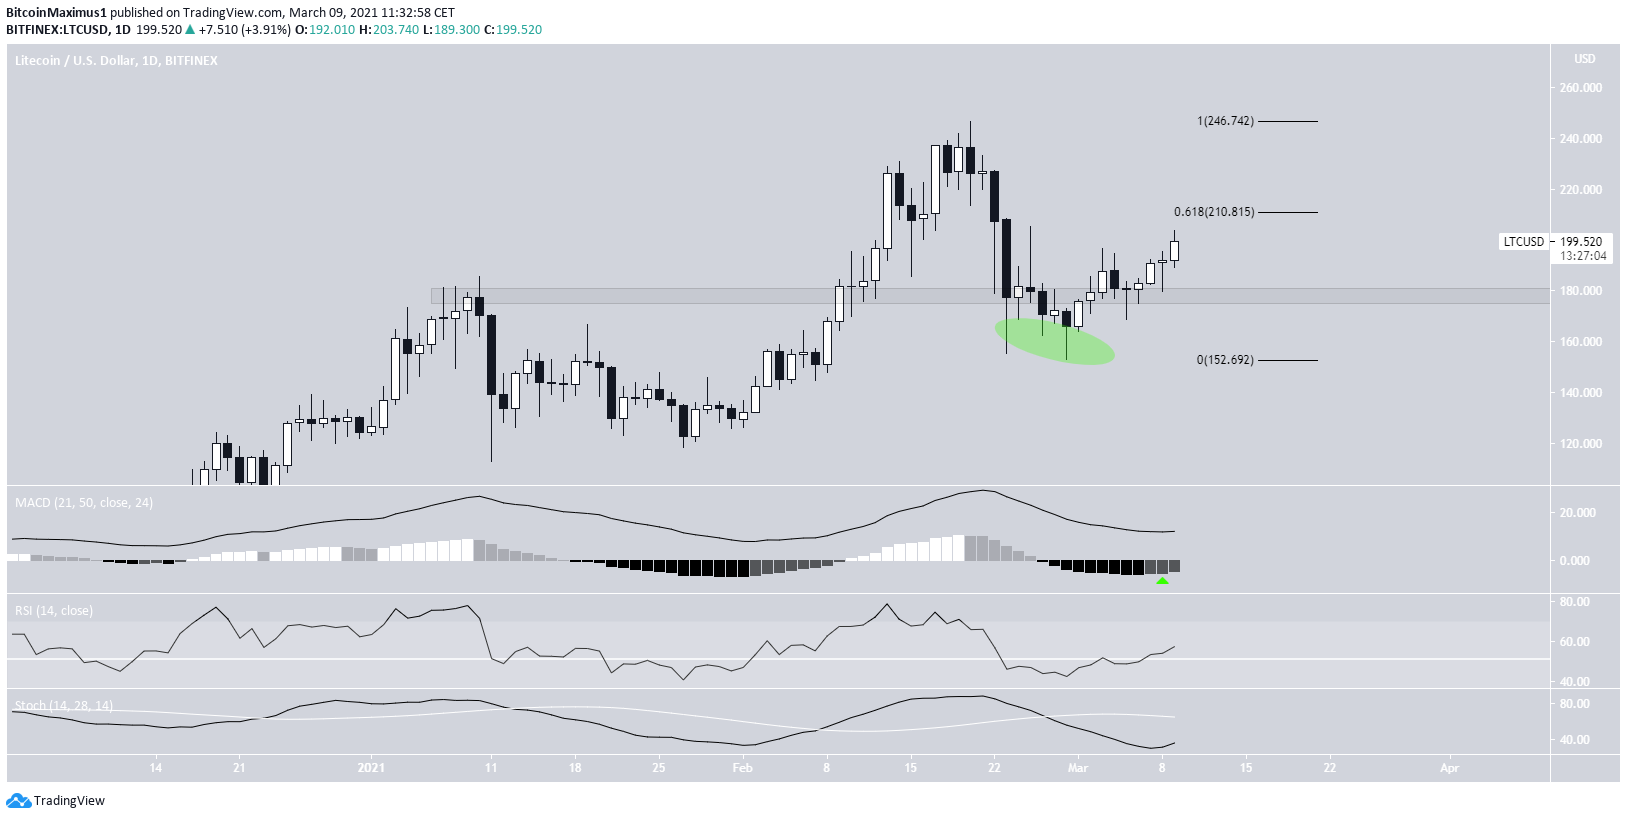
Litecoin (LTC)
On Feb. 23 and 28, LTC created two long lower wicks below the $137 support area. However, it reclaimed the area after and has been moving upwards.
While technical indicators have turned bullish, LTC has yet to move above the $210 resistance area. This is also the 0.618 Fib retracement of the most recent decrease.
Until LTC clears that, we cannot confirm that it is heading towards new highs.
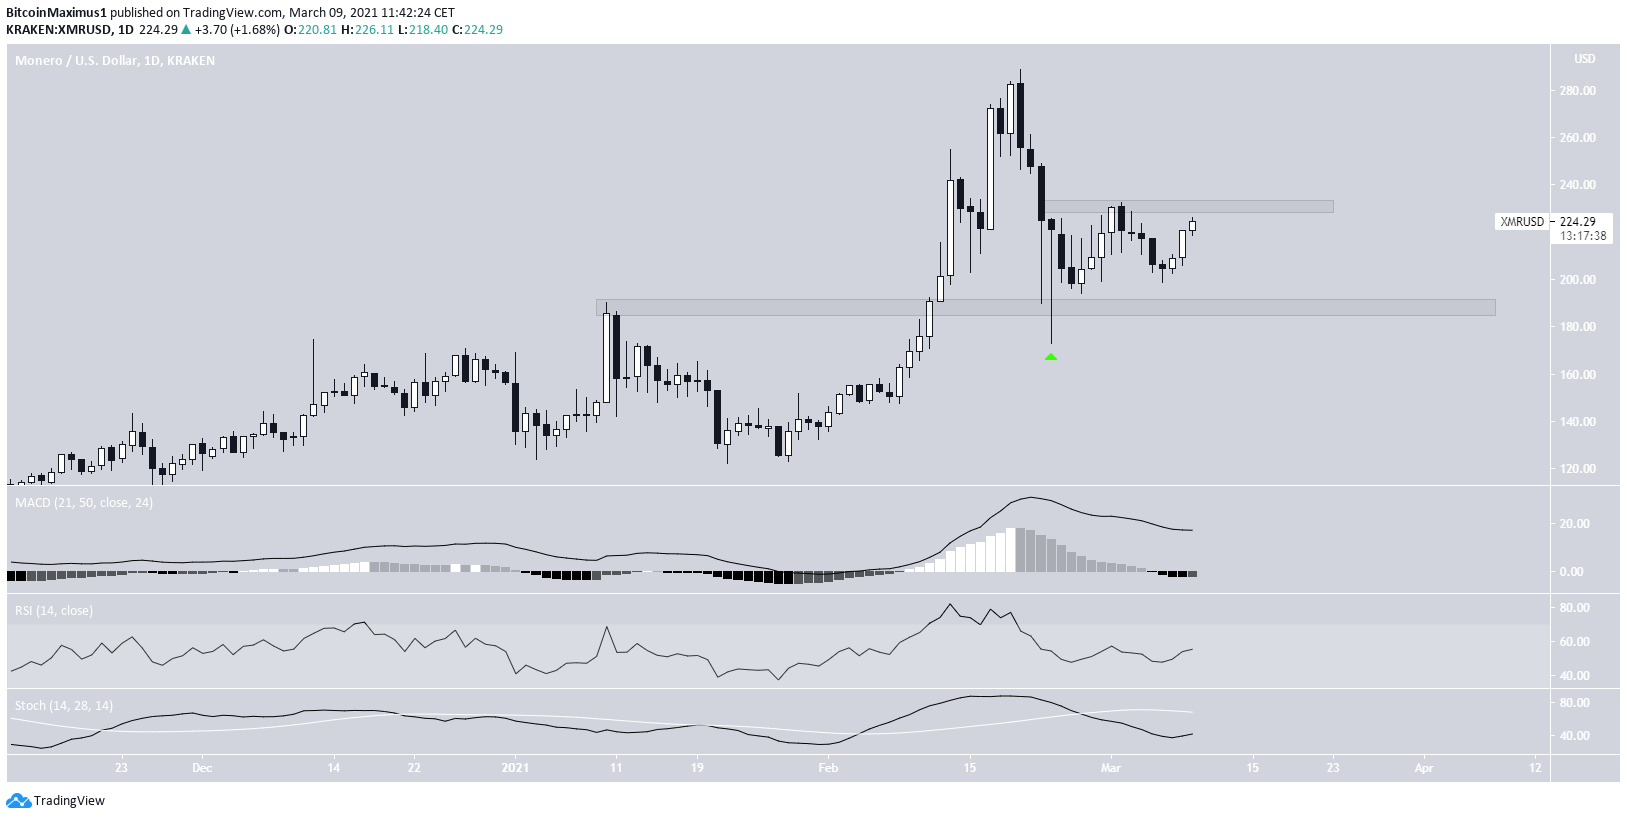
Monero (XMR)
On Feb. 23, XMR reached a low of $173 but created a very long lower wick and bounced immediately after.
The bounce that followed has been quite weak. XMR has yet to even clear the $230 resistance area, which was created immediately after the bounce.
Technical indicators are neutral. Thus, it’s possible that XMR will trade in a range between $185-$230.
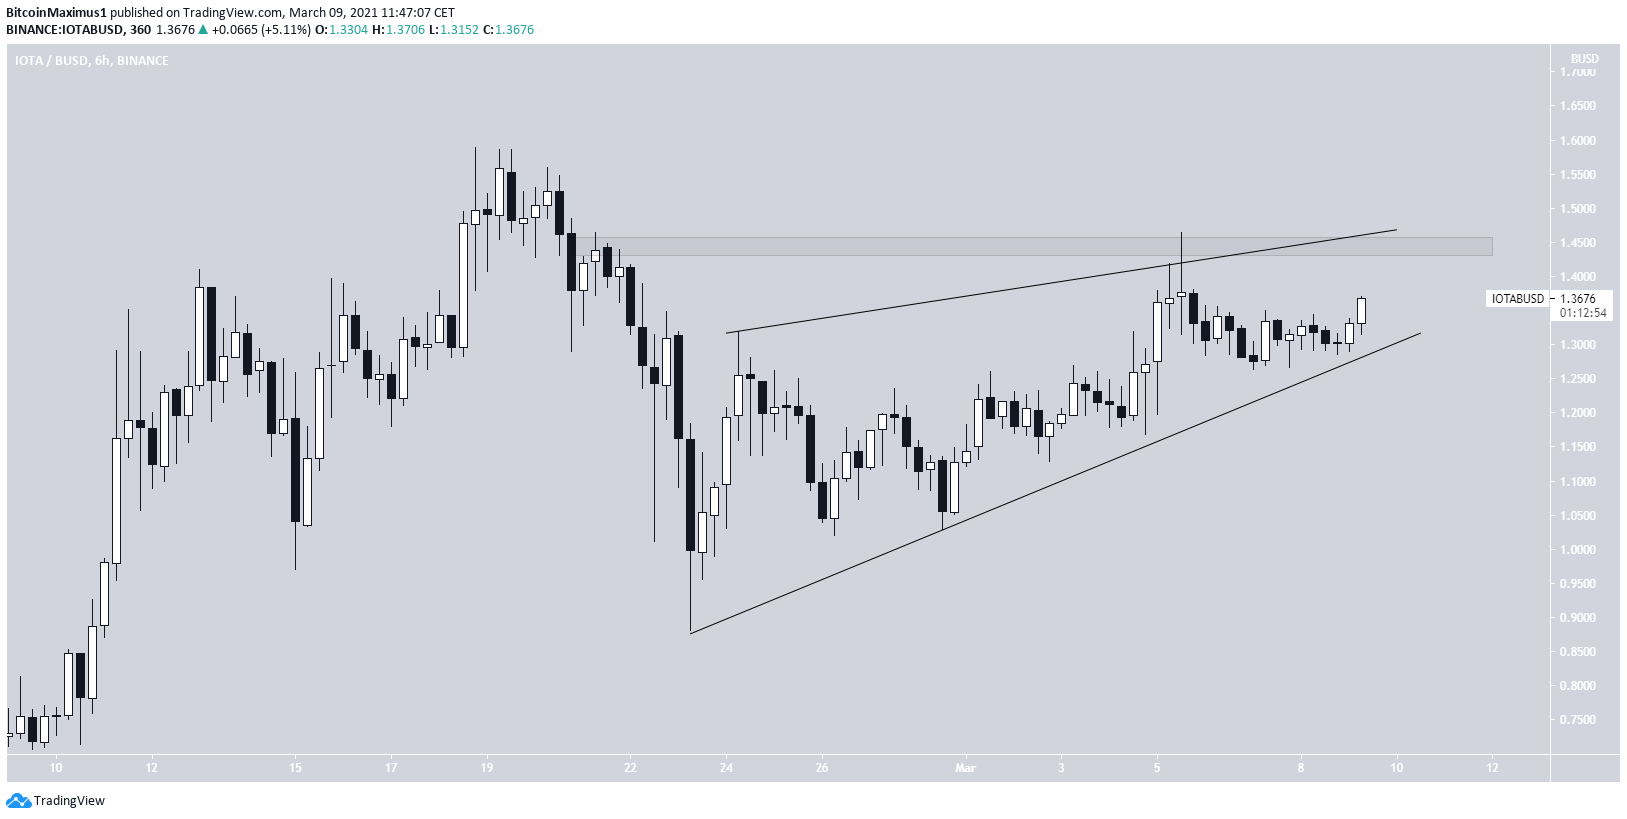
IOTA (IOTA)
IOTA has been trading inside an ascending wedge since Feb. 23. The ascending wedge is normally considered a bearish pattern.
Furthermore, its resistance line coincides with the $1.45 resistance area.
Therefore, until IOTA manages to clear this level, we cannot consider the short-term trend bullish.
For BeInCrypto’s latest Bitcoin (BTC) analysis, click here.


